Free Statistics
of Irreproducible Research!
Description of Statistical Computation | |||||||||||||||||||||||||||||||||||||||||||||
|---|---|---|---|---|---|---|---|---|---|---|---|---|---|---|---|---|---|---|---|---|---|---|---|---|---|---|---|---|---|---|---|---|---|---|---|---|---|---|---|---|---|---|---|---|---|
| Author's title | |||||||||||||||||||||||||||||||||||||||||||||
| Author | *Unverified author* | ||||||||||||||||||||||||||||||||||||||||||||
| R Software Module | rwasp_univariatedataseries.wasp | ||||||||||||||||||||||||||||||||||||||||||||
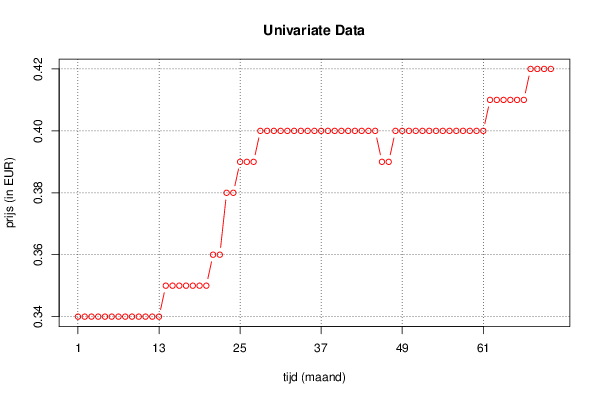
| Title produced by software | Univariate Data Series | ||||||||||||||||||||||||||||||||||||||||||||
| Date of computation | Mon, 24 Sep 2012 03:06:48 -0400 | ||||||||||||||||||||||||||||||||||||||||||||
| Cite this page as follows | Statistical Computations at FreeStatistics.org, Office for Research Development and Education, URL https://freestatistics.org/blog/index.php?v=date/2012/Sep/24/t1348470531i6f2rgrptra2i6h.htm/, Retrieved Sun, 28 Apr 2024 13:29:16 +0000 | ||||||||||||||||||||||||||||||||||||||||||||
| Statistical Computations at FreeStatistics.org, Office for Research Development and Education, URL https://freestatistics.org/blog/index.php?pk=169814, Retrieved Sun, 28 Apr 2024 13:29:16 +0000 | |||||||||||||||||||||||||||||||||||||||||||||
| QR Codes: | |||||||||||||||||||||||||||||||||||||||||||||
|
| |||||||||||||||||||||||||||||||||||||||||||||
| Original text written by user: | |||||||||||||||||||||||||||||||||||||||||||||
| IsPrivate? | No (this computation is public) | ||||||||||||||||||||||||||||||||||||||||||||
| User-defined keywords | |||||||||||||||||||||||||||||||||||||||||||||
| Estimated Impact | 130 | ||||||||||||||||||||||||||||||||||||||||||||
Tree of Dependent Computations | |||||||||||||||||||||||||||||||||||||||||||||
| Family? (F = Feedback message, R = changed R code, M = changed R Module, P = changed Parameters, D = changed Data) | |||||||||||||||||||||||||||||||||||||||||||||
| - [Univariate Data Series] [] [2012-09-24 07:06:48] [6a3415387e2fe7a9c468ed9333e4c178] [Current] - RMPD [Histogram] [histogram eigen s...] [2012-09-28 20:32:20] [3814b2d887862d3606085ab7f3bdf2a7] - RMPD [Histogram] [histogram 2 eigen...] [2012-09-28 20:35:49] [3814b2d887862d3606085ab7f3bdf2a7] - RMPD [Histogram] [histogram 3 eigen...] [2012-09-28 20:37:37] [3814b2d887862d3606085ab7f3bdf2a7] - RMPD [Kernel Density Estimation] [dichtheidgrafiek ...] [2012-09-28 20:41:10] [3814b2d887862d3606085ab7f3bdf2a7] | |||||||||||||||||||||||||||||||||||||||||||||
| Feedback Forum | |||||||||||||||||||||||||||||||||||||||||||||
Post a new message | |||||||||||||||||||||||||||||||||||||||||||||
Dataset | |||||||||||||||||||||||||||||||||||||||||||||
| Dataseries X: | |||||||||||||||||||||||||||||||||||||||||||||
0,34 0,34 0,34 0,34 0,34 0,34 0,34 0,34 0,34 0,34 0,34 0,34 0,34 0,35 0,35 0,35 0,35 0,35 0,35 0,35 0,36 0,36 0,38 0,38 0,39 0,39 0,39 0,4 0,4 0,4 0,4 0,4 0,4 0,4 0,4 0,4 0,4 0,4 0,4 0,4 0,4 0,4 0,4 0,4 0,4 0,39 0,39 0,4 0,4 0,4 0,4 0,4 0,4 0,4 0,4 0,4 0,4 0,4 0,4 0,4 0,4 0,41 0,41 0,41 0,41 0,41 0,41 0,42 0,42 0,42 0,42 | |||||||||||||||||||||||||||||||||||||||||||||
Tables (Output of Computation) | |||||||||||||||||||||||||||||||||||||||||||||
| |||||||||||||||||||||||||||||||||||||||||||||
Figures (Output of Computation) | |||||||||||||||||||||||||||||||||||||||||||||
Input Parameters & R Code | |||||||||||||||||||||||||||||||||||||||||||||
| Parameters (Session): | |||||||||||||||||||||||||||||||||||||||||||||
| par1 = Yoghurt met fruit (mager) 125 g ; par3 = Yoghurt met fruit (mager) 125 g ; par4 = 12 ; | |||||||||||||||||||||||||||||||||||||||||||||
| Parameters (R input): | |||||||||||||||||||||||||||||||||||||||||||||
| par1 = Yoghurt met fruit (mager) 125 g ; par2 = ; par3 = Yoghurt met fruit (mager) 125 g ; par4 = 12 ; | |||||||||||||||||||||||||||||||||||||||||||||
| R code (references can be found in the software module): | |||||||||||||||||||||||||||||||||||||||||||||
if (par4 != 'No season') { | |||||||||||||||||||||||||||||||||||||||||||||