Free Statistics
of Irreproducible Research!
Description of Statistical Computation | |||||||||||||||||||||||||||||||||||||||||
|---|---|---|---|---|---|---|---|---|---|---|---|---|---|---|---|---|---|---|---|---|---|---|---|---|---|---|---|---|---|---|---|---|---|---|---|---|---|---|---|---|---|
| Author's title | |||||||||||||||||||||||||||||||||||||||||
| Author | *Unverified author* | ||||||||||||||||||||||||||||||||||||||||
| R Software Module | rwasp_univariatedataseries.wasp | ||||||||||||||||||||||||||||||||||||||||
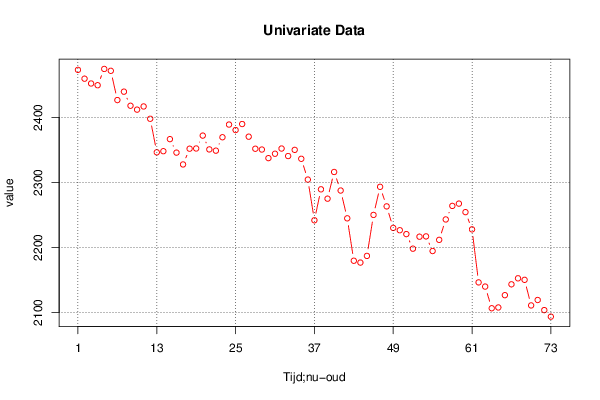
| Title produced by software | Univariate Data Series | ||||||||||||||||||||||||||||||||||||||||
| Date of computation | Mon, 24 Sep 2012 14:42:33 -0400 | ||||||||||||||||||||||||||||||||||||||||
| Cite this page as follows | Statistical Computations at FreeStatistics.org, Office for Research Development and Education, URL https://freestatistics.org/blog/index.php?v=date/2012/Sep/24/t134851223236n1zc6pgy6r92n.htm/, Retrieved Wed, 09 Jul 2025 07:16:37 +0000 | ||||||||||||||||||||||||||||||||||||||||
| Statistical Computations at FreeStatistics.org, Office for Research Development and Education, URL https://freestatistics.org/blog/index.php?pk=169932, Retrieved Wed, 09 Jul 2025 07:16:37 +0000 | |||||||||||||||||||||||||||||||||||||||||
| QR Codes: | |||||||||||||||||||||||||||||||||||||||||
|
| |||||||||||||||||||||||||||||||||||||||||
| Original text written by user: | |||||||||||||||||||||||||||||||||||||||||
| IsPrivate? | No (this computation is public) | ||||||||||||||||||||||||||||||||||||||||
| User-defined keywords | |||||||||||||||||||||||||||||||||||||||||
| Estimated Impact | 232 | ||||||||||||||||||||||||||||||||||||||||
Tree of Dependent Computations | |||||||||||||||||||||||||||||||||||||||||
| Family? (F = Feedback message, R = changed R code, M = changed R Module, P = changed Parameters, D = changed Data) | |||||||||||||||||||||||||||||||||||||||||
| - [Univariate Data Series] [] [2012-09-24 18:42:33] [0dfc9291120e0017631158d00b067a5a] [Current] | |||||||||||||||||||||||||||||||||||||||||
| Feedback Forum | |||||||||||||||||||||||||||||||||||||||||
Post a new message | |||||||||||||||||||||||||||||||||||||||||
Dataset | |||||||||||||||||||||||||||||||||||||||||
| Dataseries X: | |||||||||||||||||||||||||||||||||||||||||
2473,01 2459,46 2452,08 2449,4 2474,45 2471,6 2426,57 2439,49 2417,83 2411,84 2416,73 2397,79 2346,18 2347,9 2366,47 2345,69 2327,51 2351,74 2352,07 2371,93 2350,64 2348,72 2369,35 2388,88 2380,43 2389,71 2370,22 2351,68 2350,44 2337,21 2343,99 2351,98 2340,44 2349,96 2336,22 2304,23 2241,6 2289,26 2274,84 2315,91 2287,37 2244,64 2179,33 2176,53 2186,76 2249,84 2293,07 2262,99 2229,85 2226,3 2220,34 2197,9 2216,32 2216,8 2194,31 2211,5 2242,88 2263,73 2267,24 2254,13 2227,63 2146,05 2139,61 2106,24 2107,44 2126,37 2143,09 2152,35 2149,97 2110,59 2118,95 2103,41 2093,32 | |||||||||||||||||||||||||||||||||||||||||
Tables (Output of Computation) | |||||||||||||||||||||||||||||||||||||||||
| |||||||||||||||||||||||||||||||||||||||||
Figures (Output of Computation) | |||||||||||||||||||||||||||||||||||||||||
Input Parameters & R Code | |||||||||||||||||||||||||||||||||||||||||
| Parameters (Session): | |||||||||||||||||||||||||||||||||||||||||
| par1 = BEL20 ; par2 = http://www.nbb.be/belgostat/PublicatieSelectieLinker?LinkID=227000012|910000082&Lang=N ; par3 = Laatste 72 indexcijfers van de BEL20-index ; par4 = 12 ; | |||||||||||||||||||||||||||||||||||||||||
| Parameters (R input): | |||||||||||||||||||||||||||||||||||||||||
| par1 = BEL20 ; par2 = http://www.nbb.be/belgostat/PublicatieSelectieLinker?LinkID=227000012|910000082&Lang=N ; par3 = Laatste 72 indexcijfers van de BEL20-index ; par4 = 12 ; | |||||||||||||||||||||||||||||||||||||||||
| R code (references can be found in the software module): | |||||||||||||||||||||||||||||||||||||||||
par4 <- '12' | |||||||||||||||||||||||||||||||||||||||||