\begin{tabular}{lllllllll}
\hline
Summary of computational transaction \tabularnewline
Raw Input & view raw input (R code)  \tabularnewline
Raw Output & view raw output of R engine  \tabularnewline
Computing time & 4 seconds \tabularnewline
R Server & 'Gertrude Mary Cox' @ cox.wessa.net \tabularnewline
\hline
\end{tabular}
%Source: https://freestatistics.org/blog/index.php?pk=170413&T=0
[TABLE]
[ROW][C]Summary of computational transaction[/C][/ROW]
[ROW][C]Raw Input[/C][C]view raw input (R code) [/C][/ROW]
[ROW][C]Raw Output[/C][C]view raw output of R engine [/C][/ROW]
[ROW][C]Computing time[/C][C]4 seconds[/C][/ROW]
[ROW][C]R Server[/C][C]'Gertrude Mary Cox' @ cox.wessa.net[/C][/ROW]
[/TABLE]
Source: https://freestatistics.org/blog/index.php?pk=170413&T=0
If you paste this QR Code into your document, anyone with a smartphone or tablet will be able to scan it and view this table in a browser.
If you paste this QR Code into your document, anyone with a smartphone or tablet will be able to scan it and view this table in a browser.
If you paste this QR Code into your document, anyone with a smartphone or tablet will be able to scan it and view this table in a browser.
If you paste this QR Code into your document, anyone with a smartphone or tablet will be able to scan it and view this table in a browser.
If you paste this QR Code into your document, anyone with a smartphone or tablet will be able to scan it and view this table in a browser.
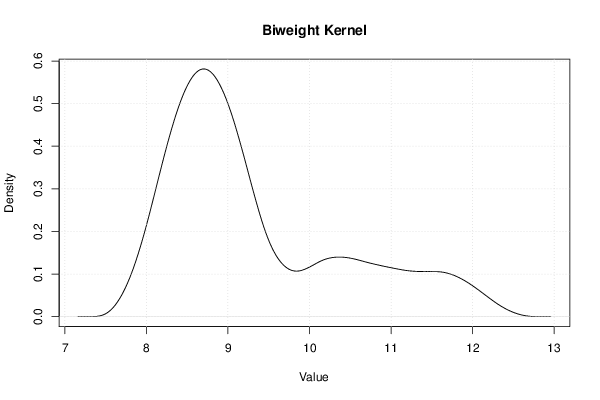
| Properties of Density Trace | | Bandwidth | 0.403099852241491 | | #Observations | 72 |
\begin{tabular}{lllllllll}
\hline
Properties of Density Trace \tabularnewline
Bandwidth & 0.403099852241491 \tabularnewline
#Observations & 72 \tabularnewline
\hline
\end{tabular}
%Source: https://freestatistics.org/blog/index.php?pk=170413&T=1
[TABLE]
[ROW][C]Properties of Density Trace[/C][/ROW]
[ROW][C]Bandwidth[/C][C]0.403099852241491[/C][/ROW]
[ROW][C]#Observations[/C][C]72[/C][/ROW]
[/TABLE]
Source: https://freestatistics.org/blog/index.php?pk=170413&T=1
Globally Unique Identifier (entire table): ba.freestatistics.org/blog/index.php?pk=170413&T=1
As an alternative you can also use a QR Code:
The GUIDs for individual cells are displayed in the table below:
| Properties of Density Trace | | Bandwidth | 0.403099852241491 | | #Observations | 72 |
If you paste this QR Code into your document, anyone with a smartphone or tablet will be able to scan it and view this table in a browser.
If you paste this QR Code into your document, anyone with a smartphone or tablet will be able to scan it and view this table in a browser.
If you paste this QR Code into your document, anyone with a smartphone or tablet will be able to scan it and view this table in a browser.
If you paste this QR Code into your document, anyone with a smartphone or tablet will be able to scan it and view this table in a browser.
If you paste this QR Code into your document, anyone with a smartphone or tablet will be able to scan it and view this table in a browser.
| Maximum Density Values | | Kernel | x-value | max. density | | Gaussian | 8.70396752630695 | 0.625720544327268 | | Epanechnikov | 8.70396752630695 | 0.561155836833257 | | Rectangular | 8.39758362011689 | 0.507264438825676 | | Triangular | 8.69261997422583 | 0.592528234724743 | | Biweight | 8.70396752630695 | 0.581379743528299 | | Cosine | 8.70396752630695 | 0.58844948560548 | | Optcosine | 8.70396752630695 | 0.5676231331402 |
\begin{tabular}{lllllllll}
\hline
Maximum Density Values \tabularnewline
Kernel & x-value & max. density \tabularnewline
Gaussian & 8.70396752630695 & 0.625720544327268 \tabularnewline
Epanechnikov & 8.70396752630695 & 0.561155836833257 \tabularnewline
Rectangular & 8.39758362011689 & 0.507264438825676 \tabularnewline
Triangular & 8.69261997422583 & 0.592528234724743 \tabularnewline
Biweight & 8.70396752630695 & 0.581379743528299 \tabularnewline
Cosine & 8.70396752630695 & 0.58844948560548 \tabularnewline
Optcosine & 8.70396752630695 & 0.5676231331402 \tabularnewline
 \hline
\end{tabular}
%Source: https://freestatistics.org/blog/index.php?pk=170413&T=2
[TABLE]
[ROW][C]Maximum Density Values[/C][/ROW]
[ROW][C]Kernel[/C][C]x-value[/C][C]max. density[/C][/ROW]
[ROW][C]Gaussian[/C][C]8.70396752630695[/C][C]0.625720544327268[/C][/ROW]
[ROW][C]Epanechnikov[/C][C]8.70396752630695[/C][C]0.561155836833257[/C][/ROW]
[ROW][C]Rectangular[/C][C]8.39758362011689[/C][C]0.507264438825676[/C][/ROW]
[ROW][C]Triangular[/C][C]8.69261997422583[/C][C]0.592528234724743[/C][/ROW]
[ROW][C]Biweight[/C][C]8.70396752630695[/C][C]0.581379743528299[/C][/ROW]
[ROW][C]Cosine[/C][C]8.70396752630695[/C][C]0.58844948560548[/C][/ROW]
[ROW][C]Optcosine[/C][C]8.70396752630695[/C][C]0.5676231331402[/C][/ROW]
 [/TABLE]
Source: https://freestatistics.org/blog/index.php?pk=170413&T=2
Globally Unique Identifier (entire table): ba.freestatistics.org/blog/index.php?pk=170413&T=2
As an alternative you can also use a QR Code:
The GUIDs for individual cells are displayed in the table below:
| Maximum Density Values | | Kernel | x-value | max. density | | Gaussian | 8.70396752630695 | 0.625720544327268 | | Epanechnikov | 8.70396752630695 | 0.561155836833257 | | Rectangular | 8.39758362011689 | 0.507264438825676 | | Triangular | 8.69261997422583 | 0.592528234724743 | | Biweight | 8.70396752630695 | 0.581379743528299 | | Cosine | 8.70396752630695 | 0.58844948560548 | | Optcosine | 8.70396752630695 | 0.5676231331402 |
If you paste this QR Code into your document, anyone with a smartphone or tablet will be able to scan it and view this table in a browser.
If you paste this QR Code into your document, anyone with a smartphone or tablet will be able to scan it and view this table in a browser.
If you paste this QR Code into your document, anyone with a smartphone or tablet will be able to scan it and view this table in a browser.
If you paste this QR Code into your document, anyone with a smartphone or tablet will be able to scan it and view this table in a browser.
If you paste this QR Code into your document, anyone with a smartphone or tablet will be able to scan it and view this table in a browser.
| Maximum Density Values | | Kernel | x-value | max. density | | Gaussian | 8.70396752630695 | 0.625720544327268 | | Epanechnikov | 8.70396752630695 | 0.561155836833257 | | Rectangular | 8.408931172198 | 0.507264438825676 | | Triangular | 8.69261997422583 | 0.592528234724743 | | Biweight | 8.70396752630695 | 0.581379743528299 | | Cosine | 8.70396752630695 | 0.58844948560548 | | Optcosine | 8.70396752630695 | 0.5676231331402 |
\begin{tabular}{lllllllll}
\hline
Maximum Density Values \tabularnewline
Kernel & x-value & max. density \tabularnewline
Gaussian & 8.70396752630695 & 0.625720544327268 \tabularnewline
Epanechnikov & 8.70396752630695 & 0.561155836833257 \tabularnewline
Rectangular & 8.408931172198 & 0.507264438825676 \tabularnewline
Triangular & 8.69261997422583 & 0.592528234724743 \tabularnewline
Biweight & 8.70396752630695 & 0.581379743528299 \tabularnewline
Cosine & 8.70396752630695 & 0.58844948560548 \tabularnewline
Optcosine & 8.70396752630695 & 0.5676231331402 \tabularnewline
 \hline
\end{tabular}
%Source: https://freestatistics.org/blog/index.php?pk=170413&T=3
[TABLE]
[ROW][C]Maximum Density Values[/C][/ROW]
[ROW][C]Kernel[/C][C]x-value[/C][C]max. density[/C][/ROW]
[ROW][C]Gaussian[/C][C]8.70396752630695[/C][C]0.625720544327268[/C][/ROW]
[ROW][C]Epanechnikov[/C][C]8.70396752630695[/C][C]0.561155836833257[/C][/ROW]
[ROW][C]Rectangular[/C][C]8.408931172198[/C][C]0.507264438825676[/C][/ROW]
[ROW][C]Triangular[/C][C]8.69261997422583[/C][C]0.592528234724743[/C][/ROW]
[ROW][C]Biweight[/C][C]8.70396752630695[/C][C]0.581379743528299[/C][/ROW]
[ROW][C]Cosine[/C][C]8.70396752630695[/C][C]0.58844948560548[/C][/ROW]
[ROW][C]Optcosine[/C][C]8.70396752630695[/C][C]0.5676231331402[/C][/ROW]
 [/TABLE]
Source: https://freestatistics.org/blog/index.php?pk=170413&T=3
Globally Unique Identifier (entire table): ba.freestatistics.org/blog/index.php?pk=170413&T=3
As an alternative you can also use a QR Code:
The GUIDs for individual cells are displayed in the table below:
| Maximum Density Values | | Kernel | x-value | max. density | | Gaussian | 8.70396752630695 | 0.625720544327268 | | Epanechnikov | 8.70396752630695 | 0.561155836833257 | | Rectangular | 8.408931172198 | 0.507264438825676 | | Triangular | 8.69261997422583 | 0.592528234724743 | | Biweight | 8.70396752630695 | 0.581379743528299 | | Cosine | 8.70396752630695 | 0.58844948560548 | | Optcosine | 8.70396752630695 | 0.5676231331402 |
If you paste this QR Code into your document, anyone with a smartphone or tablet will be able to scan it and view this table in a browser.
If you paste this QR Code into your document, anyone with a smartphone or tablet will be able to scan it and view this table in a browser.
If you paste this QR Code into your document, anyone with a smartphone or tablet will be able to scan it and view this table in a browser.
If you paste this QR Code into your document, anyone with a smartphone or tablet will be able to scan it and view this table in a browser.
If you paste this QR Code into your document, anyone with a smartphone or tablet will be able to scan it and view this table in a browser.
| Maximum Density Values | | Kernel | x-value | max. density | | Gaussian | 8.70396752630695 | 0.625720544327268 | | Epanechnikov | 8.70396752630695 | 0.561155836833257 | | Rectangular | 8.42027872427911 | 0.507264438825676 | | Triangular | 8.69261997422583 | 0.592528234724743 | | Biweight | 8.70396752630695 | 0.581379743528299 | | Cosine | 8.70396752630695 | 0.58844948560548 | | Optcosine | 8.70396752630695 | 0.5676231331402 |
\begin{tabular}{lllllllll}
\hline
Maximum Density Values \tabularnewline
Kernel & x-value & max. density \tabularnewline
Gaussian & 8.70396752630695 & 0.625720544327268 \tabularnewline
Epanechnikov & 8.70396752630695 & 0.561155836833257 \tabularnewline
Rectangular & 8.42027872427911 & 0.507264438825676 \tabularnewline
Triangular & 8.69261997422583 & 0.592528234724743 \tabularnewline
Biweight & 8.70396752630695 & 0.581379743528299 \tabularnewline
Cosine & 8.70396752630695 & 0.58844948560548 \tabularnewline
Optcosine & 8.70396752630695 & 0.5676231331402 \tabularnewline
 \hline
\end{tabular}
%Source: https://freestatistics.org/blog/index.php?pk=170413&T=4
[TABLE]
[ROW][C]Maximum Density Values[/C][/ROW]
[ROW][C]Kernel[/C][C]x-value[/C][C]max. density[/C][/ROW]
[ROW][C]Gaussian[/C][C]8.70396752630695[/C][C]0.625720544327268[/C][/ROW]
[ROW][C]Epanechnikov[/C][C]8.70396752630695[/C][C]0.561155836833257[/C][/ROW]
[ROW][C]Rectangular[/C][C]8.42027872427911[/C][C]0.507264438825676[/C][/ROW]
[ROW][C]Triangular[/C][C]8.69261997422583[/C][C]0.592528234724743[/C][/ROW]
[ROW][C]Biweight[/C][C]8.70396752630695[/C][C]0.581379743528299[/C][/ROW]
[ROW][C]Cosine[/C][C]8.70396752630695[/C][C]0.58844948560548[/C][/ROW]
[ROW][C]Optcosine[/C][C]8.70396752630695[/C][C]0.5676231331402[/C][/ROW]
 [/TABLE]
Source: https://freestatistics.org/blog/index.php?pk=170413&T=4
Globally Unique Identifier (entire table): ba.freestatistics.org/blog/index.php?pk=170413&T=4
As an alternative you can also use a QR Code:
The GUIDs for individual cells are displayed in the table below:
| Maximum Density Values | | Kernel | x-value | max. density | | Gaussian | 8.70396752630695 | 0.625720544327268 | | Epanechnikov | 8.70396752630695 | 0.561155836833257 | | Rectangular | 8.42027872427911 | 0.507264438825676 | | Triangular | 8.69261997422583 | 0.592528234724743 | | Biweight | 8.70396752630695 | 0.581379743528299 | | Cosine | 8.70396752630695 | 0.58844948560548 | | Optcosine | 8.70396752630695 | 0.5676231331402 |
If you paste this QR Code into your document, anyone with a smartphone or tablet will be able to scan it and view this table in a browser.
If you paste this QR Code into your document, anyone with a smartphone or tablet will be able to scan it and view this table in a browser.
If you paste this QR Code into your document, anyone with a smartphone or tablet will be able to scan it and view this table in a browser.
If you paste this QR Code into your document, anyone with a smartphone or tablet will be able to scan it and view this table in a browser.
If you paste this QR Code into your document, anyone with a smartphone or tablet will be able to scan it and view this table in a browser.
| Maximum Density Values | | Kernel | x-value | max. density | | Gaussian | 8.70396752630695 | 0.625720544327268 | | Epanechnikov | 8.70396752630695 | 0.561155836833257 | | Rectangular | 8.43162627636023 | 0.507264438825676 | | Triangular | 8.69261997422583 | 0.592528234724743 | | Biweight | 8.70396752630695 | 0.581379743528299 | | Cosine | 8.70396752630695 | 0.58844948560548 | | Optcosine | 8.70396752630695 | 0.5676231331402 |
\begin{tabular}{lllllllll}
\hline
Maximum Density Values \tabularnewline
Kernel & x-value & max. density \tabularnewline
Gaussian & 8.70396752630695 & 0.625720544327268 \tabularnewline
Epanechnikov & 8.70396752630695 & 0.561155836833257 \tabularnewline
Rectangular & 8.43162627636023 & 0.507264438825676 \tabularnewline
Triangular & 8.69261997422583 & 0.592528234724743 \tabularnewline
Biweight & 8.70396752630695 & 0.581379743528299 \tabularnewline
Cosine & 8.70396752630695 & 0.58844948560548 \tabularnewline
Optcosine & 8.70396752630695 & 0.5676231331402 \tabularnewline
 \hline
\end{tabular}
%Source: https://freestatistics.org/blog/index.php?pk=170413&T=5
[TABLE]
[ROW][C]Maximum Density Values[/C][/ROW]
[ROW][C]Kernel[/C][C]x-value[/C][C]max. density[/C][/ROW]
[ROW][C]Gaussian[/C][C]8.70396752630695[/C][C]0.625720544327268[/C][/ROW]
[ROW][C]Epanechnikov[/C][C]8.70396752630695[/C][C]0.561155836833257[/C][/ROW]
[ROW][C]Rectangular[/C][C]8.43162627636023[/C][C]0.507264438825676[/C][/ROW]
[ROW][C]Triangular[/C][C]8.69261997422583[/C][C]0.592528234724743[/C][/ROW]
[ROW][C]Biweight[/C][C]8.70396752630695[/C][C]0.581379743528299[/C][/ROW]
[ROW][C]Cosine[/C][C]8.70396752630695[/C][C]0.58844948560548[/C][/ROW]
[ROW][C]Optcosine[/C][C]8.70396752630695[/C][C]0.5676231331402[/C][/ROW]
 [/TABLE]
Source: https://freestatistics.org/blog/index.php?pk=170413&T=5
Globally Unique Identifier (entire table): ba.freestatistics.org/blog/index.php?pk=170413&T=5
As an alternative you can also use a QR Code:
The GUIDs for individual cells are displayed in the table below:
| Maximum Density Values | | Kernel | x-value | max. density | | Gaussian | 8.70396752630695 | 0.625720544327268 | | Epanechnikov | 8.70396752630695 | 0.561155836833257 | | Rectangular | 8.43162627636023 | 0.507264438825676 | | Triangular | 8.69261997422583 | 0.592528234724743 | | Biweight | 8.70396752630695 | 0.581379743528299 | | Cosine | 8.70396752630695 | 0.58844948560548 | | Optcosine | 8.70396752630695 | 0.5676231331402 |
If you paste this QR Code into your document, anyone with a smartphone or tablet will be able to scan it and view this table in a browser.
If you paste this QR Code into your document, anyone with a smartphone or tablet will be able to scan it and view this table in a browser.
If you paste this QR Code into your document, anyone with a smartphone or tablet will be able to scan it and view this table in a browser.
If you paste this QR Code into your document, anyone with a smartphone or tablet will be able to scan it and view this table in a browser.
If you paste this QR Code into your document, anyone with a smartphone or tablet will be able to scan it and view this table in a browser.
| Maximum Density Values | | Kernel | x-value | max. density | | Gaussian | 8.70396752630695 | 0.625720544327268 | | Epanechnikov | 8.70396752630695 | 0.561155836833257 | | Rectangular | 8.44297382844134 | 0.507264438825676 | | Triangular | 8.69261997422583 | 0.592528234724743 | | Biweight | 8.70396752630695 | 0.581379743528299 | | Cosine | 8.70396752630695 | 0.58844948560548 | | Optcosine | 8.70396752630695 | 0.5676231331402 |
\begin{tabular}{lllllllll}
\hline
Maximum Density Values \tabularnewline
Kernel & x-value & max. density \tabularnewline
Gaussian & 8.70396752630695 & 0.625720544327268 \tabularnewline
Epanechnikov & 8.70396752630695 & 0.561155836833257 \tabularnewline
Rectangular & 8.44297382844134 & 0.507264438825676 \tabularnewline
Triangular & 8.69261997422583 & 0.592528234724743 \tabularnewline
Biweight & 8.70396752630695 & 0.581379743528299 \tabularnewline
Cosine & 8.70396752630695 & 0.58844948560548 \tabularnewline
Optcosine & 8.70396752630695 & 0.5676231331402 \tabularnewline
 \hline
\end{tabular}
%Source: https://freestatistics.org/blog/index.php?pk=170413&T=6
[TABLE]
[ROW][C]Maximum Density Values[/C][/ROW]
[ROW][C]Kernel[/C][C]x-value[/C][C]max. density[/C][/ROW]
[ROW][C]Gaussian[/C][C]8.70396752630695[/C][C]0.625720544327268[/C][/ROW]
[ROW][C]Epanechnikov[/C][C]8.70396752630695[/C][C]0.561155836833257[/C][/ROW]
[ROW][C]Rectangular[/C][C]8.44297382844134[/C][C]0.507264438825676[/C][/ROW]
[ROW][C]Triangular[/C][C]8.69261997422583[/C][C]0.592528234724743[/C][/ROW]
[ROW][C]Biweight[/C][C]8.70396752630695[/C][C]0.581379743528299[/C][/ROW]
[ROW][C]Cosine[/C][C]8.70396752630695[/C][C]0.58844948560548[/C][/ROW]
[ROW][C]Optcosine[/C][C]8.70396752630695[/C][C]0.5676231331402[/C][/ROW]
 [/TABLE]
Source: https://freestatistics.org/blog/index.php?pk=170413&T=6
Globally Unique Identifier (entire table): ba.freestatistics.org/blog/index.php?pk=170413&T=6
As an alternative you can also use a QR Code:
The GUIDs for individual cells are displayed in the table below:
| Maximum Density Values | | Kernel | x-value | max. density | | Gaussian | 8.70396752630695 | 0.625720544327268 | | Epanechnikov | 8.70396752630695 | 0.561155836833257 | | Rectangular | 8.44297382844134 | 0.507264438825676 | | Triangular | 8.69261997422583 | 0.592528234724743 | | Biweight | 8.70396752630695 | 0.581379743528299 | | Cosine | 8.70396752630695 | 0.58844948560548 | | Optcosine | 8.70396752630695 | 0.5676231331402 |
If you paste this QR Code into your document, anyone with a smartphone or tablet will be able to scan it and view this table in a browser.
If you paste this QR Code into your document, anyone with a smartphone or tablet will be able to scan it and view this table in a browser.
If you paste this QR Code into your document, anyone with a smartphone or tablet will be able to scan it and view this table in a browser.
If you paste this QR Code into your document, anyone with a smartphone or tablet will be able to scan it and view this table in a browser.
If you paste this QR Code into your document, anyone with a smartphone or tablet will be able to scan it and view this table in a browser.
| Maximum Density Values | | Kernel | x-value | max. density | | Gaussian | 8.70396752630695 | 0.625720544327268 | | Epanechnikov | 8.70396752630695 | 0.561155836833257 | | Rectangular | 8.45432138052245 | 0.507264438825676 | | Triangular | 8.69261997422583 | 0.592528234724743 | | Biweight | 8.70396752630695 | 0.581379743528299 | | Cosine | 8.70396752630695 | 0.58844948560548 | | Optcosine | 8.70396752630695 | 0.5676231331402 |
\begin{tabular}{lllllllll}
\hline
Maximum Density Values \tabularnewline
Kernel & x-value & max. density \tabularnewline
Gaussian & 8.70396752630695 & 0.625720544327268 \tabularnewline
Epanechnikov & 8.70396752630695 & 0.561155836833257 \tabularnewline
Rectangular & 8.45432138052245 & 0.507264438825676 \tabularnewline
Triangular & 8.69261997422583 & 0.592528234724743 \tabularnewline
Biweight & 8.70396752630695 & 0.581379743528299 \tabularnewline
Cosine & 8.70396752630695 & 0.58844948560548 \tabularnewline
Optcosine & 8.70396752630695 & 0.5676231331402 \tabularnewline
 \hline
\end{tabular}
%Source: https://freestatistics.org/blog/index.php?pk=170413&T=7
[TABLE]
[ROW][C]Maximum Density Values[/C][/ROW]
[ROW][C]Kernel[/C][C]x-value[/C][C]max. density[/C][/ROW]
[ROW][C]Gaussian[/C][C]8.70396752630695[/C][C]0.625720544327268[/C][/ROW]
[ROW][C]Epanechnikov[/C][C]8.70396752630695[/C][C]0.561155836833257[/C][/ROW]
[ROW][C]Rectangular[/C][C]8.45432138052245[/C][C]0.507264438825676[/C][/ROW]
[ROW][C]Triangular[/C][C]8.69261997422583[/C][C]0.592528234724743[/C][/ROW]
[ROW][C]Biweight[/C][C]8.70396752630695[/C][C]0.581379743528299[/C][/ROW]
[ROW][C]Cosine[/C][C]8.70396752630695[/C][C]0.58844948560548[/C][/ROW]
[ROW][C]Optcosine[/C][C]8.70396752630695[/C][C]0.5676231331402[/C][/ROW]
 [/TABLE]
Source: https://freestatistics.org/blog/index.php?pk=170413&T=7
Globally Unique Identifier (entire table): ba.freestatistics.org/blog/index.php?pk=170413&T=7
As an alternative you can also use a QR Code:
The GUIDs for individual cells are displayed in the table below:
| Maximum Density Values | | Kernel | x-value | max. density | | Gaussian | 8.70396752630695 | 0.625720544327268 | | Epanechnikov | 8.70396752630695 | 0.561155836833257 | | Rectangular | 8.45432138052245 | 0.507264438825676 | | Triangular | 8.69261997422583 | 0.592528234724743 | | Biweight | 8.70396752630695 | 0.581379743528299 | | Cosine | 8.70396752630695 | 0.58844948560548 | | Optcosine | 8.70396752630695 | 0.5676231331402 |
If you paste this QR Code into your document, anyone with a smartphone or tablet will be able to scan it and view this table in a browser.
If you paste this QR Code into your document, anyone with a smartphone or tablet will be able to scan it and view this table in a browser.
If you paste this QR Code into your document, anyone with a smartphone or tablet will be able to scan it and view this table in a browser.
If you paste this QR Code into your document, anyone with a smartphone or tablet will be able to scan it and view this table in a browser.
If you paste this QR Code into your document, anyone with a smartphone or tablet will be able to scan it and view this table in a browser.
| Maximum Density Values | | Kernel | x-value | max. density | | Gaussian | 8.70396752630695 | 0.625720544327268 | | Epanechnikov | 8.70396752630695 | 0.561155836833257 | | Rectangular | 8.46566893260357 | 0.507264438825676 | | Triangular | 8.69261997422583 | 0.592528234724743 | | Biweight | 8.70396752630695 | 0.581379743528299 | | Cosine | 8.70396752630695 | 0.58844948560548 | | Optcosine | 8.70396752630695 | 0.5676231331402 |
\begin{tabular}{lllllllll}
\hline
Maximum Density Values \tabularnewline
Kernel & x-value & max. density \tabularnewline
Gaussian & 8.70396752630695 & 0.625720544327268 \tabularnewline
Epanechnikov & 8.70396752630695 & 0.561155836833257 \tabularnewline
Rectangular & 8.46566893260357 & 0.507264438825676 \tabularnewline
Triangular & 8.69261997422583 & 0.592528234724743 \tabularnewline
Biweight & 8.70396752630695 & 0.581379743528299 \tabularnewline
Cosine & 8.70396752630695 & 0.58844948560548 \tabularnewline
Optcosine & 8.70396752630695 & 0.5676231331402 \tabularnewline
 \hline
\end{tabular}
%Source: https://freestatistics.org/blog/index.php?pk=170413&T=8
[TABLE]
[ROW][C]Maximum Density Values[/C][/ROW]
[ROW][C]Kernel[/C][C]x-value[/C][C]max. density[/C][/ROW]
[ROW][C]Gaussian[/C][C]8.70396752630695[/C][C]0.625720544327268[/C][/ROW]
[ROW][C]Epanechnikov[/C][C]8.70396752630695[/C][C]0.561155836833257[/C][/ROW]
[ROW][C]Rectangular[/C][C]8.46566893260357[/C][C]0.507264438825676[/C][/ROW]
[ROW][C]Triangular[/C][C]8.69261997422583[/C][C]0.592528234724743[/C][/ROW]
[ROW][C]Biweight[/C][C]8.70396752630695[/C][C]0.581379743528299[/C][/ROW]
[ROW][C]Cosine[/C][C]8.70396752630695[/C][C]0.58844948560548[/C][/ROW]
[ROW][C]Optcosine[/C][C]8.70396752630695[/C][C]0.5676231331402[/C][/ROW]
 [/TABLE]
Source: https://freestatistics.org/blog/index.php?pk=170413&T=8
Globally Unique Identifier (entire table): ba.freestatistics.org/blog/index.php?pk=170413&T=8
As an alternative you can also use a QR Code:
The GUIDs for individual cells are displayed in the table below:
| Maximum Density Values | | Kernel | x-value | max. density | | Gaussian | 8.70396752630695 | 0.625720544327268 | | Epanechnikov | 8.70396752630695 | 0.561155836833257 | | Rectangular | 8.46566893260357 | 0.507264438825676 | | Triangular | 8.69261997422583 | 0.592528234724743 | | Biweight | 8.70396752630695 | 0.581379743528299 | | Cosine | 8.70396752630695 | 0.58844948560548 | | Optcosine | 8.70396752630695 | 0.5676231331402 |
If you paste this QR Code into your document, anyone with a smartphone or tablet will be able to scan it and view this table in a browser.
If you paste this QR Code into your document, anyone with a smartphone or tablet will be able to scan it and view this table in a browser.
If you paste this QR Code into your document, anyone with a smartphone or tablet will be able to scan it and view this table in a browser.
If you paste this QR Code into your document, anyone with a smartphone or tablet will be able to scan it and view this table in a browser.
If you paste this QR Code into your document, anyone with a smartphone or tablet will be able to scan it and view this table in a browser.
| Maximum Density Values | | Kernel | x-value | max. density | | Gaussian | 8.70396752630695 | 0.625720544327268 | | Epanechnikov | 8.70396752630695 | 0.561155836833257 | | Rectangular | 8.47701648468468 | 0.507264438825676 | | Triangular | 8.69261997422583 | 0.592528234724743 | | Biweight | 8.70396752630695 | 0.581379743528299 | | Cosine | 8.70396752630695 | 0.58844948560548 | | Optcosine | 8.70396752630695 | 0.5676231331402 |
\begin{tabular}{lllllllll}
\hline
Maximum Density Values \tabularnewline
Kernel & x-value & max. density \tabularnewline
Gaussian & 8.70396752630695 & 0.625720544327268 \tabularnewline
Epanechnikov & 8.70396752630695 & 0.561155836833257 \tabularnewline
Rectangular & 8.47701648468468 & 0.507264438825676 \tabularnewline
Triangular & 8.69261997422583 & 0.592528234724743 \tabularnewline
Biweight & 8.70396752630695 & 0.581379743528299 \tabularnewline
Cosine & 8.70396752630695 & 0.58844948560548 \tabularnewline
Optcosine & 8.70396752630695 & 0.5676231331402 \tabularnewline
 \hline
\end{tabular}
%Source: https://freestatistics.org/blog/index.php?pk=170413&T=9
[TABLE]
[ROW][C]Maximum Density Values[/C][/ROW]
[ROW][C]Kernel[/C][C]x-value[/C][C]max. density[/C][/ROW]
[ROW][C]Gaussian[/C][C]8.70396752630695[/C][C]0.625720544327268[/C][/ROW]
[ROW][C]Epanechnikov[/C][C]8.70396752630695[/C][C]0.561155836833257[/C][/ROW]
[ROW][C]Rectangular[/C][C]8.47701648468468[/C][C]0.507264438825676[/C][/ROW]
[ROW][C]Triangular[/C][C]8.69261997422583[/C][C]0.592528234724743[/C][/ROW]
[ROW][C]Biweight[/C][C]8.70396752630695[/C][C]0.581379743528299[/C][/ROW]
[ROW][C]Cosine[/C][C]8.70396752630695[/C][C]0.58844948560548[/C][/ROW]
[ROW][C]Optcosine[/C][C]8.70396752630695[/C][C]0.5676231331402[/C][/ROW]
 [/TABLE]
Source: https://freestatistics.org/blog/index.php?pk=170413&T=9
Globally Unique Identifier (entire table): ba.freestatistics.org/blog/index.php?pk=170413&T=9
As an alternative you can also use a QR Code:
The GUIDs for individual cells are displayed in the table below:
| Maximum Density Values | | Kernel | x-value | max. density | | Gaussian | 8.70396752630695 | 0.625720544327268 | | Epanechnikov | 8.70396752630695 | 0.561155836833257 | | Rectangular | 8.47701648468468 | 0.507264438825676 | | Triangular | 8.69261997422583 | 0.592528234724743 | | Biweight | 8.70396752630695 | 0.581379743528299 | | Cosine | 8.70396752630695 | 0.58844948560548 | | Optcosine | 8.70396752630695 | 0.5676231331402 |
If you paste this QR Code into your document, anyone with a smartphone or tablet will be able to scan it and view this table in a browser.
If you paste this QR Code into your document, anyone with a smartphone or tablet will be able to scan it and view this table in a browser.
If you paste this QR Code into your document, anyone with a smartphone or tablet will be able to scan it and view this table in a browser.
If you paste this QR Code into your document, anyone with a smartphone or tablet will be able to scan it and view this table in a browser.
If you paste this QR Code into your document, anyone with a smartphone or tablet will be able to scan it and view this table in a browser.
| Maximum Density Values | | Kernel | x-value | max. density | | Gaussian | 8.70396752630695 | 0.625720544327268 | | Epanechnikov | 8.70396752630695 | 0.561155836833257 | | Rectangular | 8.48836403676579 | 0.507264438825676 | | Triangular | 8.69261997422583 | 0.592528234724743 | | Biweight | 8.70396752630695 | 0.581379743528299 | | Cosine | 8.70396752630695 | 0.58844948560548 | | Optcosine | 8.70396752630695 | 0.5676231331402 |
\begin{tabular}{lllllllll}
\hline
Maximum Density Values \tabularnewline
Kernel & x-value & max. density \tabularnewline
Gaussian & 8.70396752630695 & 0.625720544327268 \tabularnewline
Epanechnikov & 8.70396752630695 & 0.561155836833257 \tabularnewline
Rectangular & 8.48836403676579 & 0.507264438825676 \tabularnewline
Triangular & 8.69261997422583 & 0.592528234724743 \tabularnewline
Biweight & 8.70396752630695 & 0.581379743528299 \tabularnewline
Cosine & 8.70396752630695 & 0.58844948560548 \tabularnewline
Optcosine & 8.70396752630695 & 0.5676231331402 \tabularnewline
 \hline
\end{tabular}
%Source: https://freestatistics.org/blog/index.php?pk=170413&T=10
[TABLE]
[ROW][C]Maximum Density Values[/C][/ROW]
[ROW][C]Kernel[/C][C]x-value[/C][C]max. density[/C][/ROW]
[ROW][C]Gaussian[/C][C]8.70396752630695[/C][C]0.625720544327268[/C][/ROW]
[ROW][C]Epanechnikov[/C][C]8.70396752630695[/C][C]0.561155836833257[/C][/ROW]
[ROW][C]Rectangular[/C][C]8.48836403676579[/C][C]0.507264438825676[/C][/ROW]
[ROW][C]Triangular[/C][C]8.69261997422583[/C][C]0.592528234724743[/C][/ROW]
[ROW][C]Biweight[/C][C]8.70396752630695[/C][C]0.581379743528299[/C][/ROW]
[ROW][C]Cosine[/C][C]8.70396752630695[/C][C]0.58844948560548[/C][/ROW]
[ROW][C]Optcosine[/C][C]8.70396752630695[/C][C]0.5676231331402[/C][/ROW]
 [/TABLE]
Source: https://freestatistics.org/blog/index.php?pk=170413&T=10
Globally Unique Identifier (entire table): ba.freestatistics.org/blog/index.php?pk=170413&T=10
As an alternative you can also use a QR Code:
The GUIDs for individual cells are displayed in the table below:
| Maximum Density Values | | Kernel | x-value | max. density | | Gaussian | 8.70396752630695 | 0.625720544327268 | | Epanechnikov | 8.70396752630695 | 0.561155836833257 | | Rectangular | 8.48836403676579 | 0.507264438825676 | | Triangular | 8.69261997422583 | 0.592528234724743 | | Biweight | 8.70396752630695 | 0.581379743528299 | | Cosine | 8.70396752630695 | 0.58844948560548 | | Optcosine | 8.70396752630695 | 0.5676231331402 |
If you paste this QR Code into your document, anyone with a smartphone or tablet will be able to scan it and view this table in a browser.
If you paste this QR Code into your document, anyone with a smartphone or tablet will be able to scan it and view this table in a browser.
If you paste this QR Code into your document, anyone with a smartphone or tablet will be able to scan it and view this table in a browser.
If you paste this QR Code into your document, anyone with a smartphone or tablet will be able to scan it and view this table in a browser.
If you paste this QR Code into your document, anyone with a smartphone or tablet will be able to scan it and view this table in a browser.
| Maximum Density Values | | Kernel | x-value | max. density | | Gaussian | 8.70396752630695 | 0.625720544327268 | | Epanechnikov | 8.70396752630695 | 0.561155836833257 | | Rectangular | 8.49971158884691 | 0.507264438825676 | | Triangular | 8.69261997422583 | 0.592528234724743 | | Biweight | 8.70396752630695 | 0.581379743528299 | | Cosine | 8.70396752630695 | 0.58844948560548 | | Optcosine | 8.70396752630695 | 0.5676231331402 |
\begin{tabular}{lllllllll}
\hline
Maximum Density Values \tabularnewline
Kernel & x-value & max. density \tabularnewline
Gaussian & 8.70396752630695 & 0.625720544327268 \tabularnewline
Epanechnikov & 8.70396752630695 & 0.561155836833257 \tabularnewline
Rectangular & 8.49971158884691 & 0.507264438825676 \tabularnewline
Triangular & 8.69261997422583 & 0.592528234724743 \tabularnewline
Biweight & 8.70396752630695 & 0.581379743528299 \tabularnewline
Cosine & 8.70396752630695 & 0.58844948560548 \tabularnewline
Optcosine & 8.70396752630695 & 0.5676231331402 \tabularnewline
 \hline
\end{tabular}
%Source: https://freestatistics.org/blog/index.php?pk=170413&T=11
[TABLE]
[ROW][C]Maximum Density Values[/C][/ROW]
[ROW][C]Kernel[/C][C]x-value[/C][C]max. density[/C][/ROW]
[ROW][C]Gaussian[/C][C]8.70396752630695[/C][C]0.625720544327268[/C][/ROW]
[ROW][C]Epanechnikov[/C][C]8.70396752630695[/C][C]0.561155836833257[/C][/ROW]
[ROW][C]Rectangular[/C][C]8.49971158884691[/C][C]0.507264438825676[/C][/ROW]
[ROW][C]Triangular[/C][C]8.69261997422583[/C][C]0.592528234724743[/C][/ROW]
[ROW][C]Biweight[/C][C]8.70396752630695[/C][C]0.581379743528299[/C][/ROW]
[ROW][C]Cosine[/C][C]8.70396752630695[/C][C]0.58844948560548[/C][/ROW]
[ROW][C]Optcosine[/C][C]8.70396752630695[/C][C]0.5676231331402[/C][/ROW]
 [/TABLE]
Source: https://freestatistics.org/blog/index.php?pk=170413&T=11
Globally Unique Identifier (entire table): ba.freestatistics.org/blog/index.php?pk=170413&T=11
As an alternative you can also use a QR Code:
The GUIDs for individual cells are displayed in the table below:
| Maximum Density Values | | Kernel | x-value | max. density | | Gaussian | 8.70396752630695 | 0.625720544327268 | | Epanechnikov | 8.70396752630695 | 0.561155836833257 | | Rectangular | 8.49971158884691 | 0.507264438825676 | | Triangular | 8.69261997422583 | 0.592528234724743 | | Biweight | 8.70396752630695 | 0.581379743528299 | | Cosine | 8.70396752630695 | 0.58844948560548 | | Optcosine | 8.70396752630695 | 0.5676231331402 |
If you paste this QR Code into your document, anyone with a smartphone or tablet will be able to scan it and view this table in a browser.
If you paste this QR Code into your document, anyone with a smartphone or tablet will be able to scan it and view this table in a browser.
If you paste this QR Code into your document, anyone with a smartphone or tablet will be able to scan it and view this table in a browser.
If you paste this QR Code into your document, anyone with a smartphone or tablet will be able to scan it and view this table in a browser.
If you paste this QR Code into your document, anyone with a smartphone or tablet will be able to scan it and view this table in a browser.
| Maximum Density Values | | Kernel | x-value | max. density | | Gaussian | 8.70396752630695 | 0.625720544327268 | | Epanechnikov | 8.70396752630695 | 0.561155836833257 | | Rectangular | 8.51105914092802 | 0.507264438825676 | | Triangular | 8.69261997422583 | 0.592528234724743 | | Biweight | 8.70396752630695 | 0.581379743528299 | | Cosine | 8.70396752630695 | 0.58844948560548 | | Optcosine | 8.70396752630695 | 0.5676231331402 |
\begin{tabular}{lllllllll}
\hline
Maximum Density Values \tabularnewline
Kernel & x-value & max. density \tabularnewline
Gaussian & 8.70396752630695 & 0.625720544327268 \tabularnewline
Epanechnikov & 8.70396752630695 & 0.561155836833257 \tabularnewline
Rectangular & 8.51105914092802 & 0.507264438825676 \tabularnewline
Triangular & 8.69261997422583 & 0.592528234724743 \tabularnewline
Biweight & 8.70396752630695 & 0.581379743528299 \tabularnewline
Cosine & 8.70396752630695 & 0.58844948560548 \tabularnewline
Optcosine & 8.70396752630695 & 0.5676231331402 \tabularnewline
 \hline
\end{tabular}
%Source: https://freestatistics.org/blog/index.php?pk=170413&T=12
[TABLE]
[ROW][C]Maximum Density Values[/C][/ROW]
[ROW][C]Kernel[/C][C]x-value[/C][C]max. density[/C][/ROW]
[ROW][C]Gaussian[/C][C]8.70396752630695[/C][C]0.625720544327268[/C][/ROW]
[ROW][C]Epanechnikov[/C][C]8.70396752630695[/C][C]0.561155836833257[/C][/ROW]
[ROW][C]Rectangular[/C][C]8.51105914092802[/C][C]0.507264438825676[/C][/ROW]
[ROW][C]Triangular[/C][C]8.69261997422583[/C][C]0.592528234724743[/C][/ROW]
[ROW][C]Biweight[/C][C]8.70396752630695[/C][C]0.581379743528299[/C][/ROW]
[ROW][C]Cosine[/C][C]8.70396752630695[/C][C]0.58844948560548[/C][/ROW]
[ROW][C]Optcosine[/C][C]8.70396752630695[/C][C]0.5676231331402[/C][/ROW]
 [/TABLE]
Source: https://freestatistics.org/blog/index.php?pk=170413&T=12
Globally Unique Identifier (entire table): ba.freestatistics.org/blog/index.php?pk=170413&T=12
As an alternative you can also use a QR Code:
The GUIDs for individual cells are displayed in the table below:
| Maximum Density Values | | Kernel | x-value | max. density | | Gaussian | 8.70396752630695 | 0.625720544327268 | | Epanechnikov | 8.70396752630695 | 0.561155836833257 | | Rectangular | 8.51105914092802 | 0.507264438825676 | | Triangular | 8.69261997422583 | 0.592528234724743 | | Biweight | 8.70396752630695 | 0.581379743528299 | | Cosine | 8.70396752630695 | 0.58844948560548 | | Optcosine | 8.70396752630695 | 0.5676231331402 |
If you paste this QR Code into your document, anyone with a smartphone or tablet will be able to scan it and view this table in a browser.
If you paste this QR Code into your document, anyone with a smartphone or tablet will be able to scan it and view this table in a browser.
If you paste this QR Code into your document, anyone with a smartphone or tablet will be able to scan it and view this table in a browser.
If you paste this QR Code into your document, anyone with a smartphone or tablet will be able to scan it and view this table in a browser.
If you paste this QR Code into your document, anyone with a smartphone or tablet will be able to scan it and view this table in a browser.
| Maximum Density Values | | Kernel | x-value | max. density | | Gaussian | 8.70396752630695 | 0.625720544327268 | | Epanechnikov | 8.70396752630695 | 0.561155836833257 | | Rectangular | 8.52240669300913 | 0.507264438825676 | | Triangular | 8.69261997422583 | 0.592528234724743 | | Biweight | 8.70396752630695 | 0.581379743528299 | | Cosine | 8.70396752630695 | 0.58844948560548 | | Optcosine | 8.70396752630695 | 0.5676231331402 |
\begin{tabular}{lllllllll}
\hline
Maximum Density Values \tabularnewline
Kernel & x-value & max. density \tabularnewline
Gaussian & 8.70396752630695 & 0.625720544327268 \tabularnewline
Epanechnikov & 8.70396752630695 & 0.561155836833257 \tabularnewline
Rectangular & 8.52240669300913 & 0.507264438825676 \tabularnewline
Triangular & 8.69261997422583 & 0.592528234724743 \tabularnewline
Biweight & 8.70396752630695 & 0.581379743528299 \tabularnewline
Cosine & 8.70396752630695 & 0.58844948560548 \tabularnewline
Optcosine & 8.70396752630695 & 0.5676231331402 \tabularnewline
 \hline
\end{tabular}
%Source: https://freestatistics.org/blog/index.php?pk=170413&T=13
[TABLE]
[ROW][C]Maximum Density Values[/C][/ROW]
[ROW][C]Kernel[/C][C]x-value[/C][C]max. density[/C][/ROW]
[ROW][C]Gaussian[/C][C]8.70396752630695[/C][C]0.625720544327268[/C][/ROW]
[ROW][C]Epanechnikov[/C][C]8.70396752630695[/C][C]0.561155836833257[/C][/ROW]
[ROW][C]Rectangular[/C][C]8.52240669300913[/C][C]0.507264438825676[/C][/ROW]
[ROW][C]Triangular[/C][C]8.69261997422583[/C][C]0.592528234724743[/C][/ROW]
[ROW][C]Biweight[/C][C]8.70396752630695[/C][C]0.581379743528299[/C][/ROW]
[ROW][C]Cosine[/C][C]8.70396752630695[/C][C]0.58844948560548[/C][/ROW]
[ROW][C]Optcosine[/C][C]8.70396752630695[/C][C]0.5676231331402[/C][/ROW]
 [/TABLE]
Source: https://freestatistics.org/blog/index.php?pk=170413&T=13
Globally Unique Identifier (entire table): ba.freestatistics.org/blog/index.php?pk=170413&T=13
As an alternative you can also use a QR Code:
The GUIDs for individual cells are displayed in the table below:
| Maximum Density Values | | Kernel | x-value | max. density | | Gaussian | 8.70396752630695 | 0.625720544327268 | | Epanechnikov | 8.70396752630695 | 0.561155836833257 | | Rectangular | 8.52240669300913 | 0.507264438825676 | | Triangular | 8.69261997422583 | 0.592528234724743 | | Biweight | 8.70396752630695 | 0.581379743528299 | | Cosine | 8.70396752630695 | 0.58844948560548 | | Optcosine | 8.70396752630695 | 0.5676231331402 |
If you paste this QR Code into your document, anyone with a smartphone or tablet will be able to scan it and view this table in a browser.
If you paste this QR Code into your document, anyone with a smartphone or tablet will be able to scan it and view this table in a browser.
If you paste this QR Code into your document, anyone with a smartphone or tablet will be able to scan it and view this table in a browser.
If you paste this QR Code into your document, anyone with a smartphone or tablet will be able to scan it and view this table in a browser.
If you paste this QR Code into your document, anyone with a smartphone or tablet will be able to scan it and view this table in a browser.
| Maximum Density Values | | Kernel | x-value | max. density | | Gaussian | 8.70396752630695 | 0.625720544327268 | | Epanechnikov | 8.70396752630695 | 0.561155836833257 | | Rectangular | 8.53375424509025 | 0.507264438825676 | | Triangular | 8.69261997422583 | 0.592528234724743 | | Biweight | 8.70396752630695 | 0.581379743528299 | | Cosine | 8.70396752630695 | 0.58844948560548 | | Optcosine | 8.70396752630695 | 0.5676231331402 |
\begin{tabular}{lllllllll}
\hline
Maximum Density Values \tabularnewline
Kernel & x-value & max. density \tabularnewline
Gaussian & 8.70396752630695 & 0.625720544327268 \tabularnewline
Epanechnikov & 8.70396752630695 & 0.561155836833257 \tabularnewline
Rectangular & 8.53375424509025 & 0.507264438825676 \tabularnewline
Triangular & 8.69261997422583 & 0.592528234724743 \tabularnewline
Biweight & 8.70396752630695 & 0.581379743528299 \tabularnewline
Cosine & 8.70396752630695 & 0.58844948560548 \tabularnewline
Optcosine & 8.70396752630695 & 0.5676231331402 \tabularnewline
 \hline
\end{tabular}
%Source: https://freestatistics.org/blog/index.php?pk=170413&T=14
[TABLE]
[ROW][C]Maximum Density Values[/C][/ROW]
[ROW][C]Kernel[/C][C]x-value[/C][C]max. density[/C][/ROW]
[ROW][C]Gaussian[/C][C]8.70396752630695[/C][C]0.625720544327268[/C][/ROW]
[ROW][C]Epanechnikov[/C][C]8.70396752630695[/C][C]0.561155836833257[/C][/ROW]
[ROW][C]Rectangular[/C][C]8.53375424509025[/C][C]0.507264438825676[/C][/ROW]
[ROW][C]Triangular[/C][C]8.69261997422583[/C][C]0.592528234724743[/C][/ROW]
[ROW][C]Biweight[/C][C]8.70396752630695[/C][C]0.581379743528299[/C][/ROW]
[ROW][C]Cosine[/C][C]8.70396752630695[/C][C]0.58844948560548[/C][/ROW]
[ROW][C]Optcosine[/C][C]8.70396752630695[/C][C]0.5676231331402[/C][/ROW]
 [/TABLE]
Source: https://freestatistics.org/blog/index.php?pk=170413&T=14
Globally Unique Identifier (entire table): ba.freestatistics.org/blog/index.php?pk=170413&T=14
As an alternative you can also use a QR Code:
The GUIDs for individual cells are displayed in the table below:
| Maximum Density Values | | Kernel | x-value | max. density | | Gaussian | 8.70396752630695 | 0.625720544327268 | | Epanechnikov | 8.70396752630695 | 0.561155836833257 | | Rectangular | 8.53375424509025 | 0.507264438825676 | | Triangular | 8.69261997422583 | 0.592528234724743 | | Biweight | 8.70396752630695 | 0.581379743528299 | | Cosine | 8.70396752630695 | 0.58844948560548 | | Optcosine | 8.70396752630695 | 0.5676231331402 |
If you paste this QR Code into your document, anyone with a smartphone or tablet will be able to scan it and view this table in a browser.
If you paste this QR Code into your document, anyone with a smartphone or tablet will be able to scan it and view this table in a browser.
If you paste this QR Code into your document, anyone with a smartphone or tablet will be able to scan it and view this table in a browser.
If you paste this QR Code into your document, anyone with a smartphone or tablet will be able to scan it and view this table in a browser.
If you paste this QR Code into your document, anyone with a smartphone or tablet will be able to scan it and view this table in a browser.
| Maximum Density Values | | Kernel | x-value | max. density | | Gaussian | 8.70396752630695 | 0.625720544327268 | | Epanechnikov | 8.70396752630695 | 0.561155836833257 | | Rectangular | 8.54510179717136 | 0.507264438825676 | | Triangular | 8.69261997422583 | 0.592528234724743 | | Biweight | 8.70396752630695 | 0.581379743528299 | | Cosine | 8.70396752630695 | 0.58844948560548 | | Optcosine | 8.70396752630695 | 0.5676231331402 |
\begin{tabular}{lllllllll}
\hline
Maximum Density Values \tabularnewline
Kernel & x-value & max. density \tabularnewline
Gaussian & 8.70396752630695 & 0.625720544327268 \tabularnewline
Epanechnikov & 8.70396752630695 & 0.561155836833257 \tabularnewline
Rectangular & 8.54510179717136 & 0.507264438825676 \tabularnewline
Triangular & 8.69261997422583 & 0.592528234724743 \tabularnewline
Biweight & 8.70396752630695 & 0.581379743528299 \tabularnewline
Cosine & 8.70396752630695 & 0.58844948560548 \tabularnewline
Optcosine & 8.70396752630695 & 0.5676231331402 \tabularnewline
 \hline
\end{tabular}
%Source: https://freestatistics.org/blog/index.php?pk=170413&T=15
[TABLE]
[ROW][C]Maximum Density Values[/C][/ROW]
[ROW][C]Kernel[/C][C]x-value[/C][C]max. density[/C][/ROW]
[ROW][C]Gaussian[/C][C]8.70396752630695[/C][C]0.625720544327268[/C][/ROW]
[ROW][C]Epanechnikov[/C][C]8.70396752630695[/C][C]0.561155836833257[/C][/ROW]
[ROW][C]Rectangular[/C][C]8.54510179717136[/C][C]0.507264438825676[/C][/ROW]
[ROW][C]Triangular[/C][C]8.69261997422583[/C][C]0.592528234724743[/C][/ROW]
[ROW][C]Biweight[/C][C]8.70396752630695[/C][C]0.581379743528299[/C][/ROW]
[ROW][C]Cosine[/C][C]8.70396752630695[/C][C]0.58844948560548[/C][/ROW]
[ROW][C]Optcosine[/C][C]8.70396752630695[/C][C]0.5676231331402[/C][/ROW]
 [/TABLE]
Source: https://freestatistics.org/blog/index.php?pk=170413&T=15
Globally Unique Identifier (entire table): ba.freestatistics.org/blog/index.php?pk=170413&T=15
As an alternative you can also use a QR Code:
The GUIDs for individual cells are displayed in the table below:
| Maximum Density Values | | Kernel | x-value | max. density | | Gaussian | 8.70396752630695 | 0.625720544327268 | | Epanechnikov | 8.70396752630695 | 0.561155836833257 | | Rectangular | 8.54510179717136 | 0.507264438825676 | | Triangular | 8.69261997422583 | 0.592528234724743 | | Biweight | 8.70396752630695 | 0.581379743528299 | | Cosine | 8.70396752630695 | 0.58844948560548 | | Optcosine | 8.70396752630695 | 0.5676231331402 |
If you paste this QR Code into your document, anyone with a smartphone or tablet will be able to scan it and view this table in a browser.
If you paste this QR Code into your document, anyone with a smartphone or tablet will be able to scan it and view this table in a browser.
If you paste this QR Code into your document, anyone with a smartphone or tablet will be able to scan it and view this table in a browser.
If you paste this QR Code into your document, anyone with a smartphone or tablet will be able to scan it and view this table in a browser.
If you paste this QR Code into your document, anyone with a smartphone or tablet will be able to scan it and view this table in a browser.
| Maximum Density Values | | Kernel | x-value | max. density | | Gaussian | 8.70396752630695 | 0.625720544327268 | | Epanechnikov | 8.70396752630695 | 0.561155836833257 | | Rectangular | 8.55644934925247 | 0.507264438825676 | | Triangular | 8.69261997422583 | 0.592528234724743 | | Biweight | 8.70396752630695 | 0.581379743528299 | | Cosine | 8.70396752630695 | 0.58844948560548 | | Optcosine | 8.70396752630695 | 0.5676231331402 |
\begin{tabular}{lllllllll}
\hline
Maximum Density Values \tabularnewline
Kernel & x-value & max. density \tabularnewline
Gaussian & 8.70396752630695 & 0.625720544327268 \tabularnewline
Epanechnikov & 8.70396752630695 & 0.561155836833257 \tabularnewline
Rectangular & 8.55644934925247 & 0.507264438825676 \tabularnewline
Triangular & 8.69261997422583 & 0.592528234724743 \tabularnewline
Biweight & 8.70396752630695 & 0.581379743528299 \tabularnewline
Cosine & 8.70396752630695 & 0.58844948560548 \tabularnewline
Optcosine & 8.70396752630695 & 0.5676231331402 \tabularnewline
 \hline
\end{tabular}
%Source: https://freestatistics.org/blog/index.php?pk=170413&T=16
[TABLE]
[ROW][C]Maximum Density Values[/C][/ROW]
[ROW][C]Kernel[/C][C]x-value[/C][C]max. density[/C][/ROW]
[ROW][C]Gaussian[/C][C]8.70396752630695[/C][C]0.625720544327268[/C][/ROW]
[ROW][C]Epanechnikov[/C][C]8.70396752630695[/C][C]0.561155836833257[/C][/ROW]
[ROW][C]Rectangular[/C][C]8.55644934925247[/C][C]0.507264438825676[/C][/ROW]
[ROW][C]Triangular[/C][C]8.69261997422583[/C][C]0.592528234724743[/C][/ROW]
[ROW][C]Biweight[/C][C]8.70396752630695[/C][C]0.581379743528299[/C][/ROW]
[ROW][C]Cosine[/C][C]8.70396752630695[/C][C]0.58844948560548[/C][/ROW]
[ROW][C]Optcosine[/C][C]8.70396752630695[/C][C]0.5676231331402[/C][/ROW]
 [/TABLE]
Source: https://freestatistics.org/blog/index.php?pk=170413&T=16
Globally Unique Identifier (entire table): ba.freestatistics.org/blog/index.php?pk=170413&T=16
As an alternative you can also use a QR Code:
The GUIDs for individual cells are displayed in the table below:
| Maximum Density Values | | Kernel | x-value | max. density | | Gaussian | 8.70396752630695 | 0.625720544327268 | | Epanechnikov | 8.70396752630695 | 0.561155836833257 | | Rectangular | 8.55644934925247 | 0.507264438825676 | | Triangular | 8.69261997422583 | 0.592528234724743 | | Biweight | 8.70396752630695 | 0.581379743528299 | | Cosine | 8.70396752630695 | 0.58844948560548 | | Optcosine | 8.70396752630695 | 0.5676231331402 |
If you paste this QR Code into your document, anyone with a smartphone or tablet will be able to scan it and view this table in a browser.
If you paste this QR Code into your document, anyone with a smartphone or tablet will be able to scan it and view this table in a browser.
If you paste this QR Code into your document, anyone with a smartphone or tablet will be able to scan it and view this table in a browser.
If you paste this QR Code into your document, anyone with a smartphone or tablet will be able to scan it and view this table in a browser.
If you paste this QR Code into your document, anyone with a smartphone or tablet will be able to scan it and view this table in a browser.
| Maximum Density Values | | Kernel | x-value | max. density | | Gaussian | 8.70396752630695 | 0.625720544327268 | | Epanechnikov | 8.70396752630695 | 0.561155836833257 | | Rectangular | 8.56779690133359 | 0.507264438825676 | | Triangular | 8.69261997422583 | 0.592528234724743 | | Biweight | 8.70396752630695 | 0.581379743528299 | | Cosine | 8.70396752630695 | 0.58844948560548 | | Optcosine | 8.70396752630695 | 0.5676231331402 |
\begin{tabular}{lllllllll}
\hline
Maximum Density Values \tabularnewline
Kernel & x-value & max. density \tabularnewline
Gaussian & 8.70396752630695 & 0.625720544327268 \tabularnewline
Epanechnikov & 8.70396752630695 & 0.561155836833257 \tabularnewline
Rectangular & 8.56779690133359 & 0.507264438825676 \tabularnewline
Triangular & 8.69261997422583 & 0.592528234724743 \tabularnewline
Biweight & 8.70396752630695 & 0.581379743528299 \tabularnewline
Cosine & 8.70396752630695 & 0.58844948560548 \tabularnewline
Optcosine & 8.70396752630695 & 0.5676231331402 \tabularnewline
 \hline
\end{tabular}
%Source: https://freestatistics.org/blog/index.php?pk=170413&T=17
[TABLE]
[ROW][C]Maximum Density Values[/C][/ROW]
[ROW][C]Kernel[/C][C]x-value[/C][C]max. density[/C][/ROW]
[ROW][C]Gaussian[/C][C]8.70396752630695[/C][C]0.625720544327268[/C][/ROW]
[ROW][C]Epanechnikov[/C][C]8.70396752630695[/C][C]0.561155836833257[/C][/ROW]
[ROW][C]Rectangular[/C][C]8.56779690133359[/C][C]0.507264438825676[/C][/ROW]
[ROW][C]Triangular[/C][C]8.69261997422583[/C][C]0.592528234724743[/C][/ROW]
[ROW][C]Biweight[/C][C]8.70396752630695[/C][C]0.581379743528299[/C][/ROW]
[ROW][C]Cosine[/C][C]8.70396752630695[/C][C]0.58844948560548[/C][/ROW]
[ROW][C]Optcosine[/C][C]8.70396752630695[/C][C]0.5676231331402[/C][/ROW]
 [/TABLE]
Source: https://freestatistics.org/blog/index.php?pk=170413&T=17
Globally Unique Identifier (entire table): ba.freestatistics.org/blog/index.php?pk=170413&T=17
As an alternative you can also use a QR Code:
The GUIDs for individual cells are displayed in the table below:
| Maximum Density Values | | Kernel | x-value | max. density | | Gaussian | 8.70396752630695 | 0.625720544327268 | | Epanechnikov | 8.70396752630695 | 0.561155836833257 | | Rectangular | 8.56779690133359 | 0.507264438825676 | | Triangular | 8.69261997422583 | 0.592528234724743 | | Biweight | 8.70396752630695 | 0.581379743528299 | | Cosine | 8.70396752630695 | 0.58844948560548 | | Optcosine | 8.70396752630695 | 0.5676231331402 |
If you paste this QR Code into your document, anyone with a smartphone or tablet will be able to scan it and view this table in a browser.
If you paste this QR Code into your document, anyone with a smartphone or tablet will be able to scan it and view this table in a browser.
If you paste this QR Code into your document, anyone with a smartphone or tablet will be able to scan it and view this table in a browser.
If you paste this QR Code into your document, anyone with a smartphone or tablet will be able to scan it and view this table in a browser.
If you paste this QR Code into your document, anyone with a smartphone or tablet will be able to scan it and view this table in a browser.
| Maximum Density Values | | Kernel | x-value | max. density | | Gaussian | 8.70396752630695 | 0.625720544327268 | | Epanechnikov | 8.70396752630695 | 0.561155836833257 | | Rectangular | 8.5791444534147 | 0.507264438825676 | | Triangular | 8.69261997422583 | 0.592528234724743 | | Biweight | 8.70396752630695 | 0.581379743528299 | | Cosine | 8.70396752630695 | 0.58844948560548 | | Optcosine | 8.70396752630695 | 0.5676231331402 |
\begin{tabular}{lllllllll}
\hline
Maximum Density Values \tabularnewline
Kernel & x-value & max. density \tabularnewline
Gaussian & 8.70396752630695 & 0.625720544327268 \tabularnewline
Epanechnikov & 8.70396752630695 & 0.561155836833257 \tabularnewline
Rectangular & 8.5791444534147 & 0.507264438825676 \tabularnewline
Triangular & 8.69261997422583 & 0.592528234724743 \tabularnewline
Biweight & 8.70396752630695 & 0.581379743528299 \tabularnewline
Cosine & 8.70396752630695 & 0.58844948560548 \tabularnewline
Optcosine & 8.70396752630695 & 0.5676231331402 \tabularnewline
 \hline
\end{tabular}
%Source: https://freestatistics.org/blog/index.php?pk=170413&T=18
[TABLE]
[ROW][C]Maximum Density Values[/C][/ROW]
[ROW][C]Kernel[/C][C]x-value[/C][C]max. density[/C][/ROW]
[ROW][C]Gaussian[/C][C]8.70396752630695[/C][C]0.625720544327268[/C][/ROW]
[ROW][C]Epanechnikov[/C][C]8.70396752630695[/C][C]0.561155836833257[/C][/ROW]
[ROW][C]Rectangular[/C][C]8.5791444534147[/C][C]0.507264438825676[/C][/ROW]
[ROW][C]Triangular[/C][C]8.69261997422583[/C][C]0.592528234724743[/C][/ROW]
[ROW][C]Biweight[/C][C]8.70396752630695[/C][C]0.581379743528299[/C][/ROW]
[ROW][C]Cosine[/C][C]8.70396752630695[/C][C]0.58844948560548[/C][/ROW]
[ROW][C]Optcosine[/C][C]8.70396752630695[/C][C]0.5676231331402[/C][/ROW]
 [/TABLE]
Source: https://freestatistics.org/blog/index.php?pk=170413&T=18
Globally Unique Identifier (entire table): ba.freestatistics.org/blog/index.php?pk=170413&T=18
As an alternative you can also use a QR Code:
The GUIDs for individual cells are displayed in the table below:
| Maximum Density Values | | Kernel | x-value | max. density | | Gaussian | 8.70396752630695 | 0.625720544327268 | | Epanechnikov | 8.70396752630695 | 0.561155836833257 | | Rectangular | 8.5791444534147 | 0.507264438825676 | | Triangular | 8.69261997422583 | 0.592528234724743 | | Biweight | 8.70396752630695 | 0.581379743528299 | | Cosine | 8.70396752630695 | 0.58844948560548 | | Optcosine | 8.70396752630695 | 0.5676231331402 |
If you paste this QR Code into your document, anyone with a smartphone or tablet will be able to scan it and view this table in a browser.
If you paste this QR Code into your document, anyone with a smartphone or tablet will be able to scan it and view this table in a browser.
If you paste this QR Code into your document, anyone with a smartphone or tablet will be able to scan it and view this table in a browser.
If you paste this QR Code into your document, anyone with a smartphone or tablet will be able to scan it and view this table in a browser.
If you paste this QR Code into your document, anyone with a smartphone or tablet will be able to scan it and view this table in a browser.
| Maximum Density Values | | Kernel | x-value | max. density | | Gaussian | 8.70396752630695 | 0.625720544327268 | | Epanechnikov | 8.70396752630695 | 0.561155836833257 | | Rectangular | 8.59049200549581 | 0.507264438825676 | | Triangular | 8.69261997422583 | 0.592528234724743 | | Biweight | 8.70396752630695 | 0.581379743528299 | | Cosine | 8.70396752630695 | 0.58844948560548 | | Optcosine | 8.70396752630695 | 0.5676231331402 |
\begin{tabular}{lllllllll}
\hline
Maximum Density Values \tabularnewline
Kernel & x-value & max. density \tabularnewline
Gaussian & 8.70396752630695 & 0.625720544327268 \tabularnewline
Epanechnikov & 8.70396752630695 & 0.561155836833257 \tabularnewline
Rectangular & 8.59049200549581 & 0.507264438825676 \tabularnewline
Triangular & 8.69261997422583 & 0.592528234724743 \tabularnewline
Biweight & 8.70396752630695 & 0.581379743528299 \tabularnewline
Cosine & 8.70396752630695 & 0.58844948560548 \tabularnewline
Optcosine & 8.70396752630695 & 0.5676231331402 \tabularnewline
 \hline
\end{tabular}
%Source: https://freestatistics.org/blog/index.php?pk=170413&T=19
[TABLE]
[ROW][C]Maximum Density Values[/C][/ROW]
[ROW][C]Kernel[/C][C]x-value[/C][C]max. density[/C][/ROW]
[ROW][C]Gaussian[/C][C]8.70396752630695[/C][C]0.625720544327268[/C][/ROW]
[ROW][C]Epanechnikov[/C][C]8.70396752630695[/C][C]0.561155836833257[/C][/ROW]
[ROW][C]Rectangular[/C][C]8.59049200549581[/C][C]0.507264438825676[/C][/ROW]
[ROW][C]Triangular[/C][C]8.69261997422583[/C][C]0.592528234724743[/C][/ROW]
[ROW][C]Biweight[/C][C]8.70396752630695[/C][C]0.581379743528299[/C][/ROW]
[ROW][C]Cosine[/C][C]8.70396752630695[/C][C]0.58844948560548[/C][/ROW]
[ROW][C]Optcosine[/C][C]8.70396752630695[/C][C]0.5676231331402[/C][/ROW]
 [/TABLE]
Source: https://freestatistics.org/blog/index.php?pk=170413&T=19
Globally Unique Identifier (entire table): ba.freestatistics.org/blog/index.php?pk=170413&T=19
As an alternative you can also use a QR Code:
The GUIDs for individual cells are displayed in the table below:
| Maximum Density Values | | Kernel | x-value | max. density | | Gaussian | 8.70396752630695 | 0.625720544327268 | | Epanechnikov | 8.70396752630695 | 0.561155836833257 | | Rectangular | 8.59049200549581 | 0.507264438825676 | | Triangular | 8.69261997422583 | 0.592528234724743 | | Biweight | 8.70396752630695 | 0.581379743528299 | | Cosine | 8.70396752630695 | 0.58844948560548 | | Optcosine | 8.70396752630695 | 0.5676231331402 |
If you paste this QR Code into your document, anyone with a smartphone or tablet will be able to scan it and view this table in a browser.
If you paste this QR Code into your document, anyone with a smartphone or tablet will be able to scan it and view this table in a browser.
If you paste this QR Code into your document, anyone with a smartphone or tablet will be able to scan it and view this table in a browser.
If you paste this QR Code into your document, anyone with a smartphone or tablet will be able to scan it and view this table in a browser.
If you paste this QR Code into your document, anyone with a smartphone or tablet will be able to scan it and view this table in a browser.
| Maximum Density Values | | Kernel | x-value | max. density | | Gaussian | 8.70396752630695 | 0.625720544327268 | | Epanechnikov | 8.70396752630695 | 0.561155836833257 | | Rectangular | 8.60183955757693 | 0.507264438825676 | | Triangular | 8.69261997422583 | 0.592528234724743 | | Biweight | 8.70396752630695 | 0.581379743528299 | | Cosine | 8.70396752630695 | 0.58844948560548 | | Optcosine | 8.70396752630695 | 0.5676231331402 |
\begin{tabular}{lllllllll}
\hline
Maximum Density Values \tabularnewline
Kernel & x-value & max. density \tabularnewline
Gaussian & 8.70396752630695 & 0.625720544327268 \tabularnewline
Epanechnikov & 8.70396752630695 & 0.561155836833257 \tabularnewline
Rectangular & 8.60183955757693 & 0.507264438825676 \tabularnewline
Triangular & 8.69261997422583 & 0.592528234724743 \tabularnewline
Biweight & 8.70396752630695 & 0.581379743528299 \tabularnewline
Cosine & 8.70396752630695 & 0.58844948560548 \tabularnewline
Optcosine & 8.70396752630695 & 0.5676231331402 \tabularnewline
 \hline
\end{tabular}
%Source: https://freestatistics.org/blog/index.php?pk=170413&T=20
[TABLE]
[ROW][C]Maximum Density Values[/C][/ROW]
[ROW][C]Kernel[/C][C]x-value[/C][C]max. density[/C][/ROW]
[ROW][C]Gaussian[/C][C]8.70396752630695[/C][C]0.625720544327268[/C][/ROW]
[ROW][C]Epanechnikov[/C][C]8.70396752630695[/C][C]0.561155836833257[/C][/ROW]
[ROW][C]Rectangular[/C][C]8.60183955757693[/C][C]0.507264438825676[/C][/ROW]
[ROW][C]Triangular[/C][C]8.69261997422583[/C][C]0.592528234724743[/C][/ROW]
[ROW][C]Biweight[/C][C]8.70396752630695[/C][C]0.581379743528299[/C][/ROW]
[ROW][C]Cosine[/C][C]8.70396752630695[/C][C]0.58844948560548[/C][/ROW]
[ROW][C]Optcosine[/C][C]8.70396752630695[/C][C]0.5676231331402[/C][/ROW]
 [/TABLE]
Source: https://freestatistics.org/blog/index.php?pk=170413&T=20
Globally Unique Identifier (entire table): ba.freestatistics.org/blog/index.php?pk=170413&T=20
As an alternative you can also use a QR Code:
The GUIDs for individual cells are displayed in the table below:
| Maximum Density Values | | Kernel | x-value | max. density | | Gaussian | 8.70396752630695 | 0.625720544327268 | | Epanechnikov | 8.70396752630695 | 0.561155836833257 | | Rectangular | 8.60183955757693 | 0.507264438825676 | | Triangular | 8.69261997422583 | 0.592528234724743 | | Biweight | 8.70396752630695 | 0.581379743528299 | | Cosine | 8.70396752630695 | 0.58844948560548 | | Optcosine | 8.70396752630695 | 0.5676231331402 |
If you paste this QR Code into your document, anyone with a smartphone or tablet will be able to scan it and view this table in a browser.
If you paste this QR Code into your document, anyone with a smartphone or tablet will be able to scan it and view this table in a browser.
If you paste this QR Code into your document, anyone with a smartphone or tablet will be able to scan it and view this table in a browser.
If you paste this QR Code into your document, anyone with a smartphone or tablet will be able to scan it and view this table in a browser.
If you paste this QR Code into your document, anyone with a smartphone or tablet will be able to scan it and view this table in a browser.
| Maximum Density Values | | Kernel | x-value | max. density | | Gaussian | 8.70396752630695 | 0.625720544327268 | | Epanechnikov | 8.70396752630695 | 0.561155836833257 | | Rectangular | 8.61318710965804 | 0.507264438825676 | | Triangular | 8.69261997422583 | 0.592528234724743 | | Biweight | 8.70396752630695 | 0.581379743528299 | | Cosine | 8.70396752630695 | 0.58844948560548 | | Optcosine | 8.70396752630695 | 0.5676231331402 |
\begin{tabular}{lllllllll}
\hline
Maximum Density Values \tabularnewline
Kernel & x-value & max. density \tabularnewline
Gaussian & 8.70396752630695 & 0.625720544327268 \tabularnewline
Epanechnikov & 8.70396752630695 & 0.561155836833257 \tabularnewline
Rectangular & 8.61318710965804 & 0.507264438825676 \tabularnewline
Triangular & 8.69261997422583 & 0.592528234724743 \tabularnewline
Biweight & 8.70396752630695 & 0.581379743528299 \tabularnewline
Cosine & 8.70396752630695 & 0.58844948560548 \tabularnewline
Optcosine & 8.70396752630695 & 0.5676231331402 \tabularnewline
 \hline
\end{tabular}
%Source: https://freestatistics.org/blog/index.php?pk=170413&T=21
[TABLE]
[ROW][C]Maximum Density Values[/C][/ROW]
[ROW][C]Kernel[/C][C]x-value[/C][C]max. density[/C][/ROW]
[ROW][C]Gaussian[/C][C]8.70396752630695[/C][C]0.625720544327268[/C][/ROW]
[ROW][C]Epanechnikov[/C][C]8.70396752630695[/C][C]0.561155836833257[/C][/ROW]
[ROW][C]Rectangular[/C][C]8.61318710965804[/C][C]0.507264438825676[/C][/ROW]
[ROW][C]Triangular[/C][C]8.69261997422583[/C][C]0.592528234724743[/C][/ROW]
[ROW][C]Biweight[/C][C]8.70396752630695[/C][C]0.581379743528299[/C][/ROW]
[ROW][C]Cosine[/C][C]8.70396752630695[/C][C]0.58844948560548[/C][/ROW]
[ROW][C]Optcosine[/C][C]8.70396752630695[/C][C]0.5676231331402[/C][/ROW]
 [/TABLE]
Source: https://freestatistics.org/blog/index.php?pk=170413&T=21
Globally Unique Identifier (entire table): ba.freestatistics.org/blog/index.php?pk=170413&T=21
As an alternative you can also use a QR Code:
The GUIDs for individual cells are displayed in the table below:
| Maximum Density Values | | Kernel | x-value | max. density | | Gaussian | 8.70396752630695 | 0.625720544327268 | | Epanechnikov | 8.70396752630695 | 0.561155836833257 | | Rectangular | 8.61318710965804 | 0.507264438825676 | | Triangular | 8.69261997422583 | 0.592528234724743 | | Biweight | 8.70396752630695 | 0.581379743528299 | | Cosine | 8.70396752630695 | 0.58844948560548 | | Optcosine | 8.70396752630695 | 0.5676231331402 |
If you paste this QR Code into your document, anyone with a smartphone or tablet will be able to scan it and view this table in a browser.
If you paste this QR Code into your document, anyone with a smartphone or tablet will be able to scan it and view this table in a browser.
If you paste this QR Code into your document, anyone with a smartphone or tablet will be able to scan it and view this table in a browser.
If you paste this QR Code into your document, anyone with a smartphone or tablet will be able to scan it and view this table in a browser.
If you paste this QR Code into your document, anyone with a smartphone or tablet will be able to scan it and view this table in a browser.
| Maximum Density Values | | Kernel | x-value | max. density | | Gaussian | 8.70396752630695 | 0.625720544327268 | | Epanechnikov | 8.70396752630695 | 0.561155836833257 | | Rectangular | 8.62453466173915 | 0.507264438825676 | | Triangular | 8.69261997422583 | 0.592528234724743 | | Biweight | 8.70396752630695 | 0.581379743528299 | | Cosine | 8.70396752630695 | 0.58844948560548 | | Optcosine | 8.70396752630695 | 0.5676231331402 |
\begin{tabular}{lllllllll}
\hline
Maximum Density Values \tabularnewline
Kernel & x-value & max. density \tabularnewline
Gaussian & 8.70396752630695 & 0.625720544327268 \tabularnewline
Epanechnikov & 8.70396752630695 & 0.561155836833257 \tabularnewline
Rectangular & 8.62453466173915 & 0.507264438825676 \tabularnewline
Triangular & 8.69261997422583 & 0.592528234724743 \tabularnewline
Biweight & 8.70396752630695 & 0.581379743528299 \tabularnewline
Cosine & 8.70396752630695 & 0.58844948560548 \tabularnewline
Optcosine & 8.70396752630695 & 0.5676231331402 \tabularnewline
 \hline
\end{tabular}
%Source: https://freestatistics.org/blog/index.php?pk=170413&T=22
[TABLE]
[ROW][C]Maximum Density Values[/C][/ROW]
[ROW][C]Kernel[/C][C]x-value[/C][C]max. density[/C][/ROW]
[ROW][C]Gaussian[/C][C]8.70396752630695[/C][C]0.625720544327268[/C][/ROW]
[ROW][C]Epanechnikov[/C][C]8.70396752630695[/C][C]0.561155836833257[/C][/ROW]
[ROW][C]Rectangular[/C][C]8.62453466173915[/C][C]0.507264438825676[/C][/ROW]
[ROW][C]Triangular[/C][C]8.69261997422583[/C][C]0.592528234724743[/C][/ROW]
[ROW][C]Biweight[/C][C]8.70396752630695[/C][C]0.581379743528299[/C][/ROW]
[ROW][C]Cosine[/C][C]8.70396752630695[/C][C]0.58844948560548[/C][/ROW]
[ROW][C]Optcosine[/C][C]8.70396752630695[/C][C]0.5676231331402[/C][/ROW]
 [/TABLE]
Source: https://freestatistics.org/blog/index.php?pk=170413&T=22
Globally Unique Identifier (entire table): ba.freestatistics.org/blog/index.php?pk=170413&T=22
As an alternative you can also use a QR Code:
The GUIDs for individual cells are displayed in the table below:
| Maximum Density Values | | Kernel | x-value | max. density | | Gaussian | 8.70396752630695 | 0.625720544327268 | | Epanechnikov | 8.70396752630695 | 0.561155836833257 | | Rectangular | 8.62453466173915 | 0.507264438825676 | | Triangular | 8.69261997422583 | 0.592528234724743 | | Biweight | 8.70396752630695 | 0.581379743528299 | | Cosine | 8.70396752630695 | 0.58844948560548 | | Optcosine | 8.70396752630695 | 0.5676231331402 |
If you paste this QR Code into your document, anyone with a smartphone or tablet will be able to scan it and view this table in a browser.
If you paste this QR Code into your document, anyone with a smartphone or tablet will be able to scan it and view this table in a browser.
If you paste this QR Code into your document, anyone with a smartphone or tablet will be able to scan it and view this table in a browser.
If you paste this QR Code into your document, anyone with a smartphone or tablet will be able to scan it and view this table in a browser.
If you paste this QR Code into your document, anyone with a smartphone or tablet will be able to scan it and view this table in a browser.
| Maximum Density Values | | Kernel | x-value | max. density | | Gaussian | 8.70396752630695 | 0.625720544327268 | | Epanechnikov | 8.70396752630695 | 0.561155836833257 | | Rectangular | 8.63588221382027 | 0.507264438825676 | | Triangular | 8.69261997422583 | 0.592528234724743 | | Biweight | 8.70396752630695 | 0.581379743528299 | | Cosine | 8.70396752630695 | 0.58844948560548 | | Optcosine | 8.70396752630695 | 0.5676231331402 |
\begin{tabular}{lllllllll}
\hline
Maximum Density Values \tabularnewline
Kernel & x-value & max. density \tabularnewline
Gaussian & 8.70396752630695 & 0.625720544327268 \tabularnewline
Epanechnikov & 8.70396752630695 & 0.561155836833257 \tabularnewline
Rectangular & 8.63588221382027 & 0.507264438825676 \tabularnewline
Triangular & 8.69261997422583 & 0.592528234724743 \tabularnewline
Biweight & 8.70396752630695 & 0.581379743528299 \tabularnewline
Cosine & 8.70396752630695 & 0.58844948560548 \tabularnewline
Optcosine & 8.70396752630695 & 0.5676231331402 \tabularnewline
 \hline
\end{tabular}
%Source: https://freestatistics.org/blog/index.php?pk=170413&T=23
[TABLE]
[ROW][C]Maximum Density Values[/C][/ROW]
[ROW][C]Kernel[/C][C]x-value[/C][C]max. density[/C][/ROW]
[ROW][C]Gaussian[/C][C]8.70396752630695[/C][C]0.625720544327268[/C][/ROW]
[ROW][C]Epanechnikov[/C][C]8.70396752630695[/C][C]0.561155836833257[/C][/ROW]
[ROW][C]Rectangular[/C][C]8.63588221382027[/C][C]0.507264438825676[/C][/ROW]
[ROW][C]Triangular[/C][C]8.69261997422583[/C][C]0.592528234724743[/C][/ROW]
[ROW][C]Biweight[/C][C]8.70396752630695[/C][C]0.581379743528299[/C][/ROW]
[ROW][C]Cosine[/C][C]8.70396752630695[/C][C]0.58844948560548[/C][/ROW]
[ROW][C]Optcosine[/C][C]8.70396752630695[/C][C]0.5676231331402[/C][/ROW]
 [/TABLE]
Source: https://freestatistics.org/blog/index.php?pk=170413&T=23
Globally Unique Identifier (entire table): ba.freestatistics.org/blog/index.php?pk=170413&T=23
As an alternative you can also use a QR Code:
The GUIDs for individual cells are displayed in the table below:
| Maximum Density Values | | Kernel | x-value | max. density | | Gaussian | 8.70396752630695 | 0.625720544327268 | | Epanechnikov | 8.70396752630695 | 0.561155836833257 | | Rectangular | 8.63588221382027 | 0.507264438825676 | | Triangular | 8.69261997422583 | 0.592528234724743 | | Biweight | 8.70396752630695 | 0.581379743528299 | | Cosine | 8.70396752630695 | 0.58844948560548 | | Optcosine | 8.70396752630695 | 0.5676231331402 |
If you paste this QR Code into your document, anyone with a smartphone or tablet will be able to scan it and view this table in a browser.
If you paste this QR Code into your document, anyone with a smartphone or tablet will be able to scan it and view this table in a browser.
If you paste this QR Code into your document, anyone with a smartphone or tablet will be able to scan it and view this table in a browser.
If you paste this QR Code into your document, anyone with a smartphone or tablet will be able to scan it and view this table in a browser.
If you paste this QR Code into your document, anyone with a smartphone or tablet will be able to scan it and view this table in a browser.
| Maximum Density Values | | Kernel | x-value | max. density | | Gaussian | 8.70396752630695 | 0.625720544327268 | | Epanechnikov | 8.70396752630695 | 0.561155836833257 | | Rectangular | 8.64722976590138 | 0.507264438825676 | | Triangular | 8.69261997422583 | 0.592528234724743 | | Biweight | 8.70396752630695 | 0.581379743528299 | | Cosine | 8.70396752630695 | 0.58844948560548 | | Optcosine | 8.70396752630695 | 0.5676231331402 |
\begin{tabular}{lllllllll}
\hline
Maximum Density Values \tabularnewline
Kernel & x-value & max. density \tabularnewline
Gaussian & 8.70396752630695 & 0.625720544327268 \tabularnewline
Epanechnikov & 8.70396752630695 & 0.561155836833257 \tabularnewline
Rectangular & 8.64722976590138 & 0.507264438825676 \tabularnewline
Triangular & 8.69261997422583 & 0.592528234724743 \tabularnewline
Biweight & 8.70396752630695 & 0.581379743528299 \tabularnewline
Cosine & 8.70396752630695 & 0.58844948560548 \tabularnewline
Optcosine & 8.70396752630695 & 0.5676231331402 \tabularnewline
 \hline
\end{tabular}
%Source: https://freestatistics.org/blog/index.php?pk=170413&T=24
[TABLE]
[ROW][C]Maximum Density Values[/C][/ROW]
[ROW][C]Kernel[/C][C]x-value[/C][C]max. density[/C][/ROW]
[ROW][C]Gaussian[/C][C]8.70396752630695[/C][C]0.625720544327268[/C][/ROW]
[ROW][C]Epanechnikov[/C][C]8.70396752630695[/C][C]0.561155836833257[/C][/ROW]
[ROW][C]Rectangular[/C][C]8.64722976590138[/C][C]0.507264438825676[/C][/ROW]
[ROW][C]Triangular[/C][C]8.69261997422583[/C][C]0.592528234724743[/C][/ROW]
[ROW][C]Biweight[/C][C]8.70396752630695[/C][C]0.581379743528299[/C][/ROW]
[ROW][C]Cosine[/C][C]8.70396752630695[/C][C]0.58844948560548[/C][/ROW]
[ROW][C]Optcosine[/C][C]8.70396752630695[/C][C]0.5676231331402[/C][/ROW]
 [/TABLE]
Source: https://freestatistics.org/blog/index.php?pk=170413&T=24
Globally Unique Identifier (entire table): ba.freestatistics.org/blog/index.php?pk=170413&T=24
As an alternative you can also use a QR Code:
The GUIDs for individual cells are displayed in the table below:
| Maximum Density Values | | Kernel | x-value | max. density | | Gaussian | 8.70396752630695 | 0.625720544327268 | | Epanechnikov | 8.70396752630695 | 0.561155836833257 | | Rectangular | 8.64722976590138 | 0.507264438825676 | | Triangular | 8.69261997422583 | 0.592528234724743 | | Biweight | 8.70396752630695 | 0.581379743528299 | | Cosine | 8.70396752630695 | 0.58844948560548 | | Optcosine | 8.70396752630695 | 0.5676231331402 |
If you paste this QR Code into your document, anyone with a smartphone or tablet will be able to scan it and view this table in a browser.
If you paste this QR Code into your document, anyone with a smartphone or tablet will be able to scan it and view this table in a browser.
If you paste this QR Code into your document, anyone with a smartphone or tablet will be able to scan it and view this table in a browser.
If you paste this QR Code into your document, anyone with a smartphone or tablet will be able to scan it and view this table in a browser.
If you paste this QR Code into your document, anyone with a smartphone or tablet will be able to scan it and view this table in a browser.
| Maximum Density Values | | Kernel | x-value | max. density | | Gaussian | 8.70396752630695 | 0.625720544327268 | | Epanechnikov | 8.70396752630695 | 0.561155836833257 | | Rectangular | 8.65857731798249 | 0.507264438825676 | | Triangular | 8.69261997422583 | 0.592528234724743 | | Biweight | 8.70396752630695 | 0.581379743528299 | | Cosine | 8.70396752630695 | 0.58844948560548 | | Optcosine | 8.70396752630695 | 0.5676231331402 |
\begin{tabular}{lllllllll}
\hline
Maximum Density Values \tabularnewline
Kernel & x-value & max. density \tabularnewline
Gaussian & 8.70396752630695 & 0.625720544327268 \tabularnewline
Epanechnikov & 8.70396752630695 & 0.561155836833257 \tabularnewline
Rectangular & 8.65857731798249 & 0.507264438825676 \tabularnewline
Triangular & 8.69261997422583 & 0.592528234724743 \tabularnewline
Biweight & 8.70396752630695 & 0.581379743528299 \tabularnewline
Cosine & 8.70396752630695 & 0.58844948560548 \tabularnewline
Optcosine & 8.70396752630695 & 0.5676231331402 \tabularnewline
 \hline
\end{tabular}
%Source: https://freestatistics.org/blog/index.php?pk=170413&T=25
[TABLE]
[ROW][C]Maximum Density Values[/C][/ROW]
[ROW][C]Kernel[/C][C]x-value[/C][C]max. density[/C][/ROW]
[ROW][C]Gaussian[/C][C]8.70396752630695[/C][C]0.625720544327268[/C][/ROW]
[ROW][C]Epanechnikov[/C][C]8.70396752630695[/C][C]0.561155836833257[/C][/ROW]
[ROW][C]Rectangular[/C][C]8.65857731798249[/C][C]0.507264438825676[/C][/ROW]
[ROW][C]Triangular[/C][C]8.69261997422583[/C][C]0.592528234724743[/C][/ROW]
[ROW][C]Biweight[/C][C]8.70396752630695[/C][C]0.581379743528299[/C][/ROW]
[ROW][C]Cosine[/C][C]8.70396752630695[/C][C]0.58844948560548[/C][/ROW]
[ROW][C]Optcosine[/C][C]8.70396752630695[/C][C]0.5676231331402[/C][/ROW]
 [/TABLE]
Source: https://freestatistics.org/blog/index.php?pk=170413&T=25
Globally Unique Identifier (entire table): ba.freestatistics.org/blog/index.php?pk=170413&T=25
As an alternative you can also use a QR Code:
The GUIDs for individual cells are displayed in the table below:
| Maximum Density Values | | Kernel | x-value | max. density | | Gaussian | 8.70396752630695 | 0.625720544327268 | | Epanechnikov | 8.70396752630695 | 0.561155836833257 | | Rectangular | 8.65857731798249 | 0.507264438825676 | | Triangular | 8.69261997422583 | 0.592528234724743 | | Biweight | 8.70396752630695 | 0.581379743528299 | | Cosine | 8.70396752630695 | 0.58844948560548 | | Optcosine | 8.70396752630695 | 0.5676231331402 |
If you paste this QR Code into your document, anyone with a smartphone or tablet will be able to scan it and view this table in a browser.
If you paste this QR Code into your document, anyone with a smartphone or tablet will be able to scan it and view this table in a browser.
If you paste this QR Code into your document, anyone with a smartphone or tablet will be able to scan it and view this table in a browser.
If you paste this QR Code into your document, anyone with a smartphone or tablet will be able to scan it and view this table in a browser.
If you paste this QR Code into your document, anyone with a smartphone or tablet will be able to scan it and view this table in a browser.
| Maximum Density Values | | Kernel | x-value | max. density | | Gaussian | 8.70396752630695 | 0.625720544327268 | | Epanechnikov | 8.70396752630695 | 0.561155836833257 | | Rectangular | 8.66992487006361 | 0.507264438825676 | | Triangular | 8.69261997422583 | 0.592528234724743 | | Biweight | 8.70396752630695 | 0.581379743528299 | | Cosine | 8.70396752630695 | 0.58844948560548 | | Optcosine | 8.70396752630695 | 0.5676231331402 |
\begin{tabular}{lllllllll}
\hline
Maximum Density Values \tabularnewline
Kernel & x-value & max. density \tabularnewline
Gaussian & 8.70396752630695 & 0.625720544327268 \tabularnewline
Epanechnikov & 8.70396752630695 & 0.561155836833257 \tabularnewline
Rectangular & 8.66992487006361 & 0.507264438825676 \tabularnewline
Triangular & 8.69261997422583 & 0.592528234724743 \tabularnewline
Biweight & 8.70396752630695 & 0.581379743528299 \tabularnewline
Cosine & 8.70396752630695 & 0.58844948560548 \tabularnewline
Optcosine & 8.70396752630695 & 0.5676231331402 \tabularnewline
 \hline
\end{tabular}
%Source: https://freestatistics.org/blog/index.php?pk=170413&T=26
[TABLE]
[ROW][C]Maximum Density Values[/C][/ROW]
[ROW][C]Kernel[/C][C]x-value[/C][C]max. density[/C][/ROW]
[ROW][C]Gaussian[/C][C]8.70396752630695[/C][C]0.625720544327268[/C][/ROW]
[ROW][C]Epanechnikov[/C][C]8.70396752630695[/C][C]0.561155836833257[/C][/ROW]
[ROW][C]Rectangular[/C][C]8.66992487006361[/C][C]0.507264438825676[/C][/ROW]
[ROW][C]Triangular[/C][C]8.69261997422583[/C][C]0.592528234724743[/C][/ROW]
[ROW][C]Biweight[/C][C]8.70396752630695[/C][C]0.581379743528299[/C][/ROW]
[ROW][C]Cosine[/C][C]8.70396752630695[/C][C]0.58844948560548[/C][/ROW]
[ROW][C]Optcosine[/C][C]8.70396752630695[/C][C]0.5676231331402[/C][/ROW]
 [/TABLE]
Source: https://freestatistics.org/blog/index.php?pk=170413&T=26
Globally Unique Identifier (entire table): ba.freestatistics.org/blog/index.php?pk=170413&T=26
As an alternative you can also use a QR Code:
The GUIDs for individual cells are displayed in the table below:
| Maximum Density Values | | Kernel | x-value | max. density | | Gaussian | 8.70396752630695 | 0.625720544327268 | | Epanechnikov | 8.70396752630695 | 0.561155836833257 | | Rectangular | 8.66992487006361 | 0.507264438825676 | | Triangular | 8.69261997422583 | 0.592528234724743 | | Biweight | 8.70396752630695 | 0.581379743528299 | | Cosine | 8.70396752630695 | 0.58844948560548 | | Optcosine | 8.70396752630695 | 0.5676231331402 |
If you paste this QR Code into your document, anyone with a smartphone or tablet will be able to scan it and view this table in a browser.
If you paste this QR Code into your document, anyone with a smartphone or tablet will be able to scan it and view this table in a browser.
If you paste this QR Code into your document, anyone with a smartphone or tablet will be able to scan it and view this table in a browser.
If you paste this QR Code into your document, anyone with a smartphone or tablet will be able to scan it and view this table in a browser.
If you paste this QR Code into your document, anyone with a smartphone or tablet will be able to scan it and view this table in a browser.
| Maximum Density Values | | Kernel | x-value | max. density | | Gaussian | 8.70396752630695 | 0.625720544327268 | | Epanechnikov | 8.70396752630695 | 0.561155836833257 | | Rectangular | 8.68127242214472 | 0.507264438825676 | | Triangular | 8.69261997422583 | 0.592528234724743 | | Biweight | 8.70396752630695 | 0.581379743528299 | | Cosine | 8.70396752630695 | 0.58844948560548 | | Optcosine | 8.70396752630695 | 0.5676231331402 |
\begin{tabular}{lllllllll}
\hline
Maximum Density Values \tabularnewline
Kernel & x-value & max. density \tabularnewline
Gaussian & 8.70396752630695 & 0.625720544327268 \tabularnewline
Epanechnikov & 8.70396752630695 & 0.561155836833257 \tabularnewline
Rectangular & 8.68127242214472 & 0.507264438825676 \tabularnewline
Triangular & 8.69261997422583 & 0.592528234724743 \tabularnewline
Biweight & 8.70396752630695 & 0.581379743528299 \tabularnewline
Cosine & 8.70396752630695 & 0.58844948560548 \tabularnewline
Optcosine & 8.70396752630695 & 0.5676231331402 \tabularnewline
 \hline
\end{tabular}
%Source: https://freestatistics.org/blog/index.php?pk=170413&T=27
[TABLE]
[ROW][C]Maximum Density Values[/C][/ROW]
[ROW][C]Kernel[/C][C]x-value[/C][C]max. density[/C][/ROW]
[ROW][C]Gaussian[/C][C]8.70396752630695[/C][C]0.625720544327268[/C][/ROW]
[ROW][C]Epanechnikov[/C][C]8.70396752630695[/C][C]0.561155836833257[/C][/ROW]
[ROW][C]Rectangular[/C][C]8.68127242214472[/C][C]0.507264438825676[/C][/ROW]
[ROW][C]Triangular[/C][C]8.69261997422583[/C][C]0.592528234724743[/C][/ROW]
[ROW][C]Biweight[/C][C]8.70396752630695[/C][C]0.581379743528299[/C][/ROW]
[ROW][C]Cosine[/C][C]8.70396752630695[/C][C]0.58844948560548[/C][/ROW]
[ROW][C]Optcosine[/C][C]8.70396752630695[/C][C]0.5676231331402[/C][/ROW]
 [/TABLE]
Source: https://freestatistics.org/blog/index.php?pk=170413&T=27
Globally Unique Identifier (entire table): ba.freestatistics.org/blog/index.php?pk=170413&T=27
As an alternative you can also use a QR Code:
The GUIDs for individual cells are displayed in the table below:
| Maximum Density Values | | Kernel | x-value | max. density | | Gaussian | 8.70396752630695 | 0.625720544327268 | | Epanechnikov | 8.70396752630695 | 0.561155836833257 | | Rectangular | 8.68127242214472 | 0.507264438825676 | | Triangular | 8.69261997422583 | 0.592528234724743 | | Biweight | 8.70396752630695 | 0.581379743528299 | | Cosine | 8.70396752630695 | 0.58844948560548 | | Optcosine | 8.70396752630695 | 0.5676231331402 |
If you paste this QR Code into your document, anyone with a smartphone or tablet will be able to scan it and view this table in a browser.
If you paste this QR Code into your document, anyone with a smartphone or tablet will be able to scan it and view this table in a browser.
If you paste this QR Code into your document, anyone with a smartphone or tablet will be able to scan it and view this table in a browser.
If you paste this QR Code into your document, anyone with a smartphone or tablet will be able to scan it and view this table in a browser.
If you paste this QR Code into your document, anyone with a smartphone or tablet will be able to scan it and view this table in a browser.
| Maximum Density Values | | Kernel | x-value | max. density | | Gaussian | 8.70396752630695 | 0.625720544327268 | | Epanechnikov | 8.70396752630695 | 0.561155836833257 | | Rectangular | 8.69261997422583 | 0.507264438825676 | | Triangular | 8.69261997422583 | 0.592528234724743 | | Biweight | 8.70396752630695 | 0.581379743528299 | | Cosine | 8.70396752630695 | 0.58844948560548 | | Optcosine | 8.70396752630695 | 0.5676231331402 |
\begin{tabular}{lllllllll}
\hline
Maximum Density Values \tabularnewline
Kernel & x-value & max. density \tabularnewline
Gaussian & 8.70396752630695 & 0.625720544327268 \tabularnewline
Epanechnikov & 8.70396752630695 & 0.561155836833257 \tabularnewline
Rectangular & 8.69261997422583 & 0.507264438825676 \tabularnewline
Triangular & 8.69261997422583 & 0.592528234724743 \tabularnewline
Biweight & 8.70396752630695 & 0.581379743528299 \tabularnewline
Cosine & 8.70396752630695 & 0.58844948560548 \tabularnewline
Optcosine & 8.70396752630695 & 0.5676231331402 \tabularnewline
 \hline
\end{tabular}
%Source: https://freestatistics.org/blog/index.php?pk=170413&T=28
[TABLE]
[ROW][C]Maximum Density Values[/C][/ROW]
[ROW][C]Kernel[/C][C]x-value[/C][C]max. density[/C][/ROW]
[ROW][C]Gaussian[/C][C]8.70396752630695[/C][C]0.625720544327268[/C][/ROW]
[ROW][C]Epanechnikov[/C][C]8.70396752630695[/C][C]0.561155836833257[/C][/ROW]
[ROW][C]Rectangular[/C][C]8.69261997422583[/C][C]0.507264438825676[/C][/ROW]
[ROW][C]Triangular[/C][C]8.69261997422583[/C][C]0.592528234724743[/C][/ROW]
[ROW][C]Biweight[/C][C]8.70396752630695[/C][C]0.581379743528299[/C][/ROW]
[ROW][C]Cosine[/C][C]8.70396752630695[/C][C]0.58844948560548[/C][/ROW]
[ROW][C]Optcosine[/C][C]8.70396752630695[/C][C]0.5676231331402[/C][/ROW]
 [/TABLE]
Source: https://freestatistics.org/blog/index.php?pk=170413&T=28
Globally Unique Identifier (entire table): ba.freestatistics.org/blog/index.php?pk=170413&T=28
As an alternative you can also use a QR Code:
The GUIDs for individual cells are displayed in the table below:
| Maximum Density Values | | Kernel | x-value | max. density | | Gaussian | 8.70396752630695 | 0.625720544327268 | | Epanechnikov | 8.70396752630695 | 0.561155836833257 | | Rectangular | 8.69261997422583 | 0.507264438825676 | | Triangular | 8.69261997422583 | 0.592528234724743 | | Biweight | 8.70396752630695 | 0.581379743528299 | | Cosine | 8.70396752630695 | 0.58844948560548 | | Optcosine | 8.70396752630695 | 0.5676231331402 |
If you paste this QR Code into your document, anyone with a smartphone or tablet will be able to scan it and view this table in a browser.
If you paste this QR Code into your document, anyone with a smartphone or tablet will be able to scan it and view this table in a browser.
If you paste this QR Code into your document, anyone with a smartphone or tablet will be able to scan it and view this table in a browser.
If you paste this QR Code into your document, anyone with a smartphone or tablet will be able to scan it and view this table in a browser.
If you paste this QR Code into your document, anyone with a smartphone or tablet will be able to scan it and view this table in a browser.
| Maximum Density Values | | Kernel | x-value | max. density | | Gaussian | 8.70396752630695 | 0.625720544327268 | | Epanechnikov | 8.70396752630695 | 0.561155836833257 | | Rectangular | 8.70396752630695 | 0.507264438825676 | | Triangular | 8.69261997422583 | 0.592528234724743 | | Biweight | 8.70396752630695 | 0.581379743528299 | | Cosine | 8.70396752630695 | 0.58844948560548 | | Optcosine | 8.70396752630695 | 0.5676231331402 |
\begin{tabular}{lllllllll}
\hline
Maximum Density Values \tabularnewline
Kernel & x-value & max. density \tabularnewline
Gaussian & 8.70396752630695 & 0.625720544327268 \tabularnewline
Epanechnikov & 8.70396752630695 & 0.561155836833257 \tabularnewline
Rectangular & 8.70396752630695 & 0.507264438825676 \tabularnewline
Triangular & 8.69261997422583 & 0.592528234724743 \tabularnewline
Biweight & 8.70396752630695 & 0.581379743528299 \tabularnewline
Cosine & 8.70396752630695 & 0.58844948560548 \tabularnewline
Optcosine & 8.70396752630695 & 0.5676231331402 \tabularnewline
 \hline
\end{tabular}
%Source: https://freestatistics.org/blog/index.php?pk=170413&T=29
[TABLE]
[ROW][C]Maximum Density Values[/C][/ROW]
[ROW][C]Kernel[/C][C]x-value[/C][C]max. density[/C][/ROW]
[ROW][C]Gaussian[/C][C]8.70396752630695[/C][C]0.625720544327268[/C][/ROW]
[ROW][C]Epanechnikov[/C][C]8.70396752630695[/C][C]0.561155836833257[/C][/ROW]
[ROW][C]Rectangular[/C][C]8.70396752630695[/C][C]0.507264438825676[/C][/ROW]
[ROW][C]Triangular[/C][C]8.69261997422583[/C][C]0.592528234724743[/C][/ROW]
[ROW][C]Biweight[/C][C]8.70396752630695[/C][C]0.581379743528299[/C][/ROW]
[ROW][C]Cosine[/C][C]8.70396752630695[/C][C]0.58844948560548[/C][/ROW]
[ROW][C]Optcosine[/C][C]8.70396752630695[/C][C]0.5676231331402[/C][/ROW]
 [/TABLE]
Source: https://freestatistics.org/blog/index.php?pk=170413&T=29
Globally Unique Identifier (entire table): ba.freestatistics.org/blog/index.php?pk=170413&T=29
As an alternative you can also use a QR Code:
The GUIDs for individual cells are displayed in the table below:
| Maximum Density Values | | Kernel | x-value | max. density | | Gaussian | 8.70396752630695 | 0.625720544327268 | | Epanechnikov | 8.70396752630695 | 0.561155836833257 | | Rectangular | 8.70396752630695 | 0.507264438825676 | | Triangular | 8.69261997422583 | 0.592528234724743 | | Biweight | 8.70396752630695 | 0.581379743528299 | | Cosine | 8.70396752630695 | 0.58844948560548 | | Optcosine | 8.70396752630695 | 0.5676231331402 |
If you paste this QR Code into your document, anyone with a smartphone or tablet will be able to scan it and view this table in a browser.
If you paste this QR Code into your document, anyone with a smartphone or tablet will be able to scan it and view this table in a browser.
If you paste this QR Code into your document, anyone with a smartphone or tablet will be able to scan it and view this table in a browser.
If you paste this QR Code into your document, anyone with a smartphone or tablet will be able to scan it and view this table in a browser.
If you paste this QR Code into your document, anyone with a smartphone or tablet will be able to scan it and view this table in a browser.
| Maximum Density Values | | Kernel | x-value | max. density | | Gaussian | 8.70396752630695 | 0.625720544327268 | | Epanechnikov | 8.70396752630695 | 0.561155836833257 | | Rectangular | 8.71531507838806 | 0.507264438825676 | | Triangular | 8.69261997422583 | 0.592528234724743 | | Biweight | 8.70396752630695 | 0.581379743528299 | | Cosine | 8.70396752630695 | 0.58844948560548 | | Optcosine | 8.70396752630695 | 0.5676231331402 |
\begin{tabular}{lllllllll}
\hline
Maximum Density Values \tabularnewline
Kernel & x-value & max. density \tabularnewline
Gaussian & 8.70396752630695 & 0.625720544327268 \tabularnewline
Epanechnikov & 8.70396752630695 & 0.561155836833257 \tabularnewline
Rectangular & 8.71531507838806 & 0.507264438825676 \tabularnewline
Triangular & 8.69261997422583 & 0.592528234724743 \tabularnewline
Biweight & 8.70396752630695 & 0.581379743528299 \tabularnewline
Cosine & 8.70396752630695 & 0.58844948560548 \tabularnewline
Optcosine & 8.70396752630695 & 0.5676231331402 \tabularnewline
 \hline
\end{tabular}
%Source: https://freestatistics.org/blog/index.php?pk=170413&T=30
[TABLE]
[ROW][C]Maximum Density Values[/C][/ROW]
[ROW][C]Kernel[/C][C]x-value[/C][C]max. density[/C][/ROW]
[ROW][C]Gaussian[/C][C]8.70396752630695[/C][C]0.625720544327268[/C][/ROW]
[ROW][C]Epanechnikov[/C][C]8.70396752630695[/C][C]0.561155836833257[/C][/ROW]
[ROW][C]Rectangular[/C][C]8.71531507838806[/C][C]0.507264438825676[/C][/ROW]
[ROW][C]Triangular[/C][C]8.69261997422583[/C][C]0.592528234724743[/C][/ROW]
[ROW][C]Biweight[/C][C]8.70396752630695[/C][C]0.581379743528299[/C][/ROW]
[ROW][C]Cosine[/C][C]8.70396752630695[/C][C]0.58844948560548[/C][/ROW]
[ROW][C]Optcosine[/C][C]8.70396752630695[/C][C]0.5676231331402[/C][/ROW]
 [/TABLE]
Source: https://freestatistics.org/blog/index.php?pk=170413&T=30
Globally Unique Identifier (entire table): ba.freestatistics.org/blog/index.php?pk=170413&T=30
As an alternative you can also use a QR Code:
The GUIDs for individual cells are displayed in the table below:
| Maximum Density Values | | Kernel | x-value | max. density | | Gaussian | 8.70396752630695 | 0.625720544327268 | | Epanechnikov | 8.70396752630695 | 0.561155836833257 | | Rectangular | 8.71531507838806 | 0.507264438825676 | | Triangular | 8.69261997422583 | 0.592528234724743 | | Biweight | 8.70396752630695 | 0.581379743528299 | | Cosine | 8.70396752630695 | 0.58844948560548 | | Optcosine | 8.70396752630695 | 0.5676231331402 |
If you paste this QR Code into your document, anyone with a smartphone or tablet will be able to scan it and view this table in a browser.
If you paste this QR Code into your document, anyone with a smartphone or tablet will be able to scan it and view this table in a browser.
If you paste this QR Code into your document, anyone with a smartphone or tablet will be able to scan it and view this table in a browser.
If you paste this QR Code into your document, anyone with a smartphone or tablet will be able to scan it and view this table in a browser.
If you paste this QR Code into your document, anyone with a smartphone or tablet will be able to scan it and view this table in a browser.
| Maximum Density Values | | Kernel | x-value | max. density | | Gaussian | 8.70396752630695 | 0.625720544327268 | | Epanechnikov | 8.70396752630695 | 0.561155836833257 | | Rectangular | 8.72666263046918 | 0.507264438825676 | | Triangular | 8.69261997422583 | 0.592528234724743 | | Biweight | 8.70396752630695 | 0.581379743528299 | | Cosine | 8.70396752630695 | 0.58844948560548 | | Optcosine | 8.70396752630695 | 0.5676231331402 |
\begin{tabular}{lllllllll}
\hline
Maximum Density Values \tabularnewline
Kernel & x-value & max. density \tabularnewline
Gaussian & 8.70396752630695 & 0.625720544327268 \tabularnewline
Epanechnikov & 8.70396752630695 & 0.561155836833257 \tabularnewline
Rectangular & 8.72666263046918 & 0.507264438825676 \tabularnewline
Triangular & 8.69261997422583 & 0.592528234724743 \tabularnewline
Biweight & 8.70396752630695 & 0.581379743528299 \tabularnewline
Cosine & 8.70396752630695 & 0.58844948560548 \tabularnewline
Optcosine & 8.70396752630695 & 0.5676231331402 \tabularnewline
 \hline
\end{tabular}
%Source: https://freestatistics.org/blog/index.php?pk=170413&T=31
[TABLE]
[ROW][C]Maximum Density Values[/C][/ROW]
[ROW][C]Kernel[/C][C]x-value[/C][C]max. density[/C][/ROW]
[ROW][C]Gaussian[/C][C]8.70396752630695[/C][C]0.625720544327268[/C][/ROW]
[ROW][C]Epanechnikov[/C][C]8.70396752630695[/C][C]0.561155836833257[/C][/ROW]
[ROW][C]Rectangular[/C][C]8.72666263046918[/C][C]0.507264438825676[/C][/ROW]
[ROW][C]Triangular[/C][C]8.69261997422583[/C][C]0.592528234724743[/C][/ROW]
[ROW][C]Biweight[/C][C]8.70396752630695[/C][C]0.581379743528299[/C][/ROW]
[ROW][C]Cosine[/C][C]8.70396752630695[/C][C]0.58844948560548[/C][/ROW]
[ROW][C]Optcosine[/C][C]8.70396752630695[/C][C]0.5676231331402[/C][/ROW]
 [/TABLE]
Source: https://freestatistics.org/blog/index.php?pk=170413&T=31
Globally Unique Identifier (entire table): ba.freestatistics.org/blog/index.php?pk=170413&T=31
As an alternative you can also use a QR Code:
The GUIDs for individual cells are displayed in the table below:
| Maximum Density Values | | Kernel | x-value | max. density | | Gaussian | 8.70396752630695 | 0.625720544327268 | | Epanechnikov | 8.70396752630695 | 0.561155836833257 | | Rectangular | 8.72666263046918 | 0.507264438825676 | | Triangular | 8.69261997422583 | 0.592528234724743 | | Biweight | 8.70396752630695 | 0.581379743528299 | | Cosine | 8.70396752630695 | 0.58844948560548 | | Optcosine | 8.70396752630695 | 0.5676231331402 |
If you paste this QR Code into your document, anyone with a smartphone or tablet will be able to scan it and view this table in a browser.
If you paste this QR Code into your document, anyone with a smartphone or tablet will be able to scan it and view this table in a browser.
If you paste this QR Code into your document, anyone with a smartphone or tablet will be able to scan it and view this table in a browser.
If you paste this QR Code into your document, anyone with a smartphone or tablet will be able to scan it and view this table in a browser.
If you paste this QR Code into your document, anyone with a smartphone or tablet will be able to scan it and view this table in a browser.
| Maximum Density Values | | Kernel | x-value | max. density | | Gaussian | 8.70396752630695 | 0.625720544327268 | | Epanechnikov | 8.70396752630695 | 0.561155836833257 | | Rectangular | 8.73801018255029 | 0.507264438825676 | | Triangular | 8.69261997422583 | 0.592528234724743 | | Biweight | 8.70396752630695 | 0.581379743528299 | | Cosine | 8.70396752630695 | 0.58844948560548 | | Optcosine | 8.70396752630695 | 0.5676231331402 |
\begin{tabular}{lllllllll}
\hline
Maximum Density Values \tabularnewline
Kernel & x-value & max. density \tabularnewline
Gaussian & 8.70396752630695 & 0.625720544327268 \tabularnewline
Epanechnikov & 8.70396752630695 & 0.561155836833257 \tabularnewline
Rectangular & 8.73801018255029 & 0.507264438825676 \tabularnewline
Triangular & 8.69261997422583 & 0.592528234724743 \tabularnewline
Biweight & 8.70396752630695 & 0.581379743528299 \tabularnewline
Cosine & 8.70396752630695 & 0.58844948560548 \tabularnewline
Optcosine & 8.70396752630695 & 0.5676231331402 \tabularnewline
 \hline
\end{tabular}
%Source: https://freestatistics.org/blog/index.php?pk=170413&T=32
[TABLE]
[ROW][C]Maximum Density Values[/C][/ROW]
[ROW][C]Kernel[/C][C]x-value[/C][C]max. density[/C][/ROW]
[ROW][C]Gaussian[/C][C]8.70396752630695[/C][C]0.625720544327268[/C][/ROW]
[ROW][C]Epanechnikov[/C][C]8.70396752630695[/C][C]0.561155836833257[/C][/ROW]
[ROW][C]Rectangular[/C][C]8.73801018255029[/C][C]0.507264438825676[/C][/ROW]
[ROW][C]Triangular[/C][C]8.69261997422583[/C][C]0.592528234724743[/C][/ROW]
[ROW][C]Biweight[/C][C]8.70396752630695[/C][C]0.581379743528299[/C][/ROW]
[ROW][C]Cosine[/C][C]8.70396752630695[/C][C]0.58844948560548[/C][/ROW]
[ROW][C]Optcosine[/C][C]8.70396752630695[/C][C]0.5676231331402[/C][/ROW]
 [/TABLE]
Source: https://freestatistics.org/blog/index.php?pk=170413&T=32
Globally Unique Identifier (entire table): ba.freestatistics.org/blog/index.php?pk=170413&T=32
As an alternative you can also use a QR Code:
The GUIDs for individual cells are displayed in the table below:
| Maximum Density Values | | Kernel | x-value | max. density | | Gaussian | 8.70396752630695 | 0.625720544327268 | | Epanechnikov | 8.70396752630695 | 0.561155836833257 | | Rectangular | 8.73801018255029 | 0.507264438825676 | | Triangular | 8.69261997422583 | 0.592528234724743 | | Biweight | 8.70396752630695 | 0.581379743528299 | | Cosine | 8.70396752630695 | 0.58844948560548 | | Optcosine | 8.70396752630695 | 0.5676231331402 |
If you paste this QR Code into your document, anyone with a smartphone or tablet will be able to scan it and view this table in a browser.
If you paste this QR Code into your document, anyone with a smartphone or tablet will be able to scan it and view this table in a browser.
If you paste this QR Code into your document, anyone with a smartphone or tablet will be able to scan it and view this table in a browser.
If you paste this QR Code into your document, anyone with a smartphone or tablet will be able to scan it and view this table in a browser.
If you paste this QR Code into your document, anyone with a smartphone or tablet will be able to scan it and view this table in a browser.
| Maximum Density Values | | Kernel | x-value | max. density | | Gaussian | 8.70396752630695 | 0.625720544327268 | | Epanechnikov | 8.70396752630695 | 0.561155836833257 | | Rectangular | 8.7493577346314 | 0.507264438825676 | | Triangular | 8.69261997422583 | 0.592528234724743 | | Biweight | 8.70396752630695 | 0.581379743528299 | | Cosine | 8.70396752630695 | 0.58844948560548 | | Optcosine | 8.70396752630695 | 0.5676231331402 |
\begin{tabular}{lllllllll}
\hline
Maximum Density Values \tabularnewline
Kernel & x-value & max. density \tabularnewline
Gaussian & 8.70396752630695 & 0.625720544327268 \tabularnewline
Epanechnikov & 8.70396752630695 & 0.561155836833257 \tabularnewline
Rectangular & 8.7493577346314 & 0.507264438825676 \tabularnewline
Triangular & 8.69261997422583 & 0.592528234724743 \tabularnewline
Biweight & 8.70396752630695 & 0.581379743528299 \tabularnewline
Cosine & 8.70396752630695 & 0.58844948560548 \tabularnewline
Optcosine & 8.70396752630695 & 0.5676231331402 \tabularnewline
 \hline
\end{tabular}
%Source: https://freestatistics.org/blog/index.php?pk=170413&T=33
[TABLE]
[ROW][C]Maximum Density Values[/C][/ROW]
[ROW][C]Kernel[/C][C]x-value[/C][C]max. density[/C][/ROW]
[ROW][C]Gaussian[/C][C]8.70396752630695[/C][C]0.625720544327268[/C][/ROW]
[ROW][C]Epanechnikov[/C][C]8.70396752630695[/C][C]0.561155836833257[/C][/ROW]
[ROW][C]Rectangular[/C][C]8.7493577346314[/C][C]0.507264438825676[/C][/ROW]
[ROW][C]Triangular[/C][C]8.69261997422583[/C][C]0.592528234724743[/C][/ROW]
[ROW][C]Biweight[/C][C]8.70396752630695[/C][C]0.581379743528299[/C][/ROW]
[ROW][C]Cosine[/C][C]8.70396752630695[/C][C]0.58844948560548[/C][/ROW]
[ROW][C]Optcosine[/C][C]8.70396752630695[/C][C]0.5676231331402[/C][/ROW]
 [/TABLE]
Source: https://freestatistics.org/blog/index.php?pk=170413&T=33
Globally Unique Identifier (entire table): ba.freestatistics.org/blog/index.php?pk=170413&T=33
As an alternative you can also use a QR Code:
The GUIDs for individual cells are displayed in the table below:
| Maximum Density Values | | Kernel | x-value | max. density | | Gaussian | 8.70396752630695 | 0.625720544327268 | | Epanechnikov | 8.70396752630695 | 0.561155836833257 | | Rectangular | 8.7493577346314 | 0.507264438825676 | | Triangular | 8.69261997422583 | 0.592528234724743 | | Biweight | 8.70396752630695 | 0.581379743528299 | | Cosine | 8.70396752630695 | 0.58844948560548 | | Optcosine | 8.70396752630695 | 0.5676231331402 |
If you paste this QR Code into your document, anyone with a smartphone or tablet will be able to scan it and view this table in a browser.
If you paste this QR Code into your document, anyone with a smartphone or tablet will be able to scan it and view this table in a browser.
If you paste this QR Code into your document, anyone with a smartphone or tablet will be able to scan it and view this table in a browser.
If you paste this QR Code into your document, anyone with a smartphone or tablet will be able to scan it and view this table in a browser.
If you paste this QR Code into your document, anyone with a smartphone or tablet will be able to scan it and view this table in a browser.
| Maximum Density Values | | Kernel | x-value | max. density | | Gaussian | 8.70396752630695 | 0.625720544327268 | | Epanechnikov | 8.70396752630695 | 0.561155836833257 | | Rectangular | 8.76070528671252 | 0.507264438825676 | | Triangular | 8.69261997422583 | 0.592528234724743 | | Biweight | 8.70396752630695 | 0.581379743528299 | | Cosine | 8.70396752630695 | 0.58844948560548 | | Optcosine | 8.70396752630695 | 0.5676231331402 |
\begin{tabular}{lllllllll}
\hline
Maximum Density Values \tabularnewline
Kernel & x-value & max. density \tabularnewline
Gaussian & 8.70396752630695 & 0.625720544327268 \tabularnewline
Epanechnikov & 8.70396752630695 & 0.561155836833257 \tabularnewline
Rectangular & 8.76070528671252 & 0.507264438825676 \tabularnewline
Triangular & 8.69261997422583 & 0.592528234724743 \tabularnewline
Biweight & 8.70396752630695 & 0.581379743528299 \tabularnewline
Cosine & 8.70396752630695 & 0.58844948560548 \tabularnewline
Optcosine & 8.70396752630695 & 0.5676231331402 \tabularnewline
 \hline
\end{tabular}
%Source: https://freestatistics.org/blog/index.php?pk=170413&T=34
[TABLE]
[ROW][C]Maximum Density Values[/C][/ROW]
[ROW][C]Kernel[/C][C]x-value[/C][C]max. density[/C][/ROW]
[ROW][C]Gaussian[/C][C]8.70396752630695[/C][C]0.625720544327268[/C][/ROW]
[ROW][C]Epanechnikov[/C][C]8.70396752630695[/C][C]0.561155836833257[/C][/ROW]
[ROW][C]Rectangular[/C][C]8.76070528671252[/C][C]0.507264438825676[/C][/ROW]
[ROW][C]Triangular[/C][C]8.69261997422583[/C][C]0.592528234724743[/C][/ROW]
[ROW][C]Biweight[/C][C]8.70396752630695[/C][C]0.581379743528299[/C][/ROW]
[ROW][C]Cosine[/C][C]8.70396752630695[/C][C]0.58844948560548[/C][/ROW]
[ROW][C]Optcosine[/C][C]8.70396752630695[/C][C]0.5676231331402[/C][/ROW]
 [/TABLE]
Source: https://freestatistics.org/blog/index.php?pk=170413&T=34
Globally Unique Identifier (entire table): ba.freestatistics.org/blog/index.php?pk=170413&T=34
As an alternative you can also use a QR Code:
The GUIDs for individual cells are displayed in the table below:
| Maximum Density Values | | Kernel | x-value | max. density | | Gaussian | 8.70396752630695 | 0.625720544327268 | | Epanechnikov | 8.70396752630695 | 0.561155836833257 | | Rectangular | 8.76070528671252 | 0.507264438825676 | | Triangular | 8.69261997422583 | 0.592528234724743 | | Biweight | 8.70396752630695 | 0.581379743528299 | | Cosine | 8.70396752630695 | 0.58844948560548 | | Optcosine | 8.70396752630695 | 0.5676231331402 |
If you paste this QR Code into your document, anyone with a smartphone or tablet will be able to scan it and view this table in a browser.
If you paste this QR Code into your document, anyone with a smartphone or tablet will be able to scan it and view this table in a browser.
If you paste this QR Code into your document, anyone with a smartphone or tablet will be able to scan it and view this table in a browser.
If you paste this QR Code into your document, anyone with a smartphone or tablet will be able to scan it and view this table in a browser.
If you paste this QR Code into your document, anyone with a smartphone or tablet will be able to scan it and view this table in a browser.
| Maximum Density Values | | Kernel | x-value | max. density | | Gaussian | 8.70396752630695 | 0.625720544327268 | | Epanechnikov | 8.70396752630695 | 0.561155836833257 | | Rectangular | 8.77205283879363 | 0.507264438825676 | | Triangular | 8.69261997422583 | 0.592528234724743 | | Biweight | 8.70396752630695 | 0.581379743528299 | | Cosine | 8.70396752630695 | 0.58844948560548 | | Optcosine | 8.70396752630695 | 0.5676231331402 |
\begin{tabular}{lllllllll}
\hline
Maximum Density Values \tabularnewline
Kernel & x-value & max. density \tabularnewline
Gaussian & 8.70396752630695 & 0.625720544327268 \tabularnewline
Epanechnikov & 8.70396752630695 & 0.561155836833257 \tabularnewline
Rectangular & 8.77205283879363 & 0.507264438825676 \tabularnewline
Triangular & 8.69261997422583 & 0.592528234724743 \tabularnewline
Biweight & 8.70396752630695 & 0.581379743528299 \tabularnewline
Cosine & 8.70396752630695 & 0.58844948560548 \tabularnewline
Optcosine & 8.70396752630695 & 0.5676231331402 \tabularnewline
 \hline
\end{tabular}
%Source: https://freestatistics.org/blog/index.php?pk=170413&T=35
[TABLE]
[ROW][C]Maximum Density Values[/C][/ROW]
[ROW][C]Kernel[/C][C]x-value[/C][C]max. density[/C][/ROW]
[ROW][C]Gaussian[/C][C]8.70396752630695[/C][C]0.625720544327268[/C][/ROW]
[ROW][C]Epanechnikov[/C][C]8.70396752630695[/C][C]0.561155836833257[/C][/ROW]
[ROW][C]Rectangular[/C][C]8.77205283879363[/C][C]0.507264438825676[/C][/ROW]
[ROW][C]Triangular[/C][C]8.69261997422583[/C][C]0.592528234724743[/C][/ROW]
[ROW][C]Biweight[/C][C]8.70396752630695[/C][C]0.581379743528299[/C][/ROW]
[ROW][C]Cosine[/C][C]8.70396752630695[/C][C]0.58844948560548[/C][/ROW]
[ROW][C]Optcosine[/C][C]8.70396752630695[/C][C]0.5676231331402[/C][/ROW]
 [/TABLE]
Source: https://freestatistics.org/blog/index.php?pk=170413&T=35
Globally Unique Identifier (entire table): ba.freestatistics.org/blog/index.php?pk=170413&T=35
As an alternative you can also use a QR Code:
The GUIDs for individual cells are displayed in the table below:
| Maximum Density Values | | Kernel | x-value | max. density | | Gaussian | 8.70396752630695 | 0.625720544327268 | | Epanechnikov | 8.70396752630695 | 0.561155836833257 | | Rectangular | 8.77205283879363 | 0.507264438825676 | | Triangular | 8.69261997422583 | 0.592528234724743 | | Biweight | 8.70396752630695 | 0.581379743528299 | | Cosine | 8.70396752630695 | 0.58844948560548 | | Optcosine | 8.70396752630695 | 0.5676231331402 |
If you paste this QR Code into your document, anyone with a smartphone or tablet will be able to scan it and view this table in a browser.
If you paste this QR Code into your document, anyone with a smartphone or tablet will be able to scan it and view this table in a browser.
If you paste this QR Code into your document, anyone with a smartphone or tablet will be able to scan it and view this table in a browser.
If you paste this QR Code into your document, anyone with a smartphone or tablet will be able to scan it and view this table in a browser.
If you paste this QR Code into your document, anyone with a smartphone or tablet will be able to scan it and view this table in a browser.
| Maximum Density Values | | Kernel | x-value | max. density | | Gaussian | 8.70396752630695 | 0.625720544327268 | | Epanechnikov | 8.70396752630695 | 0.561155836833257 | | Rectangular | 8.78340039087474 | 0.507264438825676 | | Triangular | 8.69261997422583 | 0.592528234724743 | | Biweight | 8.70396752630695 | 0.581379743528299 | | Cosine | 8.70396752630695 | 0.58844948560548 | | Optcosine | 8.70396752630695 | 0.5676231331402 |
\begin{tabular}{lllllllll}
\hline
Maximum Density Values \tabularnewline
Kernel & x-value & max. density \tabularnewline
Gaussian & 8.70396752630695 & 0.625720544327268 \tabularnewline
Epanechnikov & 8.70396752630695 & 0.561155836833257 \tabularnewline
Rectangular & 8.78340039087474 & 0.507264438825676 \tabularnewline
Triangular & 8.69261997422583 & 0.592528234724743 \tabularnewline
Biweight & 8.70396752630695 & 0.581379743528299 \tabularnewline
Cosine & 8.70396752630695 & 0.58844948560548 \tabularnewline
Optcosine & 8.70396752630695 & 0.5676231331402 \tabularnewline
 \hline
\end{tabular}
%Source: https://freestatistics.org/blog/index.php?pk=170413&T=36
[TABLE]
[ROW][C]Maximum Density Values[/C][/ROW]
[ROW][C]Kernel[/C][C]x-value[/C][C]max. density[/C][/ROW]
[ROW][C]Gaussian[/C][C]8.70396752630695[/C][C]0.625720544327268[/C][/ROW]
[ROW][C]Epanechnikov[/C][C]8.70396752630695[/C][C]0.561155836833257[/C][/ROW]
[ROW][C]Rectangular[/C][C]8.78340039087474[/C][C]0.507264438825676[/C][/ROW]
[ROW][C]Triangular[/C][C]8.69261997422583[/C][C]0.592528234724743[/C][/ROW]
[ROW][C]Biweight[/C][C]8.70396752630695[/C][C]0.581379743528299[/C][/ROW]
[ROW][C]Cosine[/C][C]8.70396752630695[/C][C]0.58844948560548[/C][/ROW]
[ROW][C]Optcosine[/C][C]8.70396752630695[/C][C]0.5676231331402[/C][/ROW]
 [/TABLE]
Source: https://freestatistics.org/blog/index.php?pk=170413&T=36
Globally Unique Identifier (entire table): ba.freestatistics.org/blog/index.php?pk=170413&T=36
As an alternative you can also use a QR Code:
The GUIDs for individual cells are displayed in the table below:
| Maximum Density Values | | Kernel | x-value | max. density | | Gaussian | 8.70396752630695 | 0.625720544327268 | | Epanechnikov | 8.70396752630695 | 0.561155836833257 | | Rectangular | 8.78340039087474 | 0.507264438825676 | | Triangular | 8.69261997422583 | 0.592528234724743 | | Biweight | 8.70396752630695 | 0.581379743528299 | | Cosine | 8.70396752630695 | 0.58844948560548 | | Optcosine | 8.70396752630695 | 0.5676231331402 |
If you paste this QR Code into your document, anyone with a smartphone or tablet will be able to scan it and view this table in a browser.
If you paste this QR Code into your document, anyone with a smartphone or tablet will be able to scan it and view this table in a browser.
If you paste this QR Code into your document, anyone with a smartphone or tablet will be able to scan it and view this table in a browser.
If you paste this QR Code into your document, anyone with a smartphone or tablet will be able to scan it and view this table in a browser.
If you paste this QR Code into your document, anyone with a smartphone or tablet will be able to scan it and view this table in a browser.
| Maximum Density Values | | Kernel | x-value | max. density | | Gaussian | 8.70396752630695 | 0.625720544327268 | | Epanechnikov | 8.70396752630695 | 0.561155836833257 | | Rectangular | 8.79474794295586 | 0.507264438825676 | | Triangular | 8.69261997422583 | 0.592528234724743 | | Biweight | 8.70396752630695 | 0.581379743528299 | | Cosine | 8.70396752630695 | 0.58844948560548 | | Optcosine | 8.70396752630695 | 0.5676231331402 |
\begin{tabular}{lllllllll}
\hline
Maximum Density Values \tabularnewline
Kernel & x-value & max. density \tabularnewline
Gaussian & 8.70396752630695 & 0.625720544327268 \tabularnewline
Epanechnikov & 8.70396752630695 & 0.561155836833257 \tabularnewline
Rectangular & 8.79474794295586 & 0.507264438825676 \tabularnewline
Triangular & 8.69261997422583 & 0.592528234724743 \tabularnewline
Biweight & 8.70396752630695 & 0.581379743528299 \tabularnewline
Cosine & 8.70396752630695 & 0.58844948560548 \tabularnewline
Optcosine & 8.70396752630695 & 0.5676231331402 \tabularnewline
 \hline
\end{tabular}
%Source: https://freestatistics.org/blog/index.php?pk=170413&T=37
[TABLE]
[ROW][C]Maximum Density Values[/C][/ROW]
[ROW][C]Kernel[/C][C]x-value[/C][C]max. density[/C][/ROW]
[ROW][C]Gaussian[/C][C]8.70396752630695[/C][C]0.625720544327268[/C][/ROW]
[ROW][C]Epanechnikov[/C][C]8.70396752630695[/C][C]0.561155836833257[/C][/ROW]
[ROW][C]Rectangular[/C][C]8.79474794295586[/C][C]0.507264438825676[/C][/ROW]
[ROW][C]Triangular[/C][C]8.69261997422583[/C][C]0.592528234724743[/C][/ROW]
[ROW][C]Biweight[/C][C]8.70396752630695[/C][C]0.581379743528299[/C][/ROW]
[ROW][C]Cosine[/C][C]8.70396752630695[/C][C]0.58844948560548[/C][/ROW]
[ROW][C]Optcosine[/C][C]8.70396752630695[/C][C]0.5676231331402[/C][/ROW]
 [/TABLE]
Source: https://freestatistics.org/blog/index.php?pk=170413&T=37
Globally Unique Identifier (entire table): ba.freestatistics.org/blog/index.php?pk=170413&T=37
As an alternative you can also use a QR Code:
The GUIDs for individual cells are displayed in the table below:
| Maximum Density Values | | Kernel | x-value | max. density | | Gaussian | 8.70396752630695 | 0.625720544327268 | | Epanechnikov | 8.70396752630695 | 0.561155836833257 | | Rectangular | 8.79474794295586 | 0.507264438825676 | | Triangular | 8.69261997422583 | 0.592528234724743 | | Biweight | 8.70396752630695 | 0.581379743528299 | | Cosine | 8.70396752630695 | 0.58844948560548 | | Optcosine | 8.70396752630695 | 0.5676231331402 |
If you paste this QR Code into your document, anyone with a smartphone or tablet will be able to scan it and view this table in a browser.
If you paste this QR Code into your document, anyone with a smartphone or tablet will be able to scan it and view this table in a browser.
If you paste this QR Code into your document, anyone with a smartphone or tablet will be able to scan it and view this table in a browser.
If you paste this QR Code into your document, anyone with a smartphone or tablet will be able to scan it and view this table in a browser.
If you paste this QR Code into your document, anyone with a smartphone or tablet will be able to scan it and view this table in a browser.
| Maximum Density Values | | Kernel | x-value | max. density | | Gaussian | 8.70396752630695 | 0.625720544327268 | | Epanechnikov | 8.70396752630695 | 0.561155836833257 | | Rectangular | 8.80609549503697 | 0.507264438825676 | | Triangular | 8.69261997422583 | 0.592528234724743 | | Biweight | 8.70396752630695 | 0.581379743528299 | | Cosine | 8.70396752630695 | 0.58844948560548 | | Optcosine | 8.70396752630695 | 0.5676231331402 |
\begin{tabular}{lllllllll}
\hline
Maximum Density Values \tabularnewline
Kernel & x-value & max. density \tabularnewline
Gaussian & 8.70396752630695 & 0.625720544327268 \tabularnewline
Epanechnikov & 8.70396752630695 & 0.561155836833257 \tabularnewline
Rectangular & 8.80609549503697 & 0.507264438825676 \tabularnewline
Triangular & 8.69261997422583 & 0.592528234724743 \tabularnewline
Biweight & 8.70396752630695 & 0.581379743528299 \tabularnewline
Cosine & 8.70396752630695 & 0.58844948560548 \tabularnewline
Optcosine & 8.70396752630695 & 0.5676231331402 \tabularnewline
 \hline
\end{tabular}
%Source: https://freestatistics.org/blog/index.php?pk=170413&T=38
[TABLE]
[ROW][C]Maximum Density Values[/C][/ROW]
[ROW][C]Kernel[/C][C]x-value[/C][C]max. density[/C][/ROW]
[ROW][C]Gaussian[/C][C]8.70396752630695[/C][C]0.625720544327268[/C][/ROW]
[ROW][C]Epanechnikov[/C][C]8.70396752630695[/C][C]0.561155836833257[/C][/ROW]
[ROW][C]Rectangular[/C][C]8.80609549503697[/C][C]0.507264438825676[/C][/ROW]
[ROW][C]Triangular[/C][C]8.69261997422583[/C][C]0.592528234724743[/C][/ROW]
[ROW][C]Biweight[/C][C]8.70396752630695[/C][C]0.581379743528299[/C][/ROW]
[ROW][C]Cosine[/C][C]8.70396752630695[/C][C]0.58844948560548[/C][/ROW]
[ROW][C]Optcosine[/C][C]8.70396752630695[/C][C]0.5676231331402[/C][/ROW]
 [/TABLE]
Source: https://freestatistics.org/blog/index.php?pk=170413&T=38
Globally Unique Identifier (entire table): ba.freestatistics.org/blog/index.php?pk=170413&T=38
As an alternative you can also use a QR Code:
The GUIDs for individual cells are displayed in the table below:
| Maximum Density Values | | Kernel | x-value | max. density | | Gaussian | 8.70396752630695 | 0.625720544327268 | | Epanechnikov | 8.70396752630695 | 0.561155836833257 | | Rectangular | 8.80609549503697 | 0.507264438825676 | | Triangular | 8.69261997422583 | 0.592528234724743 | | Biweight | 8.70396752630695 | 0.581379743528299 | | Cosine | 8.70396752630695 | 0.58844948560548 | | Optcosine | 8.70396752630695 | 0.5676231331402 |
If you paste this QR Code into your document, anyone with a smartphone or tablet will be able to scan it and view this table in a browser.
If you paste this QR Code into your document, anyone with a smartphone or tablet will be able to scan it and view this table in a browser.
If you paste this QR Code into your document, anyone with a smartphone or tablet will be able to scan it and view this table in a browser.
If you paste this QR Code into your document, anyone with a smartphone or tablet will be able to scan it and view this table in a browser.
If you paste this QR Code into your document, anyone with a smartphone or tablet will be able to scan it and view this table in a browser.
| Maximum Density Values | | Kernel | x-value | max. density | | Gaussian | 8.70396752630695 | 0.625720544327268 | | Epanechnikov | 8.70396752630695 | 0.561155836833257 | | Rectangular | 8.81744304711808 | 0.507264438825676 | | Triangular | 8.69261997422583 | 0.592528234724743 | | Biweight | 8.70396752630695 | 0.581379743528299 | | Cosine | 8.70396752630695 | 0.58844948560548 | | Optcosine | 8.70396752630695 | 0.5676231331402 |
\begin{tabular}{lllllllll}
\hline
Maximum Density Values \tabularnewline
Kernel & x-value & max. density \tabularnewline
Gaussian & 8.70396752630695 & 0.625720544327268 \tabularnewline
Epanechnikov & 8.70396752630695 & 0.561155836833257 \tabularnewline
Rectangular & 8.81744304711808 & 0.507264438825676 \tabularnewline
Triangular & 8.69261997422583 & 0.592528234724743 \tabularnewline
Biweight & 8.70396752630695 & 0.581379743528299 \tabularnewline
Cosine & 8.70396752630695 & 0.58844948560548 \tabularnewline
Optcosine & 8.70396752630695 & 0.5676231331402 \tabularnewline
 \hline
\end{tabular}
%Source: https://freestatistics.org/blog/index.php?pk=170413&T=39
[TABLE]
[ROW][C]Maximum Density Values[/C][/ROW]
[ROW][C]Kernel[/C][C]x-value[/C][C]max. density[/C][/ROW]
[ROW][C]Gaussian[/C][C]8.70396752630695[/C][C]0.625720544327268[/C][/ROW]
[ROW][C]Epanechnikov[/C][C]8.70396752630695[/C][C]0.561155836833257[/C][/ROW]
[ROW][C]Rectangular[/C][C]8.81744304711808[/C][C]0.507264438825676[/C][/ROW]
[ROW][C]Triangular[/C][C]8.69261997422583[/C][C]0.592528234724743[/C][/ROW]
[ROW][C]Biweight[/C][C]8.70396752630695[/C][C]0.581379743528299[/C][/ROW]
[ROW][C]Cosine[/C][C]8.70396752630695[/C][C]0.58844948560548[/C][/ROW]
[ROW][C]Optcosine[/C][C]8.70396752630695[/C][C]0.5676231331402[/C][/ROW]
 [/TABLE]
Source: https://freestatistics.org/blog/index.php?pk=170413&T=39
Globally Unique Identifier (entire table): ba.freestatistics.org/blog/index.php?pk=170413&T=39
As an alternative you can also use a QR Code:
The GUIDs for individual cells are displayed in the table below:
| Maximum Density Values | | Kernel | x-value | max. density | | Gaussian | 8.70396752630695 | 0.625720544327268 | | Epanechnikov | 8.70396752630695 | 0.561155836833257 | | Rectangular | 8.81744304711808 | 0.507264438825676 | | Triangular | 8.69261997422583 | 0.592528234724743 | | Biweight | 8.70396752630695 | 0.581379743528299 | | Cosine | 8.70396752630695 | 0.58844948560548 | | Optcosine | 8.70396752630695 | 0.5676231331402 |
If you paste this QR Code into your document, anyone with a smartphone or tablet will be able to scan it and view this table in a browser.
If you paste this QR Code into your document, anyone with a smartphone or tablet will be able to scan it and view this table in a browser.
If you paste this QR Code into your document, anyone with a smartphone or tablet will be able to scan it and view this table in a browser.
If you paste this QR Code into your document, anyone with a smartphone or tablet will be able to scan it and view this table in a browser.
If you paste this QR Code into your document, anyone with a smartphone or tablet will be able to scan it and view this table in a browser.
| Maximum Density Values | | Kernel | x-value | max. density | | Gaussian | 8.70396752630695 | 0.625720544327268 | | Epanechnikov | 8.70396752630695 | 0.561155836833257 | | Rectangular | 8.8287905991992 | 0.507264438825676 | | Triangular | 8.69261997422583 | 0.592528234724743 | | Biweight | 8.70396752630695 | 0.581379743528299 | | Cosine | 8.70396752630695 | 0.58844948560548 | | Optcosine | 8.70396752630695 | 0.5676231331402 |
\begin{tabular}{lllllllll}
\hline
Maximum Density Values \tabularnewline
Kernel & x-value & max. density \tabularnewline
Gaussian & 8.70396752630695 & 0.625720544327268 \tabularnewline
Epanechnikov & 8.70396752630695 & 0.561155836833257 \tabularnewline
Rectangular & 8.8287905991992 & 0.507264438825676 \tabularnewline
Triangular & 8.69261997422583 & 0.592528234724743 \tabularnewline
Biweight & 8.70396752630695 & 0.581379743528299 \tabularnewline
Cosine & 8.70396752630695 & 0.58844948560548 \tabularnewline
Optcosine & 8.70396752630695 & 0.5676231331402 \tabularnewline
 \hline
\end{tabular}
%Source: https://freestatistics.org/blog/index.php?pk=170413&T=40
[TABLE]
[ROW][C]Maximum Density Values[/C][/ROW]
[ROW][C]Kernel[/C][C]x-value[/C][C]max. density[/C][/ROW]
[ROW][C]Gaussian[/C][C]8.70396752630695[/C][C]0.625720544327268[/C][/ROW]
[ROW][C]Epanechnikov[/C][C]8.70396752630695[/C][C]0.561155836833257[/C][/ROW]
[ROW][C]Rectangular[/C][C]8.8287905991992[/C][C]0.507264438825676[/C][/ROW]
[ROW][C]Triangular[/C][C]8.69261997422583[/C][C]0.592528234724743[/C][/ROW]
[ROW][C]Biweight[/C][C]8.70396752630695[/C][C]0.581379743528299[/C][/ROW]
[ROW][C]Cosine[/C][C]8.70396752630695[/C][C]0.58844948560548[/C][/ROW]
[ROW][C]Optcosine[/C][C]8.70396752630695[/C][C]0.5676231331402[/C][/ROW]
 [/TABLE]
Source: https://freestatistics.org/blog/index.php?pk=170413&T=40
Globally Unique Identifier (entire table): ba.freestatistics.org/blog/index.php?pk=170413&T=40
As an alternative you can also use a QR Code:
The GUIDs for individual cells are displayed in the table below:
| Maximum Density Values | | Kernel | x-value | max. density | | Gaussian | 8.70396752630695 | 0.625720544327268 | | Epanechnikov | 8.70396752630695 | 0.561155836833257 | | Rectangular | 8.8287905991992 | 0.507264438825676 | | Triangular | 8.69261997422583 | 0.592528234724743 | | Biweight | 8.70396752630695 | 0.581379743528299 | | Cosine | 8.70396752630695 | 0.58844948560548 | | Optcosine | 8.70396752630695 | 0.5676231331402 |
If you paste this QR Code into your document, anyone with a smartphone or tablet will be able to scan it and view this table in a browser.
If you paste this QR Code into your document, anyone with a smartphone or tablet will be able to scan it and view this table in a browser.
If you paste this QR Code into your document, anyone with a smartphone or tablet will be able to scan it and view this table in a browser.
If you paste this QR Code into your document, anyone with a smartphone or tablet will be able to scan it and view this table in a browser.
If you paste this QR Code into your document, anyone with a smartphone or tablet will be able to scan it and view this table in a browser.
| Maximum Density Values | | Kernel | x-value | max. density | | Gaussian | 8.70396752630695 | 0.625720544327268 | | Epanechnikov | 8.70396752630695 | 0.561155836833257 | | Rectangular | 8.84013815128031 | 0.507264438825676 | | Triangular | 8.69261997422583 | 0.592528234724743 | | Biweight | 8.70396752630695 | 0.581379743528299 | | Cosine | 8.70396752630695 | 0.58844948560548 | | Optcosine | 8.70396752630695 | 0.5676231331402 |
\begin{tabular}{lllllllll}
\hline
Maximum Density Values \tabularnewline
Kernel & x-value & max. density \tabularnewline
Gaussian & 8.70396752630695 & 0.625720544327268 \tabularnewline
Epanechnikov & 8.70396752630695 & 0.561155836833257 \tabularnewline
Rectangular & 8.84013815128031 & 0.507264438825676 \tabularnewline
Triangular & 8.69261997422583 & 0.592528234724743 \tabularnewline
Biweight & 8.70396752630695 & 0.581379743528299 \tabularnewline
Cosine & 8.70396752630695 & 0.58844948560548 \tabularnewline
Optcosine & 8.70396752630695 & 0.5676231331402 \tabularnewline
 \hline
\end{tabular}
%Source: https://freestatistics.org/blog/index.php?pk=170413&T=41
[TABLE]
[ROW][C]Maximum Density Values[/C][/ROW]
[ROW][C]Kernel[/C][C]x-value[/C][C]max. density[/C][/ROW]
[ROW][C]Gaussian[/C][C]8.70396752630695[/C][C]0.625720544327268[/C][/ROW]
[ROW][C]Epanechnikov[/C][C]8.70396752630695[/C][C]0.561155836833257[/C][/ROW]
[ROW][C]Rectangular[/C][C]8.84013815128031[/C][C]0.507264438825676[/C][/ROW]
[ROW][C]Triangular[/C][C]8.69261997422583[/C][C]0.592528234724743[/C][/ROW]
[ROW][C]Biweight[/C][C]8.70396752630695[/C][C]0.581379743528299[/C][/ROW]
[ROW][C]Cosine[/C][C]8.70396752630695[/C][C]0.58844948560548[/C][/ROW]
[ROW][C]Optcosine[/C][C]8.70396752630695[/C][C]0.5676231331402[/C][/ROW]
 [/TABLE]
Source: https://freestatistics.org/blog/index.php?pk=170413&T=41
Globally Unique Identifier (entire table): ba.freestatistics.org/blog/index.php?pk=170413&T=41
As an alternative you can also use a QR Code:
The GUIDs for individual cells are displayed in the table below:
| Maximum Density Values | | Kernel | x-value | max. density | | Gaussian | 8.70396752630695 | 0.625720544327268 | | Epanechnikov | 8.70396752630695 | 0.561155836833257 | | Rectangular | 8.84013815128031 | 0.507264438825676 | | Triangular | 8.69261997422583 | 0.592528234724743 | | Biweight | 8.70396752630695 | 0.581379743528299 | | Cosine | 8.70396752630695 | 0.58844948560548 | | Optcosine | 8.70396752630695 | 0.5676231331402 |
If you paste this QR Code into your document, anyone with a smartphone or tablet will be able to scan it and view this table in a browser.
If you paste this QR Code into your document, anyone with a smartphone or tablet will be able to scan it and view this table in a browser.
If you paste this QR Code into your document, anyone with a smartphone or tablet will be able to scan it and view this table in a browser.
If you paste this QR Code into your document, anyone with a smartphone or tablet will be able to scan it and view this table in a browser.
If you paste this QR Code into your document, anyone with a smartphone or tablet will be able to scan it and view this table in a browser.
| Maximum Density Values | | Kernel | x-value | max. density | | Gaussian | 8.70396752630695 | 0.625720544327268 | | Epanechnikov | 8.70396752630695 | 0.561155836833257 | | Rectangular | 8.85148570336142 | 0.507264438825676 | | Triangular | 8.69261997422583 | 0.592528234724743 | | Biweight | 8.70396752630695 | 0.581379743528299 | | Cosine | 8.70396752630695 | 0.58844948560548 | | Optcosine | 8.70396752630695 | 0.5676231331402 |
\begin{tabular}{lllllllll}
\hline
Maximum Density Values \tabularnewline
Kernel & x-value & max. density \tabularnewline
Gaussian & 8.70396752630695 & 0.625720544327268 \tabularnewline
Epanechnikov & 8.70396752630695 & 0.561155836833257 \tabularnewline
Rectangular & 8.85148570336142 & 0.507264438825676 \tabularnewline
Triangular & 8.69261997422583 & 0.592528234724743 \tabularnewline
Biweight & 8.70396752630695 & 0.581379743528299 \tabularnewline
Cosine & 8.70396752630695 & 0.58844948560548 \tabularnewline
Optcosine & 8.70396752630695 & 0.5676231331402 \tabularnewline
 \hline
\end{tabular}
%Source: https://freestatistics.org/blog/index.php?pk=170413&T=42
[TABLE]
[ROW][C]Maximum Density Values[/C][/ROW]
[ROW][C]Kernel[/C][C]x-value[/C][C]max. density[/C][/ROW]
[ROW][C]Gaussian[/C][C]8.70396752630695[/C][C]0.625720544327268[/C][/ROW]
[ROW][C]Epanechnikov[/C][C]8.70396752630695[/C][C]0.561155836833257[/C][/ROW]
[ROW][C]Rectangular[/C][C]8.85148570336142[/C][C]0.507264438825676[/C][/ROW]
[ROW][C]Triangular[/C][C]8.69261997422583[/C][C]0.592528234724743[/C][/ROW]
[ROW][C]Biweight[/C][C]8.70396752630695[/C][C]0.581379743528299[/C][/ROW]
[ROW][C]Cosine[/C][C]8.70396752630695[/C][C]0.58844948560548[/C][/ROW]
[ROW][C]Optcosine[/C][C]8.70396752630695[/C][C]0.5676231331402[/C][/ROW]
 [/TABLE]
Source: https://freestatistics.org/blog/index.php?pk=170413&T=42
Globally Unique Identifier (entire table): ba.freestatistics.org/blog/index.php?pk=170413&T=42
As an alternative you can also use a QR Code:
The GUIDs for individual cells are displayed in the table below:
| Maximum Density Values | | Kernel | x-value | max. density | | Gaussian | 8.70396752630695 | 0.625720544327268 | | Epanechnikov | 8.70396752630695 | 0.561155836833257 | | Rectangular | 8.85148570336142 | 0.507264438825676 | | Triangular | 8.69261997422583 | 0.592528234724743 | | Biweight | 8.70396752630695 | 0.581379743528299 | | Cosine | 8.70396752630695 | 0.58844948560548 | | Optcosine | 8.70396752630695 | 0.5676231331402 |
If you paste this QR Code into your document, anyone with a smartphone or tablet will be able to scan it and view this table in a browser.
If you paste this QR Code into your document, anyone with a smartphone or tablet will be able to scan it and view this table in a browser.
If you paste this QR Code into your document, anyone with a smartphone or tablet will be able to scan it and view this table in a browser.
If you paste this QR Code into your document, anyone with a smartphone or tablet will be able to scan it and view this table in a browser.
If you paste this QR Code into your document, anyone with a smartphone or tablet will be able to scan it and view this table in a browser.
| Maximum Density Values | | Kernel | x-value | max. density | | Gaussian | 8.70396752630695 | 0.625720544327268 | | Epanechnikov | 8.70396752630695 | 0.561155836833257 | | Rectangular | 8.86283325544254 | 0.507264438825676 | | Triangular | 8.69261997422583 | 0.592528234724743 | | Biweight | 8.70396752630695 | 0.581379743528299 | | Cosine | 8.70396752630695 | 0.58844948560548 | | Optcosine | 8.70396752630695 | 0.5676231331402 |
\begin{tabular}{lllllllll}
\hline
Maximum Density Values \tabularnewline
Kernel & x-value & max. density \tabularnewline
Gaussian & 8.70396752630695 & 0.625720544327268 \tabularnewline
Epanechnikov & 8.70396752630695 & 0.561155836833257 \tabularnewline
Rectangular & 8.86283325544254 & 0.507264438825676 \tabularnewline
Triangular & 8.69261997422583 & 0.592528234724743 \tabularnewline
Biweight & 8.70396752630695 & 0.581379743528299 \tabularnewline
Cosine & 8.70396752630695 & 0.58844948560548 \tabularnewline
Optcosine & 8.70396752630695 & 0.5676231331402 \tabularnewline
 \hline
\end{tabular}
%Source: https://freestatistics.org/blog/index.php?pk=170413&T=43
[TABLE]
[ROW][C]Maximum Density Values[/C][/ROW]
[ROW][C]Kernel[/C][C]x-value[/C][C]max. density[/C][/ROW]
[ROW][C]Gaussian[/C][C]8.70396752630695[/C][C]0.625720544327268[/C][/ROW]
[ROW][C]Epanechnikov[/C][C]8.70396752630695[/C][C]0.561155836833257[/C][/ROW]
[ROW][C]Rectangular[/C][C]8.86283325544254[/C][C]0.507264438825676[/C][/ROW]
[ROW][C]Triangular[/C][C]8.69261997422583[/C][C]0.592528234724743[/C][/ROW]
[ROW][C]Biweight[/C][C]8.70396752630695[/C][C]0.581379743528299[/C][/ROW]
[ROW][C]Cosine[/C][C]8.70396752630695[/C][C]0.58844948560548[/C][/ROW]
[ROW][C]Optcosine[/C][C]8.70396752630695[/C][C]0.5676231331402[/C][/ROW]
 [/TABLE]
Source: https://freestatistics.org/blog/index.php?pk=170413&T=43
Globally Unique Identifier (entire table): ba.freestatistics.org/blog/index.php?pk=170413&T=43
As an alternative you can also use a QR Code:
The GUIDs for individual cells are displayed in the table below:
| Maximum Density Values | | Kernel | x-value | max. density | | Gaussian | 8.70396752630695 | 0.625720544327268 | | Epanechnikov | 8.70396752630695 | 0.561155836833257 | | Rectangular | 8.86283325544254 | 0.507264438825676 | | Triangular | 8.69261997422583 | 0.592528234724743 | | Biweight | 8.70396752630695 | 0.581379743528299 | | Cosine | 8.70396752630695 | 0.58844948560548 | | Optcosine | 8.70396752630695 | 0.5676231331402 |
If you paste this QR Code into your document, anyone with a smartphone or tablet will be able to scan it and view this table in a browser.
If you paste this QR Code into your document, anyone with a smartphone or tablet will be able to scan it and view this table in a browser.
If you paste this QR Code into your document, anyone with a smartphone or tablet will be able to scan it and view this table in a browser.
If you paste this QR Code into your document, anyone with a smartphone or tablet will be able to scan it and view this table in a browser.
If you paste this QR Code into your document, anyone with a smartphone or tablet will be able to scan it and view this table in a browser.
| Maximum Density Values | | Kernel | x-value | max. density | | Gaussian | 8.70396752630695 | 0.625720544327268 | | Epanechnikov | 8.70396752630695 | 0.561155836833257 | | Rectangular | 8.87418080752365 | 0.507264438825676 | | Triangular | 8.69261997422583 | 0.592528234724743 | | Biweight | 8.70396752630695 | 0.581379743528299 | | Cosine | 8.70396752630695 | 0.58844948560548 | | Optcosine | 8.70396752630695 | 0.5676231331402 |
\begin{tabular}{lllllllll}
\hline
Maximum Density Values \tabularnewline
Kernel & x-value & max. density \tabularnewline
Gaussian & 8.70396752630695 & 0.625720544327268 \tabularnewline
Epanechnikov & 8.70396752630695 & 0.561155836833257 \tabularnewline
Rectangular & 8.87418080752365 & 0.507264438825676 \tabularnewline
Triangular & 8.69261997422583 & 0.592528234724743 \tabularnewline
Biweight & 8.70396752630695 & 0.581379743528299 \tabularnewline
Cosine & 8.70396752630695 & 0.58844948560548 \tabularnewline
Optcosine & 8.70396752630695 & 0.5676231331402 \tabularnewline
 \hline
\end{tabular}
%Source: https://freestatistics.org/blog/index.php?pk=170413&T=44
[TABLE]
[ROW][C]Maximum Density Values[/C][/ROW]
[ROW][C]Kernel[/C][C]x-value[/C][C]max. density[/C][/ROW]
[ROW][C]Gaussian[/C][C]8.70396752630695[/C][C]0.625720544327268[/C][/ROW]
[ROW][C]Epanechnikov[/C][C]8.70396752630695[/C][C]0.561155836833257[/C][/ROW]
[ROW][C]Rectangular[/C][C]8.87418080752365[/C][C]0.507264438825676[/C][/ROW]
[ROW][C]Triangular[/C][C]8.69261997422583[/C][C]0.592528234724743[/C][/ROW]
[ROW][C]Biweight[/C][C]8.70396752630695[/C][C]0.581379743528299[/C][/ROW]
[ROW][C]Cosine[/C][C]8.70396752630695[/C][C]0.58844948560548[/C][/ROW]
[ROW][C]Optcosine[/C][C]8.70396752630695[/C][C]0.5676231331402[/C][/ROW]
 [/TABLE]
Source: https://freestatistics.org/blog/index.php?pk=170413&T=44
Globally Unique Identifier (entire table): ba.freestatistics.org/blog/index.php?pk=170413&T=44
As an alternative you can also use a QR Code:
The GUIDs for individual cells are displayed in the table below:
| Maximum Density Values | | Kernel | x-value | max. density | | Gaussian | 8.70396752630695 | 0.625720544327268 | | Epanechnikov | 8.70396752630695 | 0.561155836833257 | | Rectangular | 8.87418080752365 | 0.507264438825676 | | Triangular | 8.69261997422583 | 0.592528234724743 | | Biweight | 8.70396752630695 | 0.581379743528299 | | Cosine | 8.70396752630695 | 0.58844948560548 | | Optcosine | 8.70396752630695 | 0.5676231331402 |
If you paste this QR Code into your document, anyone with a smartphone or tablet will be able to scan it and view this table in a browser.
If you paste this QR Code into your document, anyone with a smartphone or tablet will be able to scan it and view this table in a browser.
If you paste this QR Code into your document, anyone with a smartphone or tablet will be able to scan it and view this table in a browser.
If you paste this QR Code into your document, anyone with a smartphone or tablet will be able to scan it and view this table in a browser.
If you paste this QR Code into your document, anyone with a smartphone or tablet will be able to scan it and view this table in a browser.
| Maximum Density Values | | Kernel | x-value | max. density | | Gaussian | 8.70396752630695 | 0.625720544327268 | | Epanechnikov | 8.70396752630695 | 0.561155836833257 | | Rectangular | 8.88552835960476 | 0.507264438825676 | | Triangular | 8.69261997422583 | 0.592528234724743 | | Biweight | 8.70396752630695 | 0.581379743528299 | | Cosine | 8.70396752630695 | 0.58844948560548 | | Optcosine | 8.70396752630695 | 0.5676231331402 |
\begin{tabular}{lllllllll}
\hline
Maximum Density Values \tabularnewline
Kernel & x-value & max. density \tabularnewline
Gaussian & 8.70396752630695 & 0.625720544327268 \tabularnewline
Epanechnikov & 8.70396752630695 & 0.561155836833257 \tabularnewline
Rectangular & 8.88552835960476 & 0.507264438825676 \tabularnewline
Triangular & 8.69261997422583 & 0.592528234724743 \tabularnewline
Biweight & 8.70396752630695 & 0.581379743528299 \tabularnewline
Cosine & 8.70396752630695 & 0.58844948560548 \tabularnewline
Optcosine & 8.70396752630695 & 0.5676231331402 \tabularnewline
 \hline
\end{tabular}
%Source: https://freestatistics.org/blog/index.php?pk=170413&T=45
[TABLE]
[ROW][C]Maximum Density Values[/C][/ROW]
[ROW][C]Kernel[/C][C]x-value[/C][C]max. density[/C][/ROW]
[ROW][C]Gaussian[/C][C]8.70396752630695[/C][C]0.625720544327268[/C][/ROW]
[ROW][C]Epanechnikov[/C][C]8.70396752630695[/C][C]0.561155836833257[/C][/ROW]
[ROW][C]Rectangular[/C][C]8.88552835960476[/C][C]0.507264438825676[/C][/ROW]
[ROW][C]Triangular[/C][C]8.69261997422583[/C][C]0.592528234724743[/C][/ROW]
[ROW][C]Biweight[/C][C]8.70396752630695[/C][C]0.581379743528299[/C][/ROW]
[ROW][C]Cosine[/C][C]8.70396752630695[/C][C]0.58844948560548[/C][/ROW]
[ROW][C]Optcosine[/C][C]8.70396752630695[/C][C]0.5676231331402[/C][/ROW]
 [/TABLE]
Source: https://freestatistics.org/blog/index.php?pk=170413&T=45
Globally Unique Identifier (entire table): ba.freestatistics.org/blog/index.php?pk=170413&T=45
As an alternative you can also use a QR Code:
The GUIDs for individual cells are displayed in the table below:
| Maximum Density Values | | Kernel | x-value | max. density | | Gaussian | 8.70396752630695 | 0.625720544327268 | | Epanechnikov | 8.70396752630695 | 0.561155836833257 | | Rectangular | 8.88552835960476 | 0.507264438825676 | | Triangular | 8.69261997422583 | 0.592528234724743 | | Biweight | 8.70396752630695 | 0.581379743528299 | | Cosine | 8.70396752630695 | 0.58844948560548 | | Optcosine | 8.70396752630695 | 0.5676231331402 |
If you paste this QR Code into your document, anyone with a smartphone or tablet will be able to scan it and view this table in a browser.
If you paste this QR Code into your document, anyone with a smartphone or tablet will be able to scan it and view this table in a browser.
If you paste this QR Code into your document, anyone with a smartphone or tablet will be able to scan it and view this table in a browser.
If you paste this QR Code into your document, anyone with a smartphone or tablet will be able to scan it and view this table in a browser.
If you paste this QR Code into your document, anyone with a smartphone or tablet will be able to scan it and view this table in a browser.
| Maximum Density Values | | Kernel | x-value | max. density | | Gaussian | 8.70396752630695 | 0.625720544327268 | | Epanechnikov | 8.70396752630695 | 0.561155836833257 | | Rectangular | 8.89687591168588 | 0.507264438825676 | | Triangular | 8.69261997422583 | 0.592528234724743 | | Biweight | 8.70396752630695 | 0.581379743528299 | | Cosine | 8.70396752630695 | 0.58844948560548 | | Optcosine | 8.70396752630695 | 0.5676231331402 |
\begin{tabular}{lllllllll}
\hline
Maximum Density Values \tabularnewline
Kernel & x-value & max. density \tabularnewline
Gaussian & 8.70396752630695 & 0.625720544327268 \tabularnewline
Epanechnikov & 8.70396752630695 & 0.561155836833257 \tabularnewline
Rectangular & 8.89687591168588 & 0.507264438825676 \tabularnewline
Triangular & 8.69261997422583 & 0.592528234724743 \tabularnewline
Biweight & 8.70396752630695 & 0.581379743528299 \tabularnewline
Cosine & 8.70396752630695 & 0.58844948560548 \tabularnewline
Optcosine & 8.70396752630695 & 0.5676231331402 \tabularnewline
 \hline
\end{tabular}
%Source: https://freestatistics.org/blog/index.php?pk=170413&T=46
[TABLE]
[ROW][C]Maximum Density Values[/C][/ROW]
[ROW][C]Kernel[/C][C]x-value[/C][C]max. density[/C][/ROW]
[ROW][C]Gaussian[/C][C]8.70396752630695[/C][C]0.625720544327268[/C][/ROW]
[ROW][C]Epanechnikov[/C][C]8.70396752630695[/C][C]0.561155836833257[/C][/ROW]
[ROW][C]Rectangular[/C][C]8.89687591168588[/C][C]0.507264438825676[/C][/ROW]
[ROW][C]Triangular[/C][C]8.69261997422583[/C][C]0.592528234724743[/C][/ROW]
[ROW][C]Biweight[/C][C]8.70396752630695[/C][C]0.581379743528299[/C][/ROW]
[ROW][C]Cosine[/C][C]8.70396752630695[/C][C]0.58844948560548[/C][/ROW]
[ROW][C]Optcosine[/C][C]8.70396752630695[/C][C]0.5676231331402[/C][/ROW]
 [/TABLE]
Source: https://freestatistics.org/blog/index.php?pk=170413&T=46
Globally Unique Identifier (entire table): ba.freestatistics.org/blog/index.php?pk=170413&T=46
As an alternative you can also use a QR Code:
The GUIDs for individual cells are displayed in the table below:
| Maximum Density Values | | Kernel | x-value | max. density | | Gaussian | 8.70396752630695 | 0.625720544327268 | | Epanechnikov | 8.70396752630695 | 0.561155836833257 | | Rectangular | 8.89687591168588 | 0.507264438825676 | | Triangular | 8.69261997422583 | 0.592528234724743 | | Biweight | 8.70396752630695 | 0.581379743528299 | | Cosine | 8.70396752630695 | 0.58844948560548 | | Optcosine | 8.70396752630695 | 0.5676231331402 |
If you paste this QR Code into your document, anyone with a smartphone or tablet will be able to scan it and view this table in a browser.
If you paste this QR Code into your document, anyone with a smartphone or tablet will be able to scan it and view this table in a browser.
If you paste this QR Code into your document, anyone with a smartphone or tablet will be able to scan it and view this table in a browser.
If you paste this QR Code into your document, anyone with a smartphone or tablet will be able to scan it and view this table in a browser.
If you paste this QR Code into your document, anyone with a smartphone or tablet will be able to scan it and view this table in a browser.
| Maximum Density Values | | Kernel | x-value | max. density | | Gaussian | 8.70396752630695 | 0.625720544327268 | | Epanechnikov | 8.70396752630695 | 0.561155836833257 | | Rectangular | 8.90822346376699 | 0.507264438825676 | | Triangular | 8.69261997422583 | 0.592528234724743 | | Biweight | 8.70396752630695 | 0.581379743528299 | | Cosine | 8.70396752630695 | 0.58844948560548 | | Optcosine | 8.70396752630695 | 0.5676231331402 |
\begin{tabular}{lllllllll}
\hline
Maximum Density Values \tabularnewline
Kernel & x-value & max. density \tabularnewline
Gaussian & 8.70396752630695 & 0.625720544327268 \tabularnewline
Epanechnikov & 8.70396752630695 & 0.561155836833257 \tabularnewline
Rectangular & 8.90822346376699 & 0.507264438825676 \tabularnewline
Triangular & 8.69261997422583 & 0.592528234724743 \tabularnewline
Biweight & 8.70396752630695 & 0.581379743528299 \tabularnewline
Cosine & 8.70396752630695 & 0.58844948560548 \tabularnewline
Optcosine & 8.70396752630695 & 0.5676231331402 \tabularnewline
 \hline
\end{tabular}
%Source: https://freestatistics.org/blog/index.php?pk=170413&T=47
[TABLE]
[ROW][C]Maximum Density Values[/C][/ROW]
[ROW][C]Kernel[/C][C]x-value[/C][C]max. density[/C][/ROW]
[ROW][C]Gaussian[/C][C]8.70396752630695[/C][C]0.625720544327268[/C][/ROW]
[ROW][C]Epanechnikov[/C][C]8.70396752630695[/C][C]0.561155836833257[/C][/ROW]
[ROW][C]Rectangular[/C][C]8.90822346376699[/C][C]0.507264438825676[/C][/ROW]
[ROW][C]Triangular[/C][C]8.69261997422583[/C][C]0.592528234724743[/C][/ROW]
[ROW][C]Biweight[/C][C]8.70396752630695[/C][C]0.581379743528299[/C][/ROW]
[ROW][C]Cosine[/C][C]8.70396752630695[/C][C]0.58844948560548[/C][/ROW]
[ROW][C]Optcosine[/C][C]8.70396752630695[/C][C]0.5676231331402[/C][/ROW]
 [/TABLE]
Source: https://freestatistics.org/blog/index.php?pk=170413&T=47
Globally Unique Identifier (entire table): ba.freestatistics.org/blog/index.php?pk=170413&T=47
As an alternative you can also use a QR Code:
The GUIDs for individual cells are displayed in the table below:
| Maximum Density Values | | Kernel | x-value | max. density | | Gaussian | 8.70396752630695 | 0.625720544327268 | | Epanechnikov | 8.70396752630695 | 0.561155836833257 | | Rectangular | 8.90822346376699 | 0.507264438825676 | | Triangular | 8.69261997422583 | 0.592528234724743 | | Biweight | 8.70396752630695 | 0.581379743528299 | | Cosine | 8.70396752630695 | 0.58844948560548 | | Optcosine | 8.70396752630695 | 0.5676231331402 |
If you paste this QR Code into your document, anyone with a smartphone or tablet will be able to scan it and view this table in a browser.
If you paste this QR Code into your document, anyone with a smartphone or tablet will be able to scan it and view this table in a browser.
If you paste this QR Code into your document, anyone with a smartphone or tablet will be able to scan it and view this table in a browser.
If you paste this QR Code into your document, anyone with a smartphone or tablet will be able to scan it and view this table in a browser.
If you paste this QR Code into your document, anyone with a smartphone or tablet will be able to scan it and view this table in a browser.
| Maximum Density Values | | Kernel | x-value | max. density | | Gaussian | 8.70396752630695 | 0.625720544327268 | | Epanechnikov | 8.70396752630695 | 0.561155836833257 | | Rectangular | 8.9195710158481 | 0.507264438825676 | | Triangular | 8.69261997422583 | 0.592528234724743 | | Biweight | 8.70396752630695 | 0.581379743528299 | | Cosine | 8.70396752630695 | 0.58844948560548 | | Optcosine | 8.70396752630695 | 0.5676231331402 |
\begin{tabular}{lllllllll}
\hline
Maximum Density Values \tabularnewline
Kernel & x-value & max. density \tabularnewline
Gaussian & 8.70396752630695 & 0.625720544327268 \tabularnewline
Epanechnikov & 8.70396752630695 & 0.561155836833257 \tabularnewline
Rectangular & 8.9195710158481 & 0.507264438825676 \tabularnewline
Triangular & 8.69261997422583 & 0.592528234724743 \tabularnewline
Biweight & 8.70396752630695 & 0.581379743528299 \tabularnewline
Cosine & 8.70396752630695 & 0.58844948560548 \tabularnewline
Optcosine & 8.70396752630695 & 0.5676231331402 \tabularnewline
 \hline
\end{tabular}
%Source: https://freestatistics.org/blog/index.php?pk=170413&T=48
[TABLE]
[ROW][C]Maximum Density Values[/C][/ROW]
[ROW][C]Kernel[/C][C]x-value[/C][C]max. density[/C][/ROW]
[ROW][C]Gaussian[/C][C]8.70396752630695[/C][C]0.625720544327268[/C][/ROW]
[ROW][C]Epanechnikov[/C][C]8.70396752630695[/C][C]0.561155836833257[/C][/ROW]
[ROW][C]Rectangular[/C][C]8.9195710158481[/C][C]0.507264438825676[/C][/ROW]
[ROW][C]Triangular[/C][C]8.69261997422583[/C][C]0.592528234724743[/C][/ROW]
[ROW][C]Biweight[/C][C]8.70396752630695[/C][C]0.581379743528299[/C][/ROW]
[ROW][C]Cosine[/C][C]8.70396752630695[/C][C]0.58844948560548[/C][/ROW]
[ROW][C]Optcosine[/C][C]8.70396752630695[/C][C]0.5676231331402[/C][/ROW]
 [/TABLE]
Source: https://freestatistics.org/blog/index.php?pk=170413&T=48
Globally Unique Identifier (entire table): ba.freestatistics.org/blog/index.php?pk=170413&T=48
As an alternative you can also use a QR Code:
The GUIDs for individual cells are displayed in the table below:
| Maximum Density Values | | Kernel | x-value | max. density | | Gaussian | 8.70396752630695 | 0.625720544327268 | | Epanechnikov | 8.70396752630695 | 0.561155836833257 | | Rectangular | 8.9195710158481 | 0.507264438825676 | | Triangular | 8.69261997422583 | 0.592528234724743 | | Biweight | 8.70396752630695 | 0.581379743528299 | | Cosine | 8.70396752630695 | 0.58844948560548 | | Optcosine | 8.70396752630695 | 0.5676231331402 |
If you paste this QR Code into your document, anyone with a smartphone or tablet will be able to scan it and view this table in a browser.
If you paste this QR Code into your document, anyone with a smartphone or tablet will be able to scan it and view this table in a browser.
If you paste this QR Code into your document, anyone with a smartphone or tablet will be able to scan it and view this table in a browser.
If you paste this QR Code into your document, anyone with a smartphone or tablet will be able to scan it and view this table in a browser.
If you paste this QR Code into your document, anyone with a smartphone or tablet will be able to scan it and view this table in a browser.
| Maximum Density Values | | Kernel | x-value | max. density | | Gaussian | 8.70396752630695 | 0.625720544327268 | | Epanechnikov | 8.70396752630695 | 0.561155836833257 | | Rectangular | 8.93091856792922 | 0.507264438825676 | | Triangular | 8.69261997422583 | 0.592528234724743 | | Biweight | 8.70396752630695 | 0.581379743528299 | | Cosine | 8.70396752630695 | 0.58844948560548 | | Optcosine | 8.70396752630695 | 0.5676231331402 |
\begin{tabular}{lllllllll}
\hline
Maximum Density Values \tabularnewline
Kernel & x-value & max. density \tabularnewline
Gaussian & 8.70396752630695 & 0.625720544327268 \tabularnewline
Epanechnikov & 8.70396752630695 & 0.561155836833257 \tabularnewline
Rectangular & 8.93091856792922 & 0.507264438825676 \tabularnewline
Triangular & 8.69261997422583 & 0.592528234724743 \tabularnewline
Biweight & 8.70396752630695 & 0.581379743528299 \tabularnewline
Cosine & 8.70396752630695 & 0.58844948560548 \tabularnewline
Optcosine & 8.70396752630695 & 0.5676231331402 \tabularnewline
 \hline
\end{tabular}
%Source: https://freestatistics.org/blog/index.php?pk=170413&T=49
[TABLE]
[ROW][C]Maximum Density Values[/C][/ROW]
[ROW][C]Kernel[/C][C]x-value[/C][C]max. density[/C][/ROW]
[ROW][C]Gaussian[/C][C]8.70396752630695[/C][C]0.625720544327268[/C][/ROW]
[ROW][C]Epanechnikov[/C][C]8.70396752630695[/C][C]0.561155836833257[/C][/ROW]
[ROW][C]Rectangular[/C][C]8.93091856792922[/C][C]0.507264438825676[/C][/ROW]
[ROW][C]Triangular[/C][C]8.69261997422583[/C][C]0.592528234724743[/C][/ROW]
[ROW][C]Biweight[/C][C]8.70396752630695[/C][C]0.581379743528299[/C][/ROW]
[ROW][C]Cosine[/C][C]8.70396752630695[/C][C]0.58844948560548[/C][/ROW]
[ROW][C]Optcosine[/C][C]8.70396752630695[/C][C]0.5676231331402[/C][/ROW]
 [/TABLE]
Source: https://freestatistics.org/blog/index.php?pk=170413&T=49
Globally Unique Identifier (entire table): ba.freestatistics.org/blog/index.php?pk=170413&T=49
As an alternative you can also use a QR Code:
The GUIDs for individual cells are displayed in the table below:
| Maximum Density Values | | Kernel | x-value | max. density | | Gaussian | 8.70396752630695 | 0.625720544327268 | | Epanechnikov | 8.70396752630695 | 0.561155836833257 | | Rectangular | 8.93091856792922 | 0.507264438825676 | | Triangular | 8.69261997422583 | 0.592528234724743 | | Biweight | 8.70396752630695 | 0.581379743528299 | | Cosine | 8.70396752630695 | 0.58844948560548 | | Optcosine | 8.70396752630695 | 0.5676231331402 |
If you paste this QR Code into your document, anyone with a smartphone or tablet will be able to scan it and view this table in a browser.
If you paste this QR Code into your document, anyone with a smartphone or tablet will be able to scan it and view this table in a browser.
If you paste this QR Code into your document, anyone with a smartphone or tablet will be able to scan it and view this table in a browser.
If you paste this QR Code into your document, anyone with a smartphone or tablet will be able to scan it and view this table in a browser.
If you paste this QR Code into your document, anyone with a smartphone or tablet will be able to scan it and view this table in a browser.
| Maximum Density Values | | Kernel | x-value | max. density | | Gaussian | 8.70396752630695 | 0.625720544327268 | | Epanechnikov | 8.70396752630695 | 0.561155836833257 | | Rectangular | 8.94226612001033 | 0.507264438825676 | | Triangular | 8.69261997422583 | 0.592528234724743 | | Biweight | 8.70396752630695 | 0.581379743528299 | | Cosine | 8.70396752630695 | 0.58844948560548 | | Optcosine | 8.70396752630695 | 0.5676231331402 |
\begin{tabular}{lllllllll}
\hline
Maximum Density Values \tabularnewline
Kernel & x-value & max. density \tabularnewline
Gaussian & 8.70396752630695 & 0.625720544327268 \tabularnewline
Epanechnikov & 8.70396752630695 & 0.561155836833257 \tabularnewline
Rectangular & 8.94226612001033 & 0.507264438825676 \tabularnewline
Triangular & 8.69261997422583 & 0.592528234724743 \tabularnewline
Biweight & 8.70396752630695 & 0.581379743528299 \tabularnewline
Cosine & 8.70396752630695 & 0.58844948560548 \tabularnewline
Optcosine & 8.70396752630695 & 0.5676231331402 \tabularnewline
 \hline
\end{tabular}
%Source: https://freestatistics.org/blog/index.php?pk=170413&T=50
[TABLE]
[ROW][C]Maximum Density Values[/C][/ROW]
[ROW][C]Kernel[/C][C]x-value[/C][C]max. density[/C][/ROW]
[ROW][C]Gaussian[/C][C]8.70396752630695[/C][C]0.625720544327268[/C][/ROW]
[ROW][C]Epanechnikov[/C][C]8.70396752630695[/C][C]0.561155836833257[/C][/ROW]
[ROW][C]Rectangular[/C][C]8.94226612001033[/C][C]0.507264438825676[/C][/ROW]
[ROW][C]Triangular[/C][C]8.69261997422583[/C][C]0.592528234724743[/C][/ROW]
[ROW][C]Biweight[/C][C]8.70396752630695[/C][C]0.581379743528299[/C][/ROW]
[ROW][C]Cosine[/C][C]8.70396752630695[/C][C]0.58844948560548[/C][/ROW]
[ROW][C]Optcosine[/C][C]8.70396752630695[/C][C]0.5676231331402[/C][/ROW]
 [/TABLE]
Source: https://freestatistics.org/blog/index.php?pk=170413&T=50
Globally Unique Identifier (entire table): ba.freestatistics.org/blog/index.php?pk=170413&T=50
As an alternative you can also use a QR Code:
The GUIDs for individual cells are displayed in the table below:
| Maximum Density Values | | Kernel | x-value | max. density | | Gaussian | 8.70396752630695 | 0.625720544327268 | | Epanechnikov | 8.70396752630695 | 0.561155836833257 | | Rectangular | 8.94226612001033 | 0.507264438825676 | | Triangular | 8.69261997422583 | 0.592528234724743 | | Biweight | 8.70396752630695 | 0.581379743528299 | | Cosine | 8.70396752630695 | 0.58844948560548 | | Optcosine | 8.70396752630695 | 0.5676231331402 |
If you paste this QR Code into your document, anyone with a smartphone or tablet will be able to scan it and view this table in a browser.
If you paste this QR Code into your document, anyone with a smartphone or tablet will be able to scan it and view this table in a browser.
If you paste this QR Code into your document, anyone with a smartphone or tablet will be able to scan it and view this table in a browser.
If you paste this QR Code into your document, anyone with a smartphone or tablet will be able to scan it and view this table in a browser.
If you paste this QR Code into your document, anyone with a smartphone or tablet will be able to scan it and view this table in a browser.
| Maximum Density Values | | Kernel | x-value | max. density | | Gaussian | 8.70396752630695 | 0.625720544327268 | | Epanechnikov | 8.70396752630695 | 0.561155836833257 | | Rectangular | 8.95361367209144 | 0.507264438825676 | | Triangular | 8.69261997422583 | 0.592528234724743 | | Biweight | 8.70396752630695 | 0.581379743528299 | | Cosine | 8.70396752630695 | 0.58844948560548 | | Optcosine | 8.70396752630695 | 0.5676231331402 |
\begin{tabular}{lllllllll}
\hline
Maximum Density Values \tabularnewline
Kernel & x-value & max. density \tabularnewline
Gaussian & 8.70396752630695 & 0.625720544327268 \tabularnewline
Epanechnikov & 8.70396752630695 & 0.561155836833257 \tabularnewline
Rectangular & 8.95361367209144 & 0.507264438825676 \tabularnewline
Triangular & 8.69261997422583 & 0.592528234724743 \tabularnewline
Biweight & 8.70396752630695 & 0.581379743528299 \tabularnewline
Cosine & 8.70396752630695 & 0.58844948560548 \tabularnewline
Optcosine & 8.70396752630695 & 0.5676231331402 \tabularnewline
 \hline
\end{tabular}
%Source: https://freestatistics.org/blog/index.php?pk=170413&T=51
[TABLE]
[ROW][C]Maximum Density Values[/C][/ROW]
[ROW][C]Kernel[/C][C]x-value[/C][C]max. density[/C][/ROW]
[ROW][C]Gaussian[/C][C]8.70396752630695[/C][C]0.625720544327268[/C][/ROW]
[ROW][C]Epanechnikov[/C][C]8.70396752630695[/C][C]0.561155836833257[/C][/ROW]
[ROW][C]Rectangular[/C][C]8.95361367209144[/C][C]0.507264438825676[/C][/ROW]
[ROW][C]Triangular[/C][C]8.69261997422583[/C][C]0.592528234724743[/C][/ROW]
[ROW][C]Biweight[/C][C]8.70396752630695[/C][C]0.581379743528299[/C][/ROW]
[ROW][C]Cosine[/C][C]8.70396752630695[/C][C]0.58844948560548[/C][/ROW]
[ROW][C]Optcosine[/C][C]8.70396752630695[/C][C]0.5676231331402[/C][/ROW]
 [/TABLE]
Source: https://freestatistics.org/blog/index.php?pk=170413&T=51
Globally Unique Identifier (entire table): ba.freestatistics.org/blog/index.php?pk=170413&T=51
As an alternative you can also use a QR Code:
The GUIDs for individual cells are displayed in the table below:
| Maximum Density Values | | Kernel | x-value | max. density | | Gaussian | 8.70396752630695 | 0.625720544327268 | | Epanechnikov | 8.70396752630695 | 0.561155836833257 | | Rectangular | 8.95361367209144 | 0.507264438825676 | | Triangular | 8.69261997422583 | 0.592528234724743 | | Biweight | 8.70396752630695 | 0.581379743528299 | | Cosine | 8.70396752630695 | 0.58844948560548 | | Optcosine | 8.70396752630695 | 0.5676231331402 |
If you paste this QR Code into your document, anyone with a smartphone or tablet will be able to scan it and view this table in a browser.
If you paste this QR Code into your document, anyone with a smartphone or tablet will be able to scan it and view this table in a browser.
If you paste this QR Code into your document, anyone with a smartphone or tablet will be able to scan it and view this table in a browser.
If you paste this QR Code into your document, anyone with a smartphone or tablet will be able to scan it and view this table in a browser.
If you paste this QR Code into your document, anyone with a smartphone or tablet will be able to scan it and view this table in a browser.
| Maximum Density Values | | Kernel | x-value | max. density | | Gaussian | 8.70396752630695 | 0.625720544327268 | | Epanechnikov | 8.70396752630695 | 0.561155836833257 | | Rectangular | 8.96496122417256 | 0.507264438825676 | | Triangular | 8.69261997422583 | 0.592528234724743 | | Biweight | 8.70396752630695 | 0.581379743528299 | | Cosine | 8.70396752630695 | 0.58844948560548 | | Optcosine | 8.70396752630695 | 0.5676231331402 |
\begin{tabular}{lllllllll}
\hline
Maximum Density Values \tabularnewline
Kernel & x-value & max. density \tabularnewline
Gaussian & 8.70396752630695 & 0.625720544327268 \tabularnewline
Epanechnikov & 8.70396752630695 & 0.561155836833257 \tabularnewline
Rectangular & 8.96496122417256 & 0.507264438825676 \tabularnewline
Triangular & 8.69261997422583 & 0.592528234724743 \tabularnewline
Biweight & 8.70396752630695 & 0.581379743528299 \tabularnewline
Cosine & 8.70396752630695 & 0.58844948560548 \tabularnewline
Optcosine & 8.70396752630695 & 0.5676231331402 \tabularnewline
 \hline
\end{tabular}
%Source: https://freestatistics.org/blog/index.php?pk=170413&T=52
[TABLE]
[ROW][C]Maximum Density Values[/C][/ROW]
[ROW][C]Kernel[/C][C]x-value[/C][C]max. density[/C][/ROW]
[ROW][C]Gaussian[/C][C]8.70396752630695[/C][C]0.625720544327268[/C][/ROW]
[ROW][C]Epanechnikov[/C][C]8.70396752630695[/C][C]0.561155836833257[/C][/ROW]
[ROW][C]Rectangular[/C][C]8.96496122417256[/C][C]0.507264438825676[/C][/ROW]
[ROW][C]Triangular[/C][C]8.69261997422583[/C][C]0.592528234724743[/C][/ROW]
[ROW][C]Biweight[/C][C]8.70396752630695[/C][C]0.581379743528299[/C][/ROW]
[ROW][C]Cosine[/C][C]8.70396752630695[/C][C]0.58844948560548[/C][/ROW]
[ROW][C]Optcosine[/C][C]8.70396752630695[/C][C]0.5676231331402[/C][/ROW]
 [/TABLE]
Source: https://freestatistics.org/blog/index.php?pk=170413&T=52
Globally Unique Identifier (entire table): ba.freestatistics.org/blog/index.php?pk=170413&T=52
As an alternative you can also use a QR Code:
The GUIDs for individual cells are displayed in the table below:
| Maximum Density Values | | Kernel | x-value | max. density | | Gaussian | 8.70396752630695 | 0.625720544327268 | | Epanechnikov | 8.70396752630695 | 0.561155836833257 | | Rectangular | 8.96496122417256 | 0.507264438825676 | | Triangular | 8.69261997422583 | 0.592528234724743 | | Biweight | 8.70396752630695 | 0.581379743528299 | | Cosine | 8.70396752630695 | 0.58844948560548 | | Optcosine | 8.70396752630695 | 0.5676231331402 |
If you paste this QR Code into your document, anyone with a smartphone or tablet will be able to scan it and view this table in a browser.
If you paste this QR Code into your document, anyone with a smartphone or tablet will be able to scan it and view this table in a browser.
If you paste this QR Code into your document, anyone with a smartphone or tablet will be able to scan it and view this table in a browser.
If you paste this QR Code into your document, anyone with a smartphone or tablet will be able to scan it and view this table in a browser.
If you paste this QR Code into your document, anyone with a smartphone or tablet will be able to scan it and view this table in a browser.
| Maximum Density Values | | Kernel | x-value | max. density | | Gaussian | 8.70396752630695 | 0.625720544327268 | | Epanechnikov | 8.70396752630695 | 0.561155836833257 | | Rectangular | 8.97630877625367 | 0.507264438825676 | | Triangular | 8.69261997422583 | 0.592528234724743 | | Biweight | 8.70396752630695 | 0.581379743528299 | | Cosine | 8.70396752630695 | 0.58844948560548 | | Optcosine | 8.70396752630695 | 0.5676231331402 |
\begin{tabular}{lllllllll}
\hline
Maximum Density Values \tabularnewline
Kernel & x-value & max. density \tabularnewline
Gaussian & 8.70396752630695 & 0.625720544327268 \tabularnewline
Epanechnikov & 8.70396752630695 & 0.561155836833257 \tabularnewline
Rectangular & 8.97630877625367 & 0.507264438825676 \tabularnewline
Triangular & 8.69261997422583 & 0.592528234724743 \tabularnewline
Biweight & 8.70396752630695 & 0.581379743528299 \tabularnewline
Cosine & 8.70396752630695 & 0.58844948560548 \tabularnewline
Optcosine & 8.70396752630695 & 0.5676231331402 \tabularnewline
 \hline
\end{tabular}
%Source: https://freestatistics.org/blog/index.php?pk=170413&T=53
[TABLE]
[ROW][C]Maximum Density Values[/C][/ROW]
[ROW][C]Kernel[/C][C]x-value[/C][C]max. density[/C][/ROW]
[ROW][C]Gaussian[/C][C]8.70396752630695[/C][C]0.625720544327268[/C][/ROW]
[ROW][C]Epanechnikov[/C][C]8.70396752630695[/C][C]0.561155836833257[/C][/ROW]
[ROW][C]Rectangular[/C][C]8.97630877625367[/C][C]0.507264438825676[/C][/ROW]
[ROW][C]Triangular[/C][C]8.69261997422583[/C][C]0.592528234724743[/C][/ROW]
[ROW][C]Biweight[/C][C]8.70396752630695[/C][C]0.581379743528299[/C][/ROW]
[ROW][C]Cosine[/C][C]8.70396752630695[/C][C]0.58844948560548[/C][/ROW]
[ROW][C]Optcosine[/C][C]8.70396752630695[/C][C]0.5676231331402[/C][/ROW]
 [/TABLE]
Source: https://freestatistics.org/blog/index.php?pk=170413&T=53
Globally Unique Identifier (entire table): ba.freestatistics.org/blog/index.php?pk=170413&T=53
As an alternative you can also use a QR Code:
The GUIDs for individual cells are displayed in the table below:
| Maximum Density Values | | Kernel | x-value | max. density | | Gaussian | 8.70396752630695 | 0.625720544327268 | | Epanechnikov | 8.70396752630695 | 0.561155836833257 | | Rectangular | 8.97630877625367 | 0.507264438825676 | | Triangular | 8.69261997422583 | 0.592528234724743 | | Biweight | 8.70396752630695 | 0.581379743528299 | | Cosine | 8.70396752630695 | 0.58844948560548 | | Optcosine | 8.70396752630695 | 0.5676231331402 |
If you paste this QR Code into your document, anyone with a smartphone or tablet will be able to scan it and view this table in a browser.
If you paste this QR Code into your document, anyone with a smartphone or tablet will be able to scan it and view this table in a browser.
If you paste this QR Code into your document, anyone with a smartphone or tablet will be able to scan it and view this table in a browser.
If you paste this QR Code into your document, anyone with a smartphone or tablet will be able to scan it and view this table in a browser.
If you paste this QR Code into your document, anyone with a smartphone or tablet will be able to scan it and view this table in a browser.
| Maximum Density Values | | Kernel | x-value | max. density | | Gaussian | 8.70396752630695 | 0.625720544327268 | | Epanechnikov | 8.70396752630695 | 0.561155836833257 | | Rectangular | 8.98765632833478 | 0.507264438825676 | | Triangular | 8.69261997422583 | 0.592528234724743 | | Biweight | 8.70396752630695 | 0.581379743528299 | | Cosine | 8.70396752630695 | 0.58844948560548 | | Optcosine | 8.70396752630695 | 0.5676231331402 |
\begin{tabular}{lllllllll}
\hline
Maximum Density Values \tabularnewline
Kernel & x-value & max. density \tabularnewline
Gaussian & 8.70396752630695 & 0.625720544327268 \tabularnewline
Epanechnikov & 8.70396752630695 & 0.561155836833257 \tabularnewline
Rectangular & 8.98765632833478 & 0.507264438825676 \tabularnewline
Triangular & 8.69261997422583 & 0.592528234724743 \tabularnewline
Biweight & 8.70396752630695 & 0.581379743528299 \tabularnewline
Cosine & 8.70396752630695 & 0.58844948560548 \tabularnewline
Optcosine & 8.70396752630695 & 0.5676231331402 \tabularnewline
 \hline
\end{tabular}
%Source: https://freestatistics.org/blog/index.php?pk=170413&T=54
[TABLE]
[ROW][C]Maximum Density Values[/C][/ROW]
[ROW][C]Kernel[/C][C]x-value[/C][C]max. density[/C][/ROW]
[ROW][C]Gaussian[/C][C]8.70396752630695[/C][C]0.625720544327268[/C][/ROW]
[ROW][C]Epanechnikov[/C][C]8.70396752630695[/C][C]0.561155836833257[/C][/ROW]
[ROW][C]Rectangular[/C][C]8.98765632833478[/C][C]0.507264438825676[/C][/ROW]
[ROW][C]Triangular[/C][C]8.69261997422583[/C][C]0.592528234724743[/C][/ROW]
[ROW][C]Biweight[/C][C]8.70396752630695[/C][C]0.581379743528299[/C][/ROW]
[ROW][C]Cosine[/C][C]8.70396752630695[/C][C]0.58844948560548[/C][/ROW]
[ROW][C]Optcosine[/C][C]8.70396752630695[/C][C]0.5676231331402[/C][/ROW]
 [/TABLE]
Source: https://freestatistics.org/blog/index.php?pk=170413&T=54
Globally Unique Identifier (entire table): ba.freestatistics.org/blog/index.php?pk=170413&T=54
As an alternative you can also use a QR Code:
The GUIDs for individual cells are displayed in the table below:
| Maximum Density Values | | Kernel | x-value | max. density | | Gaussian | 8.70396752630695 | 0.625720544327268 | | Epanechnikov | 8.70396752630695 | 0.561155836833257 | | Rectangular | 8.98765632833478 | 0.507264438825676 | | Triangular | 8.69261997422583 | 0.592528234724743 | | Biweight | 8.70396752630695 | 0.581379743528299 | | Cosine | 8.70396752630695 | 0.58844948560548 | | Optcosine | 8.70396752630695 | 0.5676231331402 |
If you paste this QR Code into your document, anyone with a smartphone or tablet will be able to scan it and view this table in a browser.
If you paste this QR Code into your document, anyone with a smartphone or tablet will be able to scan it and view this table in a browser.
If you paste this QR Code into your document, anyone with a smartphone or tablet will be able to scan it and view this table in a browser.
If you paste this QR Code into your document, anyone with a smartphone or tablet will be able to scan it and view this table in a browser.
If you paste this QR Code into your document, anyone with a smartphone or tablet will be able to scan it and view this table in a browser.
| Maximum Density Values | | Kernel | x-value | max. density | | Gaussian | 8.70396752630695 | 0.625720544327268 | | Epanechnikov | 8.70396752630695 | 0.561155836833257 | | Rectangular | 8.9990038804159 | 0.507264438825676 | | Triangular | 8.69261997422583 | 0.592528234724743 | | Biweight | 8.70396752630695 | 0.581379743528299 | | Cosine | 8.70396752630695 | 0.58844948560548 | | Optcosine | 8.70396752630695 | 0.5676231331402 |
\begin{tabular}{lllllllll}
\hline
Maximum Density Values \tabularnewline
Kernel & x-value & max. density \tabularnewline
Gaussian & 8.70396752630695 & 0.625720544327268 \tabularnewline
Epanechnikov & 8.70396752630695 & 0.561155836833257 \tabularnewline
Rectangular & 8.9990038804159 & 0.507264438825676 \tabularnewline
Triangular & 8.69261997422583 & 0.592528234724743 \tabularnewline
Biweight & 8.70396752630695 & 0.581379743528299 \tabularnewline
Cosine & 8.70396752630695 & 0.58844948560548 \tabularnewline
Optcosine & 8.70396752630695 & 0.5676231331402 \tabularnewline
 \hline
\end{tabular}
%Source: https://freestatistics.org/blog/index.php?pk=170413&T=55
[TABLE]
[ROW][C]Maximum Density Values[/C][/ROW]
[ROW][C]Kernel[/C][C]x-value[/C][C]max. density[/C][/ROW]
[ROW][C]Gaussian[/C][C]8.70396752630695[/C][C]0.625720544327268[/C][/ROW]
[ROW][C]Epanechnikov[/C][C]8.70396752630695[/C][C]0.561155836833257[/C][/ROW]
[ROW][C]Rectangular[/C][C]8.9990038804159[/C][C]0.507264438825676[/C][/ROW]
[ROW][C]Triangular[/C][C]8.69261997422583[/C][C]0.592528234724743[/C][/ROW]
[ROW][C]Biweight[/C][C]8.70396752630695[/C][C]0.581379743528299[/C][/ROW]
[ROW][C]Cosine[/C][C]8.70396752630695[/C][C]0.58844948560548[/C][/ROW]
[ROW][C]Optcosine[/C][C]8.70396752630695[/C][C]0.5676231331402[/C][/ROW]
 [/TABLE]
Source: https://freestatistics.org/blog/index.php?pk=170413&T=55
Globally Unique Identifier (entire table): ba.freestatistics.org/blog/index.php?pk=170413&T=55
As an alternative you can also use a QR Code:
The GUIDs for individual cells are displayed in the table below:
| Maximum Density Values | | Kernel | x-value | max. density | | Gaussian | 8.70396752630695 | 0.625720544327268 | | Epanechnikov | 8.70396752630695 | 0.561155836833257 | | Rectangular | 8.9990038804159 | 0.507264438825676 | | Triangular | 8.69261997422583 | 0.592528234724743 | | Biweight | 8.70396752630695 | 0.581379743528299 | | Cosine | 8.70396752630695 | 0.58844948560548 | | Optcosine | 8.70396752630695 | 0.5676231331402 |
If you paste this QR Code into your document, anyone with a smartphone or tablet will be able to scan it and view this table in a browser.
If you paste this QR Code into your document, anyone with a smartphone or tablet will be able to scan it and view this table in a browser.
If you paste this QR Code into your document, anyone with a smartphone or tablet will be able to scan it and view this table in a browser.
If you paste this QR Code into your document, anyone with a smartphone or tablet will be able to scan it and view this table in a browser.
If you paste this QR Code into your document, anyone with a smartphone or tablet will be able to scan it and view this table in a browser.
| Maximum Density Values | | Kernel | x-value | max. density | | Gaussian | 8.70396752630695 | 0.625720544327268 | | Epanechnikov | 8.70396752630695 | 0.561155836833257 | | Rectangular | 9.01035143249701 | 0.507264438825676 | | Triangular | 8.69261997422583 | 0.592528234724743 | | Biweight | 8.70396752630695 | 0.581379743528299 | | Cosine | 8.70396752630695 | 0.58844948560548 | | Optcosine | 8.70396752630695 | 0.5676231331402 |
\begin{tabular}{lllllllll}
\hline
Maximum Density Values \tabularnewline
Kernel & x-value & max. density \tabularnewline
Gaussian & 8.70396752630695 & 0.625720544327268 \tabularnewline
Epanechnikov & 8.70396752630695 & 0.561155836833257 \tabularnewline
Rectangular & 9.01035143249701 & 0.507264438825676 \tabularnewline
Triangular & 8.69261997422583 & 0.592528234724743 \tabularnewline
Biweight & 8.70396752630695 & 0.581379743528299 \tabularnewline
Cosine & 8.70396752630695 & 0.58844948560548 \tabularnewline
Optcosine & 8.70396752630695 & 0.5676231331402 \tabularnewline
 \hline
\end{tabular}
%Source: https://freestatistics.org/blog/index.php?pk=170413&T=56
[TABLE]
[ROW][C]Maximum Density Values[/C][/ROW]
[ROW][C]Kernel[/C][C]x-value[/C][C]max. density[/C][/ROW]
[ROW][C]Gaussian[/C][C]8.70396752630695[/C][C]0.625720544327268[/C][/ROW]
[ROW][C]Epanechnikov[/C][C]8.70396752630695[/C][C]0.561155836833257[/C][/ROW]
[ROW][C]Rectangular[/C][C]9.01035143249701[/C][C]0.507264438825676[/C][/ROW]
[ROW][C]Triangular[/C][C]8.69261997422583[/C][C]0.592528234724743[/C][/ROW]
[ROW][C]Biweight[/C][C]8.70396752630695[/C][C]0.581379743528299[/C][/ROW]
[ROW][C]Cosine[/C][C]8.70396752630695[/C][C]0.58844948560548[/C][/ROW]
[ROW][C]Optcosine[/C][C]8.70396752630695[/C][C]0.5676231331402[/C][/ROW]
 [/TABLE]
Source: https://freestatistics.org/blog/index.php?pk=170413&T=56
Globally Unique Identifier (entire table): ba.freestatistics.org/blog/index.php?pk=170413&T=56
As an alternative you can also use a QR Code:
The GUIDs for individual cells are displayed in the table below:
| Maximum Density Values | | Kernel | x-value | max. density | | Gaussian | 8.70396752630695 | 0.625720544327268 | | Epanechnikov | 8.70396752630695 | 0.561155836833257 | | Rectangular | 9.01035143249701 | 0.507264438825676 | | Triangular | 8.69261997422583 | 0.592528234724743 | | Biweight | 8.70396752630695 | 0.581379743528299 | | Cosine | 8.70396752630695 | 0.58844948560548 | | Optcosine | 8.70396752630695 | 0.5676231331402 |
If you paste this QR Code into your document, anyone with a smartphone or tablet will be able to scan it and view this table in a browser.
If you paste this QR Code into your document, anyone with a smartphone or tablet will be able to scan it and view this table in a browser.
If you paste this QR Code into your document, anyone with a smartphone or tablet will be able to scan it and view this table in a browser.
If you paste this QR Code into your document, anyone with a smartphone or tablet will be able to scan it and view this table in a browser.
If you paste this QR Code into your document, anyone with a smartphone or tablet will be able to scan it and view this table in a browser.
| Maximum Density Values | | Kernel | x-value | max. density | | Gaussian | 8.70396752630695 | 0.625720544327268 | | Epanechnikov | 8.70396752630695 | 0.561155836833257 | | Rectangular | 9.02169898457812 | 0.507264438825676 | | Triangular | 8.69261997422583 | 0.592528234724743 | | Biweight | 8.70396752630695 | 0.581379743528299 | | Cosine | 8.70396752630695 | 0.58844948560548 | | Optcosine | 8.70396752630695 | 0.5676231331402 |
\begin{tabular}{lllllllll}
\hline
Maximum Density Values \tabularnewline
Kernel & x-value & max. density \tabularnewline
Gaussian & 8.70396752630695 & 0.625720544327268 \tabularnewline
Epanechnikov & 8.70396752630695 & 0.561155836833257 \tabularnewline
Rectangular & 9.02169898457812 & 0.507264438825676 \tabularnewline
Triangular & 8.69261997422583 & 0.592528234724743 \tabularnewline
Biweight & 8.70396752630695 & 0.581379743528299 \tabularnewline
Cosine & 8.70396752630695 & 0.58844948560548 \tabularnewline
Optcosine & 8.70396752630695 & 0.5676231331402 \tabularnewline
 \hline
\end{tabular}
%Source: https://freestatistics.org/blog/index.php?pk=170413&T=57
[TABLE]
[ROW][C]Maximum Density Values[/C][/ROW]
[ROW][C]Kernel[/C][C]x-value[/C][C]max. density[/C][/ROW]
[ROW][C]Gaussian[/C][C]8.70396752630695[/C][C]0.625720544327268[/C][/ROW]
[ROW][C]Epanechnikov[/C][C]8.70396752630695[/C][C]0.561155836833257[/C][/ROW]
[ROW][C]Rectangular[/C][C]9.02169898457812[/C][C]0.507264438825676[/C][/ROW]
[ROW][C]Triangular[/C][C]8.69261997422583[/C][C]0.592528234724743[/C][/ROW]
[ROW][C]Biweight[/C][C]8.70396752630695[/C][C]0.581379743528299[/C][/ROW]
[ROW][C]Cosine[/C][C]8.70396752630695[/C][C]0.58844948560548[/C][/ROW]
[ROW][C]Optcosine[/C][C]8.70396752630695[/C][C]0.5676231331402[/C][/ROW]
 [/TABLE]
Source: https://freestatistics.org/blog/index.php?pk=170413&T=57
Globally Unique Identifier (entire table): ba.freestatistics.org/blog/index.php?pk=170413&T=57
As an alternative you can also use a QR Code:
The GUIDs for individual cells are displayed in the table below:
| Maximum Density Values | | Kernel | x-value | max. density | | Gaussian | 8.70396752630695 | 0.625720544327268 | | Epanechnikov | 8.70396752630695 | 0.561155836833257 | | Rectangular | 9.02169898457812 | 0.507264438825676 | | Triangular | 8.69261997422583 | 0.592528234724743 | | Biweight | 8.70396752630695 | 0.581379743528299 | | Cosine | 8.70396752630695 | 0.58844948560548 | | Optcosine | 8.70396752630695 | 0.5676231331402 |
If you paste this QR Code into your document, anyone with a smartphone or tablet will be able to scan it and view this table in a browser.
If you paste this QR Code into your document, anyone with a smartphone or tablet will be able to scan it and view this table in a browser.
If you paste this QR Code into your document, anyone with a smartphone or tablet will be able to scan it and view this table in a browser.
If you paste this QR Code into your document, anyone with a smartphone or tablet will be able to scan it and view this table in a browser.
If you paste this QR Code into your document, anyone with a smartphone or tablet will be able to scan it and view this table in a browser.
| Maximum Density Values | | Kernel | x-value | max. density | | Gaussian | 8.70396752630695 | 0.625720544327268 | | Epanechnikov | 8.70396752630695 | 0.561155836833257 | | Rectangular | 9.03304653665924 | 0.507264438825676 | | Triangular | 8.69261997422583 | 0.592528234724743 | | Biweight | 8.70396752630695 | 0.581379743528299 | | Cosine | 8.70396752630695 | 0.58844948560548 | | Optcosine | 8.70396752630695 | 0.5676231331402 |
\begin{tabular}{lllllllll}
\hline
Maximum Density Values \tabularnewline
Kernel & x-value & max. density \tabularnewline
Gaussian & 8.70396752630695 & 0.625720544327268 \tabularnewline
Epanechnikov & 8.70396752630695 & 0.561155836833257 \tabularnewline
Rectangular & 9.03304653665924 & 0.507264438825676 \tabularnewline
Triangular & 8.69261997422583 & 0.592528234724743 \tabularnewline
Biweight & 8.70396752630695 & 0.581379743528299 \tabularnewline
Cosine & 8.70396752630695 & 0.58844948560548 \tabularnewline
Optcosine & 8.70396752630695 & 0.5676231331402 \tabularnewline
 \hline
\end{tabular}
%Source: https://freestatistics.org/blog/index.php?pk=170413&T=58
[TABLE]
[ROW][C]Maximum Density Values[/C][/ROW]
[ROW][C]Kernel[/C][C]x-value[/C][C]max. density[/C][/ROW]
[ROW][C]Gaussian[/C][C]8.70396752630695[/C][C]0.625720544327268[/C][/ROW]
[ROW][C]Epanechnikov[/C][C]8.70396752630695[/C][C]0.561155836833257[/C][/ROW]
[ROW][C]Rectangular[/C][C]9.03304653665924[/C][C]0.507264438825676[/C][/ROW]
[ROW][C]Triangular[/C][C]8.69261997422583[/C][C]0.592528234724743[/C][/ROW]
[ROW][C]Biweight[/C][C]8.70396752630695[/C][C]0.581379743528299[/C][/ROW]
[ROW][C]Cosine[/C][C]8.70396752630695[/C][C]0.58844948560548[/C][/ROW]
[ROW][C]Optcosine[/C][C]8.70396752630695[/C][C]0.5676231331402[/C][/ROW]
 [/TABLE]
Source: https://freestatistics.org/blog/index.php?pk=170413&T=58
Globally Unique Identifier (entire table): ba.freestatistics.org/blog/index.php?pk=170413&T=58
As an alternative you can also use a QR Code:
The GUIDs for individual cells are displayed in the table below:
| Maximum Density Values | | Kernel | x-value | max. density | | Gaussian | 8.70396752630695 | 0.625720544327268 | | Epanechnikov | 8.70396752630695 | 0.561155836833257 | | Rectangular | 9.03304653665924 | 0.507264438825676 | | Triangular | 8.69261997422583 | 0.592528234724743 | | Biweight | 8.70396752630695 | 0.581379743528299 | | Cosine | 8.70396752630695 | 0.58844948560548 | | Optcosine | 8.70396752630695 | 0.5676231331402 |
If you paste this QR Code into your document, anyone with a smartphone or tablet will be able to scan it and view this table in a browser.
If you paste this QR Code into your document, anyone with a smartphone or tablet will be able to scan it and view this table in a browser.
If you paste this QR Code into your document, anyone with a smartphone or tablet will be able to scan it and view this table in a browser.
If you paste this QR Code into your document, anyone with a smartphone or tablet will be able to scan it and view this table in a browser.
If you paste this QR Code into your document, anyone with a smartphone or tablet will be able to scan it and view this table in a browser.
| Maximum Density Values | | Kernel | x-value | max. density | | Gaussian | 8.70396752630695 | 0.625720544327268 | | Epanechnikov | 8.70396752630695 | 0.561155836833257 | | Rectangular | 9.04439408874035 | 0.507264438825676 | | Triangular | 8.69261997422583 | 0.592528234724743 | | Biweight | 8.70396752630695 | 0.581379743528299 | | Cosine | 8.70396752630695 | 0.58844948560548 | | Optcosine | 8.70396752630695 | 0.5676231331402 |
\begin{tabular}{lllllllll}
\hline
Maximum Density Values \tabularnewline
Kernel & x-value & max. density \tabularnewline
Gaussian & 8.70396752630695 & 0.625720544327268 \tabularnewline
Epanechnikov & 8.70396752630695 & 0.561155836833257 \tabularnewline
Rectangular & 9.04439408874035 & 0.507264438825676 \tabularnewline
Triangular & 8.69261997422583 & 0.592528234724743 \tabularnewline
Biweight & 8.70396752630695 & 0.581379743528299 \tabularnewline
Cosine & 8.70396752630695 & 0.58844948560548 \tabularnewline
Optcosine & 8.70396752630695 & 0.5676231331402 \tabularnewline
\hline
\end{tabular}
%Source: https://freestatistics.org/blog/index.php?pk=170413&T=59
[TABLE]
[ROW][C]Maximum Density Values[/C][/ROW]
[ROW][C]Kernel[/C][C]x-value[/C][C]max. density[/C][/ROW]
[ROW][C]Gaussian[/C][C]8.70396752630695[/C][C]0.625720544327268[/C][/ROW]
[ROW][C]Epanechnikov[/C][C]8.70396752630695[/C][C]0.561155836833257[/C][/ROW]
[ROW][C]Rectangular[/C][C]9.04439408874035[/C][C]0.507264438825676[/C][/ROW]
[ROW][C]Triangular[/C][C]8.69261997422583[/C][C]0.592528234724743[/C][/ROW]
[ROW][C]Biweight[/C][C]8.70396752630695[/C][C]0.581379743528299[/C][/ROW]
[ROW][C]Cosine[/C][C]8.70396752630695[/C][C]0.58844948560548[/C][/ROW]
[ROW][C]Optcosine[/C][C]8.70396752630695[/C][C]0.5676231331402[/C][/ROW]
[/TABLE]
Source: https://freestatistics.org/blog/index.php?pk=170413&T=59
Globally Unique Identifier (entire table): ba.freestatistics.org/blog/index.php?pk=170413&T=59
As an alternative you can also use a QR Code:
The GUIDs for individual cells are displayed in the table below:
| Maximum Density Values | | Kernel | x-value | max. density | | Gaussian | 8.70396752630695 | 0.625720544327268 | | Epanechnikov | 8.70396752630695 | 0.561155836833257 | | Rectangular | 9.04439408874035 | 0.507264438825676 | | Triangular | 8.69261997422583 | 0.592528234724743 | | Biweight | 8.70396752630695 | 0.581379743528299 | | Cosine | 8.70396752630695 | 0.58844948560548 | | Optcosine | 8.70396752630695 | 0.5676231331402 |
If you paste this QR Code into your document, anyone with a smartphone or tablet will be able to scan it and view this table in a browser.
If you paste this QR Code into your document, anyone with a smartphone or tablet will be able to scan it and view this table in a browser.
If you paste this QR Code into your document, anyone with a smartphone or tablet will be able to scan it and view this table in a browser.
If you paste this QR Code into your document, anyone with a smartphone or tablet will be able to scan it and view this table in a browser.
If you paste this QR Code into your document, anyone with a smartphone or tablet will be able to scan it and view this table in a browser.
|