Free Statistics
of Irreproducible Research!
Description of Statistical Computation | |||||||||||||||||||||||||
|---|---|---|---|---|---|---|---|---|---|---|---|---|---|---|---|---|---|---|---|---|---|---|---|---|---|
| Author's title | |||||||||||||||||||||||||
| Author | *Unverified author* | ||||||||||||||||||||||||
| R Software Module | rwasp_sdplot.wasp | ||||||||||||||||||||||||
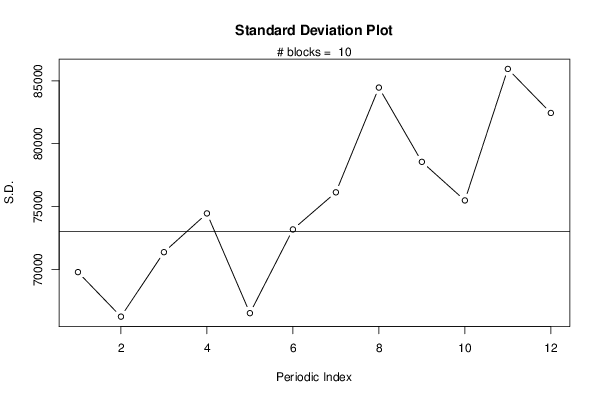
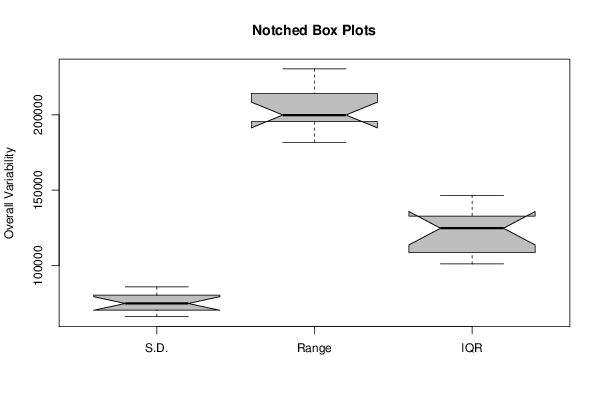
| Title produced by software | Standard Deviation Plot | ||||||||||||||||||||||||
| Date of computation | Thu, 01 Aug 2013 08:43:06 -0400 | ||||||||||||||||||||||||
| Cite this page as follows | Statistical Computations at FreeStatistics.org, Office for Research Development and Education, URL https://freestatistics.org/blog/index.php?v=date/2013/Aug/01/t1375361045s37ibpjtfzgsunh.htm/, Retrieved Sun, 28 Apr 2024 19:21:21 +0000 | ||||||||||||||||||||||||
| Statistical Computations at FreeStatistics.org, Office for Research Development and Education, URL https://freestatistics.org/blog/index.php?pk=210876, Retrieved Sun, 28 Apr 2024 19:21:21 +0000 | |||||||||||||||||||||||||
| QR Codes: | |||||||||||||||||||||||||
|
| |||||||||||||||||||||||||
| Original text written by user: | |||||||||||||||||||||||||
| IsPrivate? | No (this computation is public) | ||||||||||||||||||||||||
| User-defined keywords | Van Camp Stef | ||||||||||||||||||||||||
| Estimated Impact | 169 | ||||||||||||||||||||||||
Tree of Dependent Computations | |||||||||||||||||||||||||
| Family? (F = Feedback message, R = changed R code, M = changed R Module, P = changed Parameters, D = changed Data) | |||||||||||||||||||||||||
| - [Central Tendency] [] [2013-08-01 12:04:45] [6decc077dded9d451dc0be9ee2a4b58b] - RM [Standard Deviation Plot] [] [2013-08-01 12:43:06] [941d89646656d1688f5e273fb31a8e6b] [Current] | |||||||||||||||||||||||||
| Feedback Forum | |||||||||||||||||||||||||
Post a new message | |||||||||||||||||||||||||
Dataset | |||||||||||||||||||||||||
| Dataseries X: | |||||||||||||||||||||||||
69731 68504 67277 64823 89654 88427 69731 57316 58542 58542 59770 62357 54862 47354 41207 41207 64823 67277 48581 27431 38620 38620 47354 52396 51168 38620 44900 42434 63584 58542 38620 23738 37392 41207 44900 49808 39846 31246 34939 36166 68504 68504 49808 47354 54862 51168 61130 73546 76012 58542 53622 48581 82280 84746 78466 84746 83507 73546 84746 97162 102203 87200 77238 84746 117084 127046 124592 129499 128273 115858 137008 142049 149423 127046 118312 128273 152010 173160 168119 168119 170585 161971 184361 184361 180546 159384 163199 165665 181895 203045 188041 195550 189269 185587 214246 207965 199230 186815 199230 205511 213006 222967 213006 219154 211657 210431 241542 244129 234168 216700 231581 237850 245357 256546 245357 254092 250277 236622 265279 265279 | |||||||||||||||||||||||||
Tables (Output of Computation) | |||||||||||||||||||||||||
| |||||||||||||||||||||||||
Figures (Output of Computation) | |||||||||||||||||||||||||
Input Parameters & R Code | |||||||||||||||||||||||||
| Parameters (Session): | |||||||||||||||||||||||||
| Parameters (R input): | |||||||||||||||||||||||||
| par1 = 12 ; | |||||||||||||||||||||||||
| R code (references can be found in the software module): | |||||||||||||||||||||||||
par1 <- as.numeric(par1) | |||||||||||||||||||||||||