Free Statistics

of Irreproducible Research!

Author's title

Author*Unverified author*
R Software Modulerwasp_autocorrelation.wasp
Title produced by software(Partial) Autocorrelation Function
Date of computationSat, 17 Aug 2013 06:08:37 -0400
Cite this page as followsStatistical Computations at FreeStatistics.org, Office for Research Development and Education, URL https://freestatistics.org/blog/index.php?v=date/2013/Aug/17/t1376734142v8rcnyjz0usy9xa.htm/, Retrieved Sun, 28 Apr 2024 20:42:28 +0000
Statistical Computations at FreeStatistics.org, Office for Research Development and Education, URL https://freestatistics.org/blog/index.php?pk=211131, Retrieved Sun, 28 Apr 2024 20:42:28 +0000
QR Codes:

Original text written by user:
IsPrivate?No (this computation is public)
User-defined keywordsDe Laere Dieter
Estimated Impact171
Family? (F = Feedback message, R = changed R code, M = changed R Module, P = changed Parameters, D = changed Data)
-       [(Partial) Autocorrelation Function] [Tijdreeks 1 - Sta...] [2013-08-17 10:08:37] [bc2cf5f41ec5ca561b7a550898b8dd0d] [Current]
Feedback Forum

Post a new message
Dataseries X:
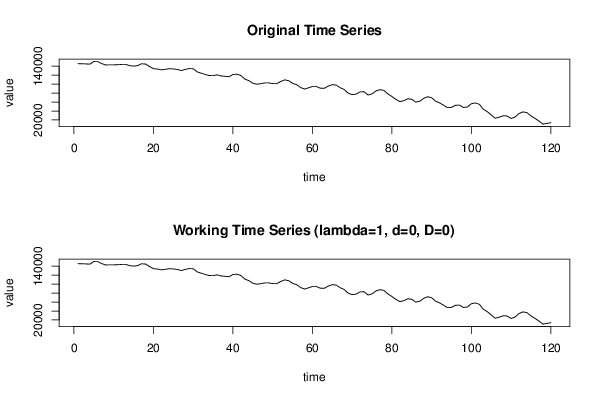
145756
145472
145160
144588
150460
150172
145756
142820
143108
143108
143392
143992
143992
141340
140172
141340
145472
144872
139288
134560
133676
131908
133104
134560
133988
132792
130456
132792
134872
134272
127492
124556
121620
119256
118972
120736
118372
117488
116604
121620
122192
119256
111304
107772
102188
99820
100988
102756
102756
101304
100988
105720
109540
107772
101872
98940
92756
88936
91872
94808
94808
90988
90704
95688
98940
97768
91872
88052
79788
76568
77736
82752
83036
75684
78336
84804
87740
85972
78024
72436
65968
60952
63004
67420
66252
59784
61836
68304
71840
69788
61836
58304
53004
47416
48300
52716
53288
47988
48872
56252
58016
55056
44168
38584
31204
23852
26216
29436
28868
23252
26500
34452
37984
36220
29152
23568
17668
10884
12084
14136


Summary of computational transaction
Raw Inputview raw input (R code)
Raw Outputview raw output of R engine
Computing time3 seconds
R Server'Herman Ole Andreas Wold' @ wold.wessa.net

\begin{tabular}{lllllllll}
\hline
Summary of computational transaction \tabularnewline
Raw Input & view raw input (R code)  \tabularnewline
Raw Output & view raw output of R engine  \tabularnewline
Computing time & 3 seconds \tabularnewline
R Server & 'Herman Ole Andreas Wold' @ wold.wessa.net \tabularnewline
\hline
\end{tabular}
%Source: https://freestatistics.org/blog/index.php?pk=211131&T=0

[TABLE]
[ROW][C]Summary of computational transaction[/C][/ROW]
[ROW][C]Raw Input[/C][C]view raw input (R code) [/C][/ROW]
[ROW][C]Raw Output[/C][C]view raw output of R engine [/C][/ROW]
[ROW][C]Computing time[/C][C]3 seconds[/C][/ROW]
[ROW][C]R Server[/C][C]'Herman Ole Andreas Wold' @ wold.wessa.net[/C][/ROW]
[/TABLE]
Source: https://freestatistics.org/blog/index.php?pk=211131&T=0

Globally Unique Identifier (entire table): ba.freestatistics.org/blog/index.php?pk=211131&T=0

As an alternative you can also use a QR Code:  

The GUIDs for individual cells are displayed in the table below:

Summary of computational transaction
Raw Inputview raw input (R code)
Raw Outputview raw output of R engine
Computing time3 seconds
R Server'Herman Ole Andreas Wold' @ wold.wessa.net


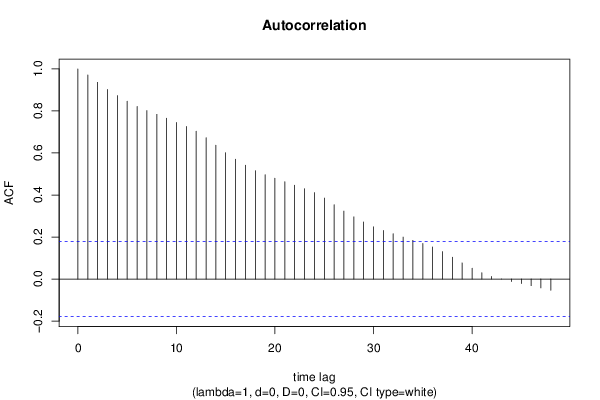
Autocorrelation Function
Time lag kACF(k)T-STATP-value
10.97090510.63570
20.93607910.25420
30.9019589.88050
40.8732699.56620
50.8459979.26740
60.8213678.99760
70.8018738.78410
80.7839968.58820
90.7650768.3810
100.7455148.16670
110.7257927.95070
120.7036077.70760
130.6726687.36870
140.6367776.97550
150.6011326.58510
160.570036.24440
170.5413585.93030
180.5153575.64550
190.4962835.43650
200.4797175.2550
210.4632095.07421e-06
220.4465544.89172e-06
230.4302344.7133e-06
240.4114924.50778e-06
250.3852184.21992.4e-05
260.3537043.87468.7e-05
270.3232973.54150.000284
280.2961373.2440.000763
290.2712682.97160.00179
300.2482872.71980.003751
310.2310612.53110.006331
320.2153682.35920.009964
330.1996892.18750.015323
340.1843412.01940.022839
350.1690781.85220.03323
360.1522971.66830.048929
370.1304681.42920.077771
380.1037621.13670.128973
390.0768880.84230.200656
400.0518560.56810.28553
410.0300650.32930.371235
420.0118450.12980.448488
43-0.000504-0.00550.4978
44-0.011506-0.1260.449957
45-0.02153-0.23590.406974
46-0.031446-0.34450.365548
47-0.042088-0.46110.322797
48-0.053259-0.58340.280352

\begin{tabular}{lllllllll}
\hline
Autocorrelation Function \tabularnewline
Time lag k & ACF(k) & T-STAT & P-value \tabularnewline
1 & 0.970905 & 10.6357 & 0 \tabularnewline
2 & 0.936079 & 10.2542 & 0 \tabularnewline
3 & 0.901958 & 9.8805 & 0 \tabularnewline
4 & 0.873269 & 9.5662 & 0 \tabularnewline
5 & 0.845997 & 9.2674 & 0 \tabularnewline
6 & 0.821367 & 8.9976 & 0 \tabularnewline
7 & 0.801873 & 8.7841 & 0 \tabularnewline
8 & 0.783996 & 8.5882 & 0 \tabularnewline
9 & 0.765076 & 8.381 & 0 \tabularnewline
10 & 0.745514 & 8.1667 & 0 \tabularnewline
11 & 0.725792 & 7.9507 & 0 \tabularnewline
12 & 0.703607 & 7.7076 & 0 \tabularnewline
13 & 0.672668 & 7.3687 & 0 \tabularnewline
14 & 0.636777 & 6.9755 & 0 \tabularnewline
15 & 0.601132 & 6.5851 & 0 \tabularnewline
16 & 0.57003 & 6.2444 & 0 \tabularnewline
17 & 0.541358 & 5.9303 & 0 \tabularnewline
18 & 0.515357 & 5.6455 & 0 \tabularnewline
19 & 0.496283 & 5.4365 & 0 \tabularnewline
20 & 0.479717 & 5.255 & 0 \tabularnewline
21 & 0.463209 & 5.0742 & 1e-06 \tabularnewline
22 & 0.446554 & 4.8917 & 2e-06 \tabularnewline
23 & 0.430234 & 4.713 & 3e-06 \tabularnewline
24 & 0.411492 & 4.5077 & 8e-06 \tabularnewline
25 & 0.385218 & 4.2199 & 2.4e-05 \tabularnewline
26 & 0.353704 & 3.8746 & 8.7e-05 \tabularnewline
27 & 0.323297 & 3.5415 & 0.000284 \tabularnewline
28 & 0.296137 & 3.244 & 0.000763 \tabularnewline
29 & 0.271268 & 2.9716 & 0.00179 \tabularnewline
30 & 0.248287 & 2.7198 & 0.003751 \tabularnewline
31 & 0.231061 & 2.5311 & 0.006331 \tabularnewline
32 & 0.215368 & 2.3592 & 0.009964 \tabularnewline
33 & 0.199689 & 2.1875 & 0.015323 \tabularnewline
34 & 0.184341 & 2.0194 & 0.022839 \tabularnewline
35 & 0.169078 & 1.8522 & 0.03323 \tabularnewline
36 & 0.152297 & 1.6683 & 0.048929 \tabularnewline
37 & 0.130468 & 1.4292 & 0.077771 \tabularnewline
38 & 0.103762 & 1.1367 & 0.128973 \tabularnewline
39 & 0.076888 & 0.8423 & 0.200656 \tabularnewline
40 & 0.051856 & 0.5681 & 0.28553 \tabularnewline
41 & 0.030065 & 0.3293 & 0.371235 \tabularnewline
42 & 0.011845 & 0.1298 & 0.448488 \tabularnewline
43 & -0.000504 & -0.0055 & 0.4978 \tabularnewline
44 & -0.011506 & -0.126 & 0.449957 \tabularnewline
45 & -0.02153 & -0.2359 & 0.406974 \tabularnewline
46 & -0.031446 & -0.3445 & 0.365548 \tabularnewline
47 & -0.042088 & -0.4611 & 0.322797 \tabularnewline
48 & -0.053259 & -0.5834 & 0.280352 \tabularnewline
\hline
\end{tabular}
%Source: https://freestatistics.org/blog/index.php?pk=211131&T=1

[TABLE]
[ROW][C]Autocorrelation Function[/C][/ROW]
[ROW][C]Time lag k[/C][C]ACF(k)[/C][C]T-STAT[/C][C]P-value[/C][/ROW]
[ROW][C]1[/C][C]0.970905[/C][C]10.6357[/C][C]0[/C][/ROW]
[ROW][C]2[/C][C]0.936079[/C][C]10.2542[/C][C]0[/C][/ROW]
[ROW][C]3[/C][C]0.901958[/C][C]9.8805[/C][C]0[/C][/ROW]
[ROW][C]4[/C][C]0.873269[/C][C]9.5662[/C][C]0[/C][/ROW]
[ROW][C]5[/C][C]0.845997[/C][C]9.2674[/C][C]0[/C][/ROW]
[ROW][C]6[/C][C]0.821367[/C][C]8.9976[/C][C]0[/C][/ROW]
[ROW][C]7[/C][C]0.801873[/C][C]8.7841[/C][C]0[/C][/ROW]
[ROW][C]8[/C][C]0.783996[/C][C]8.5882[/C][C]0[/C][/ROW]
[ROW][C]9[/C][C]0.765076[/C][C]8.381[/C][C]0[/C][/ROW]
[ROW][C]10[/C][C]0.745514[/C][C]8.1667[/C][C]0[/C][/ROW]
[ROW][C]11[/C][C]0.725792[/C][C]7.9507[/C][C]0[/C][/ROW]
[ROW][C]12[/C][C]0.703607[/C][C]7.7076[/C][C]0[/C][/ROW]
[ROW][C]13[/C][C]0.672668[/C][C]7.3687[/C][C]0[/C][/ROW]
[ROW][C]14[/C][C]0.636777[/C][C]6.9755[/C][C]0[/C][/ROW]
[ROW][C]15[/C][C]0.601132[/C][C]6.5851[/C][C]0[/C][/ROW]
[ROW][C]16[/C][C]0.57003[/C][C]6.2444[/C][C]0[/C][/ROW]
[ROW][C]17[/C][C]0.541358[/C][C]5.9303[/C][C]0[/C][/ROW]
[ROW][C]18[/C][C]0.515357[/C][C]5.6455[/C][C]0[/C][/ROW]
[ROW][C]19[/C][C]0.496283[/C][C]5.4365[/C][C]0[/C][/ROW]
[ROW][C]20[/C][C]0.479717[/C][C]5.255[/C][C]0[/C][/ROW]
[ROW][C]21[/C][C]0.463209[/C][C]5.0742[/C][C]1e-06[/C][/ROW]
[ROW][C]22[/C][C]0.446554[/C][C]4.8917[/C][C]2e-06[/C][/ROW]
[ROW][C]23[/C][C]0.430234[/C][C]4.713[/C][C]3e-06[/C][/ROW]
[ROW][C]24[/C][C]0.411492[/C][C]4.5077[/C][C]8e-06[/C][/ROW]
[ROW][C]25[/C][C]0.385218[/C][C]4.2199[/C][C]2.4e-05[/C][/ROW]
[ROW][C]26[/C][C]0.353704[/C][C]3.8746[/C][C]8.7e-05[/C][/ROW]
[ROW][C]27[/C][C]0.323297[/C][C]3.5415[/C][C]0.000284[/C][/ROW]
[ROW][C]28[/C][C]0.296137[/C][C]3.244[/C][C]0.000763[/C][/ROW]
[ROW][C]29[/C][C]0.271268[/C][C]2.9716[/C][C]0.00179[/C][/ROW]
[ROW][C]30[/C][C]0.248287[/C][C]2.7198[/C][C]0.003751[/C][/ROW]
[ROW][C]31[/C][C]0.231061[/C][C]2.5311[/C][C]0.006331[/C][/ROW]
[ROW][C]32[/C][C]0.215368[/C][C]2.3592[/C][C]0.009964[/C][/ROW]
[ROW][C]33[/C][C]0.199689[/C][C]2.1875[/C][C]0.015323[/C][/ROW]
[ROW][C]34[/C][C]0.184341[/C][C]2.0194[/C][C]0.022839[/C][/ROW]
[ROW][C]35[/C][C]0.169078[/C][C]1.8522[/C][C]0.03323[/C][/ROW]
[ROW][C]36[/C][C]0.152297[/C][C]1.6683[/C][C]0.048929[/C][/ROW]
[ROW][C]37[/C][C]0.130468[/C][C]1.4292[/C][C]0.077771[/C][/ROW]
[ROW][C]38[/C][C]0.103762[/C][C]1.1367[/C][C]0.128973[/C][/ROW]
[ROW][C]39[/C][C]0.076888[/C][C]0.8423[/C][C]0.200656[/C][/ROW]
[ROW][C]40[/C][C]0.051856[/C][C]0.5681[/C][C]0.28553[/C][/ROW]
[ROW][C]41[/C][C]0.030065[/C][C]0.3293[/C][C]0.371235[/C][/ROW]
[ROW][C]42[/C][C]0.011845[/C][C]0.1298[/C][C]0.448488[/C][/ROW]
[ROW][C]43[/C][C]-0.000504[/C][C]-0.0055[/C][C]0.4978[/C][/ROW]
[ROW][C]44[/C][C]-0.011506[/C][C]-0.126[/C][C]0.449957[/C][/ROW]
[ROW][C]45[/C][C]-0.02153[/C][C]-0.2359[/C][C]0.406974[/C][/ROW]
[ROW][C]46[/C][C]-0.031446[/C][C]-0.3445[/C][C]0.365548[/C][/ROW]
[ROW][C]47[/C][C]-0.042088[/C][C]-0.4611[/C][C]0.322797[/C][/ROW]
[ROW][C]48[/C][C]-0.053259[/C][C]-0.5834[/C][C]0.280352[/C][/ROW]
[/TABLE]
Source: https://freestatistics.org/blog/index.php?pk=211131&T=1

Globally Unique Identifier (entire table): ba.freestatistics.org/blog/index.php?pk=211131&T=1

As an alternative you can also use a QR Code:  

The GUIDs for individual cells are displayed in the table below:

Autocorrelation Function
Time lag kACF(k)T-STATP-value
10.97090510.63570
20.93607910.25420
30.9019589.88050
40.8732699.56620
50.8459979.26740
60.8213678.99760
70.8018738.78410
80.7839968.58820
90.7650768.3810
100.7455148.16670
110.7257927.95070
120.7036077.70760
130.6726687.36870
140.6367776.97550
150.6011326.58510
160.570036.24440
170.5413585.93030
180.5153575.64550
190.4962835.43650
200.4797175.2550
210.4632095.07421e-06
220.4465544.89172e-06
230.4302344.7133e-06
240.4114924.50778e-06
250.3852184.21992.4e-05
260.3537043.87468.7e-05
270.3232973.54150.000284
280.2961373.2440.000763
290.2712682.97160.00179
300.2482872.71980.003751
310.2310612.53110.006331
320.2153682.35920.009964
330.1996892.18750.015323
340.1843412.01940.022839
350.1690781.85220.03323
360.1522971.66830.048929
370.1304681.42920.077771
380.1037621.13670.128973
390.0768880.84230.200656
400.0518560.56810.28553
410.0300650.32930.371235
420.0118450.12980.448488
43-0.000504-0.00550.4978
44-0.011506-0.1260.449957
45-0.02153-0.23590.406974
46-0.031446-0.34450.365548
47-0.042088-0.46110.322797
48-0.053259-0.58340.280352


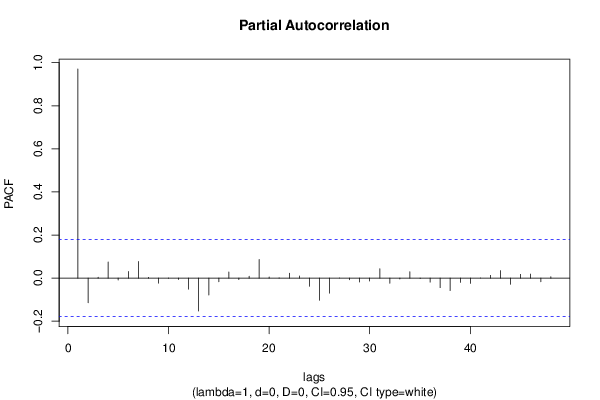
Partial Autocorrelation Function
Time lag kPACF(k)T-STATP-value
10.97090510.63570
2-0.114681-1.25630.105729
30.0041010.04490.482122
40.0746550.81780.207546
5-0.008505-0.09320.462965
60.0310570.34020.367147
70.0773770.84760.199168
80.0034040.03730.485158
9-0.023327-0.25550.399375
10-0.001094-0.0120.495229
11-0.006365-0.06970.472265
12-0.051296-0.56190.287609
13-0.152897-1.67490.048278
14-0.078823-0.86350.194802
15-0.017262-0.18910.425168
160.0282240.30920.37886
17-0.006932-0.07590.469797
180.0090180.09880.460734
190.0860710.94290.173824
200.0055790.06110.475687
210.0006470.00710.49718
220.0227970.24970.401612
230.0100190.10980.456393
24-0.037829-0.41440.339663
25-0.102882-1.1270.130993
26-0.069699-0.76350.223328
27-0.000416-0.00460.498186
28-0.007965-0.08730.465308
29-0.017754-0.19450.423061
30-0.013452-0.14740.441546
310.0433670.47510.317803
32-0.023565-0.25810.39837
33-0.004003-0.04390.482548
340.0292660.32060.374539
35-0.001534-0.01680.493311
36-0.018685-0.20470.419081
37-0.044102-0.48310.314949
38-0.058006-0.63540.263179
39-0.019713-0.21590.414698
40-0.02455-0.26890.394222
410.0001970.00220.499142
420.0127680.13990.444499
430.034880.38210.351533
44-0.028257-0.30950.378723
450.017380.19040.424664
460.0185930.20370.419475
47-0.0166-0.18180.428006
480.0065620.07190.471408

\begin{tabular}{lllllllll}
\hline
Partial Autocorrelation Function \tabularnewline
Time lag k & PACF(k) & T-STAT & P-value \tabularnewline
1 & 0.970905 & 10.6357 & 0 \tabularnewline
2 & -0.114681 & -1.2563 & 0.105729 \tabularnewline
3 & 0.004101 & 0.0449 & 0.482122 \tabularnewline
4 & 0.074655 & 0.8178 & 0.207546 \tabularnewline
5 & -0.008505 & -0.0932 & 0.462965 \tabularnewline
6 & 0.031057 & 0.3402 & 0.367147 \tabularnewline
7 & 0.077377 & 0.8476 & 0.199168 \tabularnewline
8 & 0.003404 & 0.0373 & 0.485158 \tabularnewline
9 & -0.023327 & -0.2555 & 0.399375 \tabularnewline
10 & -0.001094 & -0.012 & 0.495229 \tabularnewline
11 & -0.006365 & -0.0697 & 0.472265 \tabularnewline
12 & -0.051296 & -0.5619 & 0.287609 \tabularnewline
13 & -0.152897 & -1.6749 & 0.048278 \tabularnewline
14 & -0.078823 & -0.8635 & 0.194802 \tabularnewline
15 & -0.017262 & -0.1891 & 0.425168 \tabularnewline
16 & 0.028224 & 0.3092 & 0.37886 \tabularnewline
17 & -0.006932 & -0.0759 & 0.469797 \tabularnewline
18 & 0.009018 & 0.0988 & 0.460734 \tabularnewline
19 & 0.086071 & 0.9429 & 0.173824 \tabularnewline
20 & 0.005579 & 0.0611 & 0.475687 \tabularnewline
21 & 0.000647 & 0.0071 & 0.49718 \tabularnewline
22 & 0.022797 & 0.2497 & 0.401612 \tabularnewline
23 & 0.010019 & 0.1098 & 0.456393 \tabularnewline
24 & -0.037829 & -0.4144 & 0.339663 \tabularnewline
25 & -0.102882 & -1.127 & 0.130993 \tabularnewline
26 & -0.069699 & -0.7635 & 0.223328 \tabularnewline
27 & -0.000416 & -0.0046 & 0.498186 \tabularnewline
28 & -0.007965 & -0.0873 & 0.465308 \tabularnewline
29 & -0.017754 & -0.1945 & 0.423061 \tabularnewline
30 & -0.013452 & -0.1474 & 0.441546 \tabularnewline
31 & 0.043367 & 0.4751 & 0.317803 \tabularnewline
32 & -0.023565 & -0.2581 & 0.39837 \tabularnewline
33 & -0.004003 & -0.0439 & 0.482548 \tabularnewline
34 & 0.029266 & 0.3206 & 0.374539 \tabularnewline
35 & -0.001534 & -0.0168 & 0.493311 \tabularnewline
36 & -0.018685 & -0.2047 & 0.419081 \tabularnewline
37 & -0.044102 & -0.4831 & 0.314949 \tabularnewline
38 & -0.058006 & -0.6354 & 0.263179 \tabularnewline
39 & -0.019713 & -0.2159 & 0.414698 \tabularnewline
40 & -0.02455 & -0.2689 & 0.394222 \tabularnewline
41 & 0.000197 & 0.0022 & 0.499142 \tabularnewline
42 & 0.012768 & 0.1399 & 0.444499 \tabularnewline
43 & 0.03488 & 0.3821 & 0.351533 \tabularnewline
44 & -0.028257 & -0.3095 & 0.378723 \tabularnewline
45 & 0.01738 & 0.1904 & 0.424664 \tabularnewline
46 & 0.018593 & 0.2037 & 0.419475 \tabularnewline
47 & -0.0166 & -0.1818 & 0.428006 \tabularnewline
48 & 0.006562 & 0.0719 & 0.471408 \tabularnewline
\hline
\end{tabular}
%Source: https://freestatistics.org/blog/index.php?pk=211131&T=2

[TABLE]
[ROW][C]Partial Autocorrelation Function[/C][/ROW]
[ROW][C]Time lag k[/C][C]PACF(k)[/C][C]T-STAT[/C][C]P-value[/C][/ROW]
[ROW][C]1[/C][C]0.970905[/C][C]10.6357[/C][C]0[/C][/ROW]
[ROW][C]2[/C][C]-0.114681[/C][C]-1.2563[/C][C]0.105729[/C][/ROW]
[ROW][C]3[/C][C]0.004101[/C][C]0.0449[/C][C]0.482122[/C][/ROW]
[ROW][C]4[/C][C]0.074655[/C][C]0.8178[/C][C]0.207546[/C][/ROW]
[ROW][C]5[/C][C]-0.008505[/C][C]-0.0932[/C][C]0.462965[/C][/ROW]
[ROW][C]6[/C][C]0.031057[/C][C]0.3402[/C][C]0.367147[/C][/ROW]
[ROW][C]7[/C][C]0.077377[/C][C]0.8476[/C][C]0.199168[/C][/ROW]
[ROW][C]8[/C][C]0.003404[/C][C]0.0373[/C][C]0.485158[/C][/ROW]
[ROW][C]9[/C][C]-0.023327[/C][C]-0.2555[/C][C]0.399375[/C][/ROW]
[ROW][C]10[/C][C]-0.001094[/C][C]-0.012[/C][C]0.495229[/C][/ROW]
[ROW][C]11[/C][C]-0.006365[/C][C]-0.0697[/C][C]0.472265[/C][/ROW]
[ROW][C]12[/C][C]-0.051296[/C][C]-0.5619[/C][C]0.287609[/C][/ROW]
[ROW][C]13[/C][C]-0.152897[/C][C]-1.6749[/C][C]0.048278[/C][/ROW]
[ROW][C]14[/C][C]-0.078823[/C][C]-0.8635[/C][C]0.194802[/C][/ROW]
[ROW][C]15[/C][C]-0.017262[/C][C]-0.1891[/C][C]0.425168[/C][/ROW]
[ROW][C]16[/C][C]0.028224[/C][C]0.3092[/C][C]0.37886[/C][/ROW]
[ROW][C]17[/C][C]-0.006932[/C][C]-0.0759[/C][C]0.469797[/C][/ROW]
[ROW][C]18[/C][C]0.009018[/C][C]0.0988[/C][C]0.460734[/C][/ROW]
[ROW][C]19[/C][C]0.086071[/C][C]0.9429[/C][C]0.173824[/C][/ROW]
[ROW][C]20[/C][C]0.005579[/C][C]0.0611[/C][C]0.475687[/C][/ROW]
[ROW][C]21[/C][C]0.000647[/C][C]0.0071[/C][C]0.49718[/C][/ROW]
[ROW][C]22[/C][C]0.022797[/C][C]0.2497[/C][C]0.401612[/C][/ROW]
[ROW][C]23[/C][C]0.010019[/C][C]0.1098[/C][C]0.456393[/C][/ROW]
[ROW][C]24[/C][C]-0.037829[/C][C]-0.4144[/C][C]0.339663[/C][/ROW]
[ROW][C]25[/C][C]-0.102882[/C][C]-1.127[/C][C]0.130993[/C][/ROW]
[ROW][C]26[/C][C]-0.069699[/C][C]-0.7635[/C][C]0.223328[/C][/ROW]
[ROW][C]27[/C][C]-0.000416[/C][C]-0.0046[/C][C]0.498186[/C][/ROW]
[ROW][C]28[/C][C]-0.007965[/C][C]-0.0873[/C][C]0.465308[/C][/ROW]
[ROW][C]29[/C][C]-0.017754[/C][C]-0.1945[/C][C]0.423061[/C][/ROW]
[ROW][C]30[/C][C]-0.013452[/C][C]-0.1474[/C][C]0.441546[/C][/ROW]
[ROW][C]31[/C][C]0.043367[/C][C]0.4751[/C][C]0.317803[/C][/ROW]
[ROW][C]32[/C][C]-0.023565[/C][C]-0.2581[/C][C]0.39837[/C][/ROW]
[ROW][C]33[/C][C]-0.004003[/C][C]-0.0439[/C][C]0.482548[/C][/ROW]
[ROW][C]34[/C][C]0.029266[/C][C]0.3206[/C][C]0.374539[/C][/ROW]
[ROW][C]35[/C][C]-0.001534[/C][C]-0.0168[/C][C]0.493311[/C][/ROW]
[ROW][C]36[/C][C]-0.018685[/C][C]-0.2047[/C][C]0.419081[/C][/ROW]
[ROW][C]37[/C][C]-0.044102[/C][C]-0.4831[/C][C]0.314949[/C][/ROW]
[ROW][C]38[/C][C]-0.058006[/C][C]-0.6354[/C][C]0.263179[/C][/ROW]
[ROW][C]39[/C][C]-0.019713[/C][C]-0.2159[/C][C]0.414698[/C][/ROW]
[ROW][C]40[/C][C]-0.02455[/C][C]-0.2689[/C][C]0.394222[/C][/ROW]
[ROW][C]41[/C][C]0.000197[/C][C]0.0022[/C][C]0.499142[/C][/ROW]
[ROW][C]42[/C][C]0.012768[/C][C]0.1399[/C][C]0.444499[/C][/ROW]
[ROW][C]43[/C][C]0.03488[/C][C]0.3821[/C][C]0.351533[/C][/ROW]
[ROW][C]44[/C][C]-0.028257[/C][C]-0.3095[/C][C]0.378723[/C][/ROW]
[ROW][C]45[/C][C]0.01738[/C][C]0.1904[/C][C]0.424664[/C][/ROW]
[ROW][C]46[/C][C]0.018593[/C][C]0.2037[/C][C]0.419475[/C][/ROW]
[ROW][C]47[/C][C]-0.0166[/C][C]-0.1818[/C][C]0.428006[/C][/ROW]
[ROW][C]48[/C][C]0.006562[/C][C]0.0719[/C][C]0.471408[/C][/ROW]
[/TABLE]
Source: https://freestatistics.org/blog/index.php?pk=211131&T=2

Globally Unique Identifier (entire table): ba.freestatistics.org/blog/index.php?pk=211131&T=2

As an alternative you can also use a QR Code:  

The GUIDs for individual cells are displayed in the table below:

Partial Autocorrelation Function
Time lag kPACF(k)T-STATP-value
10.97090510.63570
2-0.114681-1.25630.105729
30.0041010.04490.482122
40.0746550.81780.207546
5-0.008505-0.09320.462965
60.0310570.34020.367147
70.0773770.84760.199168
80.0034040.03730.485158
9-0.023327-0.25550.399375
10-0.001094-0.0120.495229
11-0.006365-0.06970.472265
12-0.051296-0.56190.287609
13-0.152897-1.67490.048278
14-0.078823-0.86350.194802
15-0.017262-0.18910.425168
160.0282240.30920.37886
17-0.006932-0.07590.469797
180.0090180.09880.460734
190.0860710.94290.173824
200.0055790.06110.475687
210.0006470.00710.49718
220.0227970.24970.401612
230.0100190.10980.456393
24-0.037829-0.41440.339663
25-0.102882-1.1270.130993
26-0.069699-0.76350.223328
27-0.000416-0.00460.498186
28-0.007965-0.08730.465308
29-0.017754-0.19450.423061
30-0.013452-0.14740.441546
310.0433670.47510.317803
32-0.023565-0.25810.39837
33-0.004003-0.04390.482548
340.0292660.32060.374539
35-0.001534-0.01680.493311
36-0.018685-0.20470.419081
37-0.044102-0.48310.314949
38-0.058006-0.63540.263179
39-0.019713-0.21590.414698
40-0.02455-0.26890.394222
410.0001970.00220.499142
420.0127680.13990.444499
430.034880.38210.351533
44-0.028257-0.30950.378723
450.017380.19040.424664
460.0185930.20370.419475
47-0.0166-0.18180.428006
480.0065620.07190.471408


Parameters (Session):
par1 = 48 ; par2 = 1 ; par3 = 0 ; par4 = 0 ; par5 = 12 ; par6 = White Noise ; par7 = 0.95 ;
Parameters (R input):
par1 = 48 ; par2 = 1 ; par3 = 0 ; par4 = 0 ; par5 = 12 ; par6 = White Noise ; par7 = 0.95 ; par8 = ;
R code (references can be found in the software module):
if (par1 == 'Default') {
par1 = 10*log10(length(x))
} else {
par1 <- as.numeric(par1)
}
par2 <- as.numeric(par2)
par3 <- as.numeric(par3)
par4 <- as.numeric(par4)
par5 <- as.numeric(par5)
if (par6 == 'White Noise') par6 <- 'white' else par6 <- 'ma'
par7 <- as.numeric(par7)
if (par8 != '') par8 <- as.numeric(par8)
ox <- x
if (par8 == '') {
if (par2 == 0) {
x <- log(x)
} else {
x <- (x ^ par2 - 1) / par2
}
} else {
x <- log(x,base=par8)
}
if (par3 > 0) x <- diff(x,lag=1,difference=par3)
if (par4 > 0) x <- diff(x,lag=par5,difference=par4)
bitmap(file='picts.png')
op <- par(mfrow=c(2,1))
plot(ox,type='l',main='Original Time Series',xlab='time',ylab='value')
if (par8=='') {
mytitle <- paste('Working Time Series (lambda=',par2,', d=',par3,', D=',par4,')',sep='')
mysub <- paste('(lambda=',par2,', d=',par3,', D=',par4,', CI=', par7, ', CI type=',par6,')',sep='')
} else {
mytitle <- paste('Working Time Series (base=',par8,', d=',par3,', D=',par4,')',sep='')
mysub <- paste('(base=',par8,', d=',par3,', D=',par4,', CI=', par7, ', CI type=',par6,')',sep='')
}
plot(x,type='l', main=mytitle,xlab='time',ylab='value')
par(op)
dev.off()
bitmap(file='pic1.png')
racf <- acf(x, par1, main='Autocorrelation', xlab='time lag', ylab='ACF', ci.type=par6, ci=par7, sub=mysub)
dev.off()
bitmap(file='pic2.png')
rpacf <- pacf(x,par1,main='Partial Autocorrelation',xlab='lags',ylab='PACF',sub=mysub)
dev.off()
(myacf <- c(racf$acf))
(mypacf <- c(rpacf$acf))
lengthx <- length(x)
sqrtn <- sqrt(lengthx)
load(file='createtable')
a<-table.start()
a<-table.row.start(a)
a<-table.element(a,'Autocorrelation Function',4,TRUE)
a<-table.row.end(a)
a<-table.row.start(a)
a<-table.element(a,'Time lag k',header=TRUE)
a<-table.element(a,hyperlink('basics.htm','ACF(k)','click here for more information about the Autocorrelation Function'),header=TRUE)
a<-table.element(a,'T-STAT',header=TRUE)
a<-table.element(a,'P-value',header=TRUE)
a<-table.row.end(a)
for (i in 2:(par1+1)) {
a<-table.row.start(a)
a<-table.element(a,i-1,header=TRUE)
a<-table.element(a,round(myacf[i],6))
mytstat <- myacf[i]*sqrtn
a<-table.element(a,round(mytstat,4))
a<-table.element(a,round(1-pt(abs(mytstat),lengthx),6))
a<-table.row.end(a)
}
a<-table.end(a)
table.save(a,file='mytable.tab')
a<-table.start()
a<-table.row.start(a)
a<-table.element(a,'Partial Autocorrelation Function',4,TRUE)
a<-table.row.end(a)
a<-table.row.start(a)
a<-table.element(a,'Time lag k',header=TRUE)
a<-table.element(a,hyperlink('basics.htm','PACF(k)','click here for more information about the Partial Autocorrelation Function'),header=TRUE)
a<-table.element(a,'T-STAT',header=TRUE)
a<-table.element(a,'P-value',header=TRUE)
a<-table.row.end(a)
for (i in 1:par1) {
a<-table.row.start(a)
a<-table.element(a,i,header=TRUE)
a<-table.element(a,round(mypacf[i],6))
mytstat <- mypacf[i]*sqrtn
a<-table.element(a,round(mytstat,4))
a<-table.element(a,round(1-pt(abs(mytstat),lengthx),6))
a<-table.row.end(a)
}
a<-table.end(a)
table.save(a,file='mytable1.tab')