Free Statistics

of Irreproducible Research!

Author's title

Author*Unverified author*
R Software Modulerwasp_autocorrelation.wasp
Title produced by software(Partial) Autocorrelation Function
Date of computationSat, 17 Aug 2013 13:37:45 -0400
Cite this page as followsStatistical Computations at FreeStatistics.org, Office for Research Development and Education, URL https://freestatistics.org/blog/index.php?v=date/2013/Aug/17/t13767611213ota4uu5jooc6ci.htm/, Retrieved Mon, 29 Apr 2024 02:20:47 +0000
Statistical Computations at FreeStatistics.org, Office for Research Development and Education, URL https://freestatistics.org/blog/index.php?pk=211146, Retrieved Mon, 29 Apr 2024 02:20:47 +0000
QR Codes:

Original text written by user:
IsPrivate?No (this computation is public)
User-defined keywords
Estimated Impact179
Family? (F = Feedback message, R = changed R code, M = changed R Module, P = changed Parameters, D = changed Data)
-       [(Partial) Autocorrelation Function] [autocorralation f...] [2013-08-17 17:37:45] [3e2b14d12dd0cca2f2b67dfbdf2cdaf9] [Current]
- R P     [(Partial) Autocorrelation Function] [gedifferntieerde ...] [2013-08-19 18:52:24] [74be16979710d4c4e7c6647856088456]
Feedback Forum

Post a new message
Dataseries X:
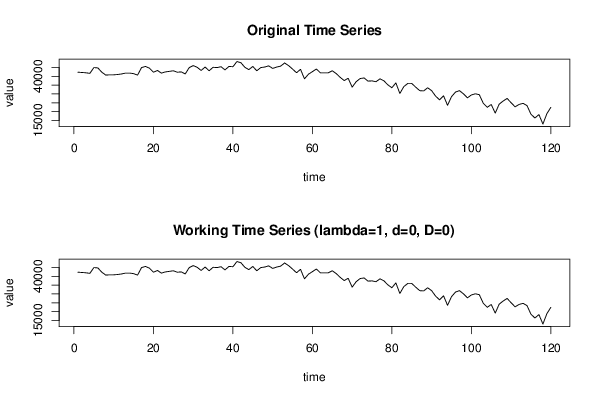
42364
42206
42046
41715
44991
44818
42364
40733
40891
40891
41067
41382
41873
41873
41558
40733
44991
45640
44660
42364
43346
41873
42538
42855
43186
42364
42538
41382
44991
46131
45151
43346
45309
43186
45151
44991
45482
43678
45640
45482
48426
47762
45151
43835
45640
43186
44991
45309
45973
44502
45309
45800
47604
46131
44169
42046
44011
38611
41224
42695
44169
42046
42046
42046
43186
41558
39420
37631
38929
33862
36967
38771
39102
37298
37455
36967
38611
37455
35178
33531
36315
30269
34195
35984
35984
33862
31900
31742
33531
31900
28798
26660
28956
23558
28464
31075
31900
30096
27816
29447
30096
29604
24696
22418
24047
19140
24207
26011
27482
25029
22733
24047
24696
23398
18491
16353
18316
12918
18807
22418


Summary of computational transaction
Raw Inputview raw input (R code)
Raw Outputview raw output of R engine
Computing time3 seconds
R Server'Gertrude Mary Cox' @ cox.wessa.net

\begin{tabular}{lllllllll}
\hline
Summary of computational transaction \tabularnewline
Raw Input & view raw input (R code)  \tabularnewline
Raw Output & view raw output of R engine  \tabularnewline
Computing time & 3 seconds \tabularnewline
R Server & 'Gertrude Mary Cox' @ cox.wessa.net \tabularnewline
\hline
\end{tabular}
%Source: https://freestatistics.org/blog/index.php?pk=211146&T=0

[TABLE]
[ROW][C]Summary of computational transaction[/C][/ROW]
[ROW][C]Raw Input[/C][C]view raw input (R code) [/C][/ROW]
[ROW][C]Raw Output[/C][C]view raw output of R engine [/C][/ROW]
[ROW][C]Computing time[/C][C]3 seconds[/C][/ROW]
[ROW][C]R Server[/C][C]'Gertrude Mary Cox' @ cox.wessa.net[/C][/ROW]
[/TABLE]
Source: https://freestatistics.org/blog/index.php?pk=211146&T=0

Globally Unique Identifier (entire table): ba.freestatistics.org/blog/index.php?pk=211146&T=0

As an alternative you can also use a QR Code:  

The GUIDs for individual cells are displayed in the table below:

Summary of computational transaction
Raw Inputview raw input (R code)
Raw Outputview raw output of R engine
Computing time3 seconds
R Server'Gertrude Mary Cox' @ cox.wessa.net


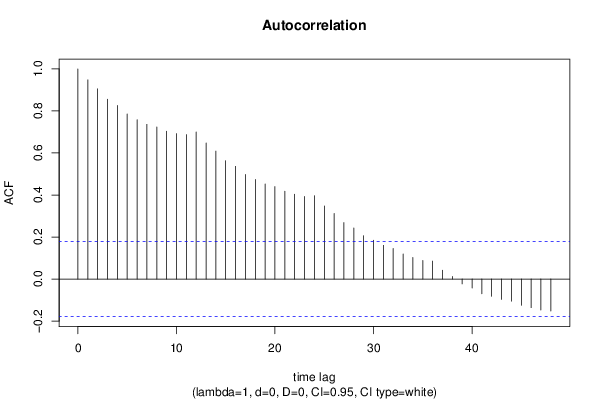
Autocorrelation Function
Time lag kACF(k)T-STATP-value
10.94790110.38370
20.9052679.91670
30.8557299.3740
40.8262079.05060
50.7856798.60670
60.7579668.30310
70.7361888.06450
80.7236547.92720
90.7031837.7030
100.6921047.58160
110.6875697.53190
120.7001337.66960
130.6479587.0980
140.6088356.66950
150.5635096.17290
160.5363615.87550
170.4979715.4550
180.4738345.19060
190.4526884.9591e-06
200.4400094.82012e-06
210.4182934.58226e-06
220.4033974.4191.1e-05
230.3933264.30871.7e-05
240.3969024.34781.4e-05
250.3480753.8130.000109
260.3117653.41520.000435
270.2687162.94360.001948
280.2433612.66590.004368
290.2063792.26080.012788
300.1844222.02020.022792
310.1603391.75640.040784
320.1452811.59150.057066
330.1190321.30390.097377
340.1022831.12050.132379
350.0881910.96610.167972
360.0855670.93730.175233
370.0421530.46180.322543
380.0125270.13720.44554
39-0.023123-0.25330.400234
40-0.042349-0.46390.321778
41-0.070057-0.76740.222164
42-0.081846-0.89660.18587
43-0.09662-1.05840.145996
44-0.1051-1.15130.125946
45-0.12496-1.36890.086798
46-0.136034-1.49020.069401
47-0.147635-1.61730.054224
48-0.152257-1.66790.048972

\begin{tabular}{lllllllll}
\hline
Autocorrelation Function \tabularnewline
Time lag k & ACF(k) & T-STAT & P-value \tabularnewline
1 & 0.947901 & 10.3837 & 0 \tabularnewline
2 & 0.905267 & 9.9167 & 0 \tabularnewline
3 & 0.855729 & 9.374 & 0 \tabularnewline
4 & 0.826207 & 9.0506 & 0 \tabularnewline
5 & 0.785679 & 8.6067 & 0 \tabularnewline
6 & 0.757966 & 8.3031 & 0 \tabularnewline
7 & 0.736188 & 8.0645 & 0 \tabularnewline
8 & 0.723654 & 7.9272 & 0 \tabularnewline
9 & 0.703183 & 7.703 & 0 \tabularnewline
10 & 0.692104 & 7.5816 & 0 \tabularnewline
11 & 0.687569 & 7.5319 & 0 \tabularnewline
12 & 0.700133 & 7.6696 & 0 \tabularnewline
13 & 0.647958 & 7.098 & 0 \tabularnewline
14 & 0.608835 & 6.6695 & 0 \tabularnewline
15 & 0.563509 & 6.1729 & 0 \tabularnewline
16 & 0.536361 & 5.8755 & 0 \tabularnewline
17 & 0.497971 & 5.455 & 0 \tabularnewline
18 & 0.473834 & 5.1906 & 0 \tabularnewline
19 & 0.452688 & 4.959 & 1e-06 \tabularnewline
20 & 0.440009 & 4.8201 & 2e-06 \tabularnewline
21 & 0.418293 & 4.5822 & 6e-06 \tabularnewline
22 & 0.403397 & 4.419 & 1.1e-05 \tabularnewline
23 & 0.393326 & 4.3087 & 1.7e-05 \tabularnewline
24 & 0.396902 & 4.3478 & 1.4e-05 \tabularnewline
25 & 0.348075 & 3.813 & 0.000109 \tabularnewline
26 & 0.311765 & 3.4152 & 0.000435 \tabularnewline
27 & 0.268716 & 2.9436 & 0.001948 \tabularnewline
28 & 0.243361 & 2.6659 & 0.004368 \tabularnewline
29 & 0.206379 & 2.2608 & 0.012788 \tabularnewline
30 & 0.184422 & 2.0202 & 0.022792 \tabularnewline
31 & 0.160339 & 1.7564 & 0.040784 \tabularnewline
32 & 0.145281 & 1.5915 & 0.057066 \tabularnewline
33 & 0.119032 & 1.3039 & 0.097377 \tabularnewline
34 & 0.102283 & 1.1205 & 0.132379 \tabularnewline
35 & 0.088191 & 0.9661 & 0.167972 \tabularnewline
36 & 0.085567 & 0.9373 & 0.175233 \tabularnewline
37 & 0.042153 & 0.4618 & 0.322543 \tabularnewline
38 & 0.012527 & 0.1372 & 0.44554 \tabularnewline
39 & -0.023123 & -0.2533 & 0.400234 \tabularnewline
40 & -0.042349 & -0.4639 & 0.321778 \tabularnewline
41 & -0.070057 & -0.7674 & 0.222164 \tabularnewline
42 & -0.081846 & -0.8966 & 0.18587 \tabularnewline
43 & -0.09662 & -1.0584 & 0.145996 \tabularnewline
44 & -0.1051 & -1.1513 & 0.125946 \tabularnewline
45 & -0.12496 & -1.3689 & 0.086798 \tabularnewline
46 & -0.136034 & -1.4902 & 0.069401 \tabularnewline
47 & -0.147635 & -1.6173 & 0.054224 \tabularnewline
48 & -0.152257 & -1.6679 & 0.048972 \tabularnewline
\hline
\end{tabular}
%Source: https://freestatistics.org/blog/index.php?pk=211146&T=1

[TABLE]
[ROW][C]Autocorrelation Function[/C][/ROW]
[ROW][C]Time lag k[/C][C]ACF(k)[/C][C]T-STAT[/C][C]P-value[/C][/ROW]
[ROW][C]1[/C][C]0.947901[/C][C]10.3837[/C][C]0[/C][/ROW]
[ROW][C]2[/C][C]0.905267[/C][C]9.9167[/C][C]0[/C][/ROW]
[ROW][C]3[/C][C]0.855729[/C][C]9.374[/C][C]0[/C][/ROW]
[ROW][C]4[/C][C]0.826207[/C][C]9.0506[/C][C]0[/C][/ROW]
[ROW][C]5[/C][C]0.785679[/C][C]8.6067[/C][C]0[/C][/ROW]
[ROW][C]6[/C][C]0.757966[/C][C]8.3031[/C][C]0[/C][/ROW]
[ROW][C]7[/C][C]0.736188[/C][C]8.0645[/C][C]0[/C][/ROW]
[ROW][C]8[/C][C]0.723654[/C][C]7.9272[/C][C]0[/C][/ROW]
[ROW][C]9[/C][C]0.703183[/C][C]7.703[/C][C]0[/C][/ROW]
[ROW][C]10[/C][C]0.692104[/C][C]7.5816[/C][C]0[/C][/ROW]
[ROW][C]11[/C][C]0.687569[/C][C]7.5319[/C][C]0[/C][/ROW]
[ROW][C]12[/C][C]0.700133[/C][C]7.6696[/C][C]0[/C][/ROW]
[ROW][C]13[/C][C]0.647958[/C][C]7.098[/C][C]0[/C][/ROW]
[ROW][C]14[/C][C]0.608835[/C][C]6.6695[/C][C]0[/C][/ROW]
[ROW][C]15[/C][C]0.563509[/C][C]6.1729[/C][C]0[/C][/ROW]
[ROW][C]16[/C][C]0.536361[/C][C]5.8755[/C][C]0[/C][/ROW]
[ROW][C]17[/C][C]0.497971[/C][C]5.455[/C][C]0[/C][/ROW]
[ROW][C]18[/C][C]0.473834[/C][C]5.1906[/C][C]0[/C][/ROW]
[ROW][C]19[/C][C]0.452688[/C][C]4.959[/C][C]1e-06[/C][/ROW]
[ROW][C]20[/C][C]0.440009[/C][C]4.8201[/C][C]2e-06[/C][/ROW]
[ROW][C]21[/C][C]0.418293[/C][C]4.5822[/C][C]6e-06[/C][/ROW]
[ROW][C]22[/C][C]0.403397[/C][C]4.419[/C][C]1.1e-05[/C][/ROW]
[ROW][C]23[/C][C]0.393326[/C][C]4.3087[/C][C]1.7e-05[/C][/ROW]
[ROW][C]24[/C][C]0.396902[/C][C]4.3478[/C][C]1.4e-05[/C][/ROW]
[ROW][C]25[/C][C]0.348075[/C][C]3.813[/C][C]0.000109[/C][/ROW]
[ROW][C]26[/C][C]0.311765[/C][C]3.4152[/C][C]0.000435[/C][/ROW]
[ROW][C]27[/C][C]0.268716[/C][C]2.9436[/C][C]0.001948[/C][/ROW]
[ROW][C]28[/C][C]0.243361[/C][C]2.6659[/C][C]0.004368[/C][/ROW]
[ROW][C]29[/C][C]0.206379[/C][C]2.2608[/C][C]0.012788[/C][/ROW]
[ROW][C]30[/C][C]0.184422[/C][C]2.0202[/C][C]0.022792[/C][/ROW]
[ROW][C]31[/C][C]0.160339[/C][C]1.7564[/C][C]0.040784[/C][/ROW]
[ROW][C]32[/C][C]0.145281[/C][C]1.5915[/C][C]0.057066[/C][/ROW]
[ROW][C]33[/C][C]0.119032[/C][C]1.3039[/C][C]0.097377[/C][/ROW]
[ROW][C]34[/C][C]0.102283[/C][C]1.1205[/C][C]0.132379[/C][/ROW]
[ROW][C]35[/C][C]0.088191[/C][C]0.9661[/C][C]0.167972[/C][/ROW]
[ROW][C]36[/C][C]0.085567[/C][C]0.9373[/C][C]0.175233[/C][/ROW]
[ROW][C]37[/C][C]0.042153[/C][C]0.4618[/C][C]0.322543[/C][/ROW]
[ROW][C]38[/C][C]0.012527[/C][C]0.1372[/C][C]0.44554[/C][/ROW]
[ROW][C]39[/C][C]-0.023123[/C][C]-0.2533[/C][C]0.400234[/C][/ROW]
[ROW][C]40[/C][C]-0.042349[/C][C]-0.4639[/C][C]0.321778[/C][/ROW]
[ROW][C]41[/C][C]-0.070057[/C][C]-0.7674[/C][C]0.222164[/C][/ROW]
[ROW][C]42[/C][C]-0.081846[/C][C]-0.8966[/C][C]0.18587[/C][/ROW]
[ROW][C]43[/C][C]-0.09662[/C][C]-1.0584[/C][C]0.145996[/C][/ROW]
[ROW][C]44[/C][C]-0.1051[/C][C]-1.1513[/C][C]0.125946[/C][/ROW]
[ROW][C]45[/C][C]-0.12496[/C][C]-1.3689[/C][C]0.086798[/C][/ROW]
[ROW][C]46[/C][C]-0.136034[/C][C]-1.4902[/C][C]0.069401[/C][/ROW]
[ROW][C]47[/C][C]-0.147635[/C][C]-1.6173[/C][C]0.054224[/C][/ROW]
[ROW][C]48[/C][C]-0.152257[/C][C]-1.6679[/C][C]0.048972[/C][/ROW]
[/TABLE]
Source: https://freestatistics.org/blog/index.php?pk=211146&T=1

Globally Unique Identifier (entire table): ba.freestatistics.org/blog/index.php?pk=211146&T=1

As an alternative you can also use a QR Code:  

The GUIDs for individual cells are displayed in the table below:

Autocorrelation Function
Time lag kACF(k)T-STATP-value
10.94790110.38370
20.9052679.91670
30.8557299.3740
40.8262079.05060
50.7856798.60670
60.7579668.30310
70.7361888.06450
80.7236547.92720
90.7031837.7030
100.6921047.58160
110.6875697.53190
120.7001337.66960
130.6479587.0980
140.6088356.66950
150.5635096.17290
160.5363615.87550
170.4979715.4550
180.4738345.19060
190.4526884.9591e-06
200.4400094.82012e-06
210.4182934.58226e-06
220.4033974.4191.1e-05
230.3933264.30871.7e-05
240.3969024.34781.4e-05
250.3480753.8130.000109
260.3117653.41520.000435
270.2687162.94360.001948
280.2433612.66590.004368
290.2063792.26080.012788
300.1844222.02020.022792
310.1603391.75640.040784
320.1452811.59150.057066
330.1190321.30390.097377
340.1022831.12050.132379
350.0881910.96610.167972
360.0855670.93730.175233
370.0421530.46180.322543
380.0125270.13720.44554
39-0.023123-0.25330.400234
40-0.042349-0.46390.321778
41-0.070057-0.76740.222164
42-0.081846-0.89660.18587
43-0.09662-1.05840.145996
44-0.1051-1.15130.125946
45-0.12496-1.36890.086798
46-0.136034-1.49020.069401
47-0.147635-1.61730.054224
48-0.152257-1.66790.048972


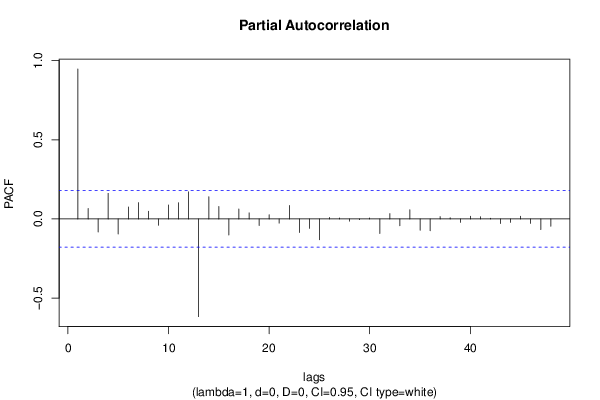
Partial Autocorrelation Function
Time lag kPACF(k)T-STATP-value
10.94790110.38370
20.0665250.72870.233788
3-0.08263-0.90520.183595
40.1617661.77210.039462
5-0.095018-1.04090.150015
60.0752230.8240.20578
70.1033741.13240.129861
80.0490940.53780.295857
9-0.040346-0.4420.329654
100.0882570.96680.167792
110.1023781.12150.132158
120.1709011.87210.031812
13-0.617575-6.76520
140.1401261.5350.063707
150.0790950.86640.193988
16-0.101804-1.11520.133495
170.0629360.68940.245943
180.038390.42050.33742
19-0.041055-0.44970.326856
200.0265780.29110.38572
21-0.026541-0.29070.385875
220.0847630.92850.177498
23-0.08581-0.940.174552
24-0.059786-0.65490.256887
25-0.1321-1.44710.07524
260.0095470.10460.45844
270.0064230.07040.472012
28-0.014113-0.15460.4387
29-0.004661-0.05110.47968
300.005740.06290.474985
31-0.0916-1.00340.158837
320.033570.36770.356857
33-0.043533-0.47690.317158
340.0585170.6410.261367
35-0.071719-0.78560.216812
36-0.075159-0.82330.205977
370.0145770.15970.436698
380.0072710.07960.468325
39-0.02175-0.23830.406043
400.0173140.18970.424945
410.0142180.15570.438247
420.0038550.04220.483191
43-0.029022-0.31790.375549
44-0.021887-0.23980.405461
450.0166850.18280.42764
46-0.028127-0.30810.379265
47-0.067392-0.73820.230905
48-0.046556-0.510.305495

\begin{tabular}{lllllllll}
\hline
Partial Autocorrelation Function \tabularnewline
Time lag k & PACF(k) & T-STAT & P-value \tabularnewline
1 & 0.947901 & 10.3837 & 0 \tabularnewline
2 & 0.066525 & 0.7287 & 0.233788 \tabularnewline
3 & -0.08263 & -0.9052 & 0.183595 \tabularnewline
4 & 0.161766 & 1.7721 & 0.039462 \tabularnewline
5 & -0.095018 & -1.0409 & 0.150015 \tabularnewline
6 & 0.075223 & 0.824 & 0.20578 \tabularnewline
7 & 0.103374 & 1.1324 & 0.129861 \tabularnewline
8 & 0.049094 & 0.5378 & 0.295857 \tabularnewline
9 & -0.040346 & -0.442 & 0.329654 \tabularnewline
10 & 0.088257 & 0.9668 & 0.167792 \tabularnewline
11 & 0.102378 & 1.1215 & 0.132158 \tabularnewline
12 & 0.170901 & 1.8721 & 0.031812 \tabularnewline
13 & -0.617575 & -6.7652 & 0 \tabularnewline
14 & 0.140126 & 1.535 & 0.063707 \tabularnewline
15 & 0.079095 & 0.8664 & 0.193988 \tabularnewline
16 & -0.101804 & -1.1152 & 0.133495 \tabularnewline
17 & 0.062936 & 0.6894 & 0.245943 \tabularnewline
18 & 0.03839 & 0.4205 & 0.33742 \tabularnewline
19 & -0.041055 & -0.4497 & 0.326856 \tabularnewline
20 & 0.026578 & 0.2911 & 0.38572 \tabularnewline
21 & -0.026541 & -0.2907 & 0.385875 \tabularnewline
22 & 0.084763 & 0.9285 & 0.177498 \tabularnewline
23 & -0.08581 & -0.94 & 0.174552 \tabularnewline
24 & -0.059786 & -0.6549 & 0.256887 \tabularnewline
25 & -0.1321 & -1.4471 & 0.07524 \tabularnewline
26 & 0.009547 & 0.1046 & 0.45844 \tabularnewline
27 & 0.006423 & 0.0704 & 0.472012 \tabularnewline
28 & -0.014113 & -0.1546 & 0.4387 \tabularnewline
29 & -0.004661 & -0.0511 & 0.47968 \tabularnewline
30 & 0.00574 & 0.0629 & 0.474985 \tabularnewline
31 & -0.0916 & -1.0034 & 0.158837 \tabularnewline
32 & 0.03357 & 0.3677 & 0.356857 \tabularnewline
33 & -0.043533 & -0.4769 & 0.317158 \tabularnewline
34 & 0.058517 & 0.641 & 0.261367 \tabularnewline
35 & -0.071719 & -0.7856 & 0.216812 \tabularnewline
36 & -0.075159 & -0.8233 & 0.205977 \tabularnewline
37 & 0.014577 & 0.1597 & 0.436698 \tabularnewline
38 & 0.007271 & 0.0796 & 0.468325 \tabularnewline
39 & -0.02175 & -0.2383 & 0.406043 \tabularnewline
40 & 0.017314 & 0.1897 & 0.424945 \tabularnewline
41 & 0.014218 & 0.1557 & 0.438247 \tabularnewline
42 & 0.003855 & 0.0422 & 0.483191 \tabularnewline
43 & -0.029022 & -0.3179 & 0.375549 \tabularnewline
44 & -0.021887 & -0.2398 & 0.405461 \tabularnewline
45 & 0.016685 & 0.1828 & 0.42764 \tabularnewline
46 & -0.028127 & -0.3081 & 0.379265 \tabularnewline
47 & -0.067392 & -0.7382 & 0.230905 \tabularnewline
48 & -0.046556 & -0.51 & 0.305495 \tabularnewline
\hline
\end{tabular}
%Source: https://freestatistics.org/blog/index.php?pk=211146&T=2

[TABLE]
[ROW][C]Partial Autocorrelation Function[/C][/ROW]
[ROW][C]Time lag k[/C][C]PACF(k)[/C][C]T-STAT[/C][C]P-value[/C][/ROW]
[ROW][C]1[/C][C]0.947901[/C][C]10.3837[/C][C]0[/C][/ROW]
[ROW][C]2[/C][C]0.066525[/C][C]0.7287[/C][C]0.233788[/C][/ROW]
[ROW][C]3[/C][C]-0.08263[/C][C]-0.9052[/C][C]0.183595[/C][/ROW]
[ROW][C]4[/C][C]0.161766[/C][C]1.7721[/C][C]0.039462[/C][/ROW]
[ROW][C]5[/C][C]-0.095018[/C][C]-1.0409[/C][C]0.150015[/C][/ROW]
[ROW][C]6[/C][C]0.075223[/C][C]0.824[/C][C]0.20578[/C][/ROW]
[ROW][C]7[/C][C]0.103374[/C][C]1.1324[/C][C]0.129861[/C][/ROW]
[ROW][C]8[/C][C]0.049094[/C][C]0.5378[/C][C]0.295857[/C][/ROW]
[ROW][C]9[/C][C]-0.040346[/C][C]-0.442[/C][C]0.329654[/C][/ROW]
[ROW][C]10[/C][C]0.088257[/C][C]0.9668[/C][C]0.167792[/C][/ROW]
[ROW][C]11[/C][C]0.102378[/C][C]1.1215[/C][C]0.132158[/C][/ROW]
[ROW][C]12[/C][C]0.170901[/C][C]1.8721[/C][C]0.031812[/C][/ROW]
[ROW][C]13[/C][C]-0.617575[/C][C]-6.7652[/C][C]0[/C][/ROW]
[ROW][C]14[/C][C]0.140126[/C][C]1.535[/C][C]0.063707[/C][/ROW]
[ROW][C]15[/C][C]0.079095[/C][C]0.8664[/C][C]0.193988[/C][/ROW]
[ROW][C]16[/C][C]-0.101804[/C][C]-1.1152[/C][C]0.133495[/C][/ROW]
[ROW][C]17[/C][C]0.062936[/C][C]0.6894[/C][C]0.245943[/C][/ROW]
[ROW][C]18[/C][C]0.03839[/C][C]0.4205[/C][C]0.33742[/C][/ROW]
[ROW][C]19[/C][C]-0.041055[/C][C]-0.4497[/C][C]0.326856[/C][/ROW]
[ROW][C]20[/C][C]0.026578[/C][C]0.2911[/C][C]0.38572[/C][/ROW]
[ROW][C]21[/C][C]-0.026541[/C][C]-0.2907[/C][C]0.385875[/C][/ROW]
[ROW][C]22[/C][C]0.084763[/C][C]0.9285[/C][C]0.177498[/C][/ROW]
[ROW][C]23[/C][C]-0.08581[/C][C]-0.94[/C][C]0.174552[/C][/ROW]
[ROW][C]24[/C][C]-0.059786[/C][C]-0.6549[/C][C]0.256887[/C][/ROW]
[ROW][C]25[/C][C]-0.1321[/C][C]-1.4471[/C][C]0.07524[/C][/ROW]
[ROW][C]26[/C][C]0.009547[/C][C]0.1046[/C][C]0.45844[/C][/ROW]
[ROW][C]27[/C][C]0.006423[/C][C]0.0704[/C][C]0.472012[/C][/ROW]
[ROW][C]28[/C][C]-0.014113[/C][C]-0.1546[/C][C]0.4387[/C][/ROW]
[ROW][C]29[/C][C]-0.004661[/C][C]-0.0511[/C][C]0.47968[/C][/ROW]
[ROW][C]30[/C][C]0.00574[/C][C]0.0629[/C][C]0.474985[/C][/ROW]
[ROW][C]31[/C][C]-0.0916[/C][C]-1.0034[/C][C]0.158837[/C][/ROW]
[ROW][C]32[/C][C]0.03357[/C][C]0.3677[/C][C]0.356857[/C][/ROW]
[ROW][C]33[/C][C]-0.043533[/C][C]-0.4769[/C][C]0.317158[/C][/ROW]
[ROW][C]34[/C][C]0.058517[/C][C]0.641[/C][C]0.261367[/C][/ROW]
[ROW][C]35[/C][C]-0.071719[/C][C]-0.7856[/C][C]0.216812[/C][/ROW]
[ROW][C]36[/C][C]-0.075159[/C][C]-0.8233[/C][C]0.205977[/C][/ROW]
[ROW][C]37[/C][C]0.014577[/C][C]0.1597[/C][C]0.436698[/C][/ROW]
[ROW][C]38[/C][C]0.007271[/C][C]0.0796[/C][C]0.468325[/C][/ROW]
[ROW][C]39[/C][C]-0.02175[/C][C]-0.2383[/C][C]0.406043[/C][/ROW]
[ROW][C]40[/C][C]0.017314[/C][C]0.1897[/C][C]0.424945[/C][/ROW]
[ROW][C]41[/C][C]0.014218[/C][C]0.1557[/C][C]0.438247[/C][/ROW]
[ROW][C]42[/C][C]0.003855[/C][C]0.0422[/C][C]0.483191[/C][/ROW]
[ROW][C]43[/C][C]-0.029022[/C][C]-0.3179[/C][C]0.375549[/C][/ROW]
[ROW][C]44[/C][C]-0.021887[/C][C]-0.2398[/C][C]0.405461[/C][/ROW]
[ROW][C]45[/C][C]0.016685[/C][C]0.1828[/C][C]0.42764[/C][/ROW]
[ROW][C]46[/C][C]-0.028127[/C][C]-0.3081[/C][C]0.379265[/C][/ROW]
[ROW][C]47[/C][C]-0.067392[/C][C]-0.7382[/C][C]0.230905[/C][/ROW]
[ROW][C]48[/C][C]-0.046556[/C][C]-0.51[/C][C]0.305495[/C][/ROW]
[/TABLE]
Source: https://freestatistics.org/blog/index.php?pk=211146&T=2

Globally Unique Identifier (entire table): ba.freestatistics.org/blog/index.php?pk=211146&T=2

As an alternative you can also use a QR Code:  

The GUIDs for individual cells are displayed in the table below:

Partial Autocorrelation Function
Time lag kPACF(k)T-STATP-value
10.94790110.38370
20.0665250.72870.233788
3-0.08263-0.90520.183595
40.1617661.77210.039462
5-0.095018-1.04090.150015
60.0752230.8240.20578
70.1033741.13240.129861
80.0490940.53780.295857
9-0.040346-0.4420.329654
100.0882570.96680.167792
110.1023781.12150.132158
120.1709011.87210.031812
13-0.617575-6.76520
140.1401261.5350.063707
150.0790950.86640.193988
16-0.101804-1.11520.133495
170.0629360.68940.245943
180.038390.42050.33742
19-0.041055-0.44970.326856
200.0265780.29110.38572
21-0.026541-0.29070.385875
220.0847630.92850.177498
23-0.08581-0.940.174552
24-0.059786-0.65490.256887
25-0.1321-1.44710.07524
260.0095470.10460.45844
270.0064230.07040.472012
28-0.014113-0.15460.4387
29-0.004661-0.05110.47968
300.005740.06290.474985
31-0.0916-1.00340.158837
320.033570.36770.356857
33-0.043533-0.47690.317158
340.0585170.6410.261367
35-0.071719-0.78560.216812
36-0.075159-0.82330.205977
370.0145770.15970.436698
380.0072710.07960.468325
39-0.02175-0.23830.406043
400.0173140.18970.424945
410.0142180.15570.438247
420.0038550.04220.483191
43-0.029022-0.31790.375549
44-0.021887-0.23980.405461
450.0166850.18280.42764
46-0.028127-0.30810.379265
47-0.067392-0.73820.230905
48-0.046556-0.510.305495


Parameters (Session):
par1 = 48 ; par2 = 1 ; par3 = 0 ; par4 = 0 ; par5 = 12 ; par6 = White Noise ; par7 = 0.95 ;
Parameters (R input):
par1 = 48 ; par2 = 1 ; par3 = 0 ; par4 = 0 ; par5 = 12 ; par6 = White Noise ; par7 = 0.95 ; par8 = ;
R code (references can be found in the software module):
if (par1 == 'Default') {
par1 = 10*log10(length(x))
} else {
par1 <- as.numeric(par1)
}
par2 <- as.numeric(par2)
par3 <- as.numeric(par3)
par4 <- as.numeric(par4)
par5 <- as.numeric(par5)
if (par6 == 'White Noise') par6 <- 'white' else par6 <- 'ma'
par7 <- as.numeric(par7)
if (par8 != '') par8 <- as.numeric(par8)
ox <- x
if (par8 == '') {
if (par2 == 0) {
x <- log(x)
} else {
x <- (x ^ par2 - 1) / par2
}
} else {
x <- log(x,base=par8)
}
if (par3 > 0) x <- diff(x,lag=1,difference=par3)
if (par4 > 0) x <- diff(x,lag=par5,difference=par4)
bitmap(file='picts.png')
op <- par(mfrow=c(2,1))
plot(ox,type='l',main='Original Time Series',xlab='time',ylab='value')
if (par8=='') {
mytitle <- paste('Working Time Series (lambda=',par2,', d=',par3,', D=',par4,')',sep='')
mysub <- paste('(lambda=',par2,', d=',par3,', D=',par4,', CI=', par7, ', CI type=',par6,')',sep='')
} else {
mytitle <- paste('Working Time Series (base=',par8,', d=',par3,', D=',par4,')',sep='')
mysub <- paste('(base=',par8,', d=',par3,', D=',par4,', CI=', par7, ', CI type=',par6,')',sep='')
}
plot(x,type='l', main=mytitle,xlab='time',ylab='value')
par(op)
dev.off()
bitmap(file='pic1.png')
racf <- acf(x, par1, main='Autocorrelation', xlab='time lag', ylab='ACF', ci.type=par6, ci=par7, sub=mysub)
dev.off()
bitmap(file='pic2.png')
rpacf <- pacf(x,par1,main='Partial Autocorrelation',xlab='lags',ylab='PACF',sub=mysub)
dev.off()
(myacf <- c(racf$acf))
(mypacf <- c(rpacf$acf))
lengthx <- length(x)
sqrtn <- sqrt(lengthx)
load(file='createtable')
a<-table.start()
a<-table.row.start(a)
a<-table.element(a,'Autocorrelation Function',4,TRUE)
a<-table.row.end(a)
a<-table.row.start(a)
a<-table.element(a,'Time lag k',header=TRUE)
a<-table.element(a,hyperlink('basics.htm','ACF(k)','click here for more information about the Autocorrelation Function'),header=TRUE)
a<-table.element(a,'T-STAT',header=TRUE)
a<-table.element(a,'P-value',header=TRUE)
a<-table.row.end(a)
for (i in 2:(par1+1)) {
a<-table.row.start(a)
a<-table.element(a,i-1,header=TRUE)
a<-table.element(a,round(myacf[i],6))
mytstat <- myacf[i]*sqrtn
a<-table.element(a,round(mytstat,4))
a<-table.element(a,round(1-pt(abs(mytstat),lengthx),6))
a<-table.row.end(a)
}
a<-table.end(a)
table.save(a,file='mytable.tab')
a<-table.start()
a<-table.row.start(a)
a<-table.element(a,'Partial Autocorrelation Function',4,TRUE)
a<-table.row.end(a)
a<-table.row.start(a)
a<-table.element(a,'Time lag k',header=TRUE)
a<-table.element(a,hyperlink('basics.htm','PACF(k)','click here for more information about the Partial Autocorrelation Function'),header=TRUE)
a<-table.element(a,'T-STAT',header=TRUE)
a<-table.element(a,'P-value',header=TRUE)
a<-table.row.end(a)
for (i in 1:par1) {
a<-table.row.start(a)
a<-table.element(a,i,header=TRUE)
a<-table.element(a,round(mypacf[i],6))
mytstat <- mypacf[i]*sqrtn
a<-table.element(a,round(mytstat,4))
a<-table.element(a,round(1-pt(abs(mytstat),lengthx),6))
a<-table.row.end(a)
}
a<-table.end(a)
table.save(a,file='mytable1.tab')