Free Statistics

of Irreproducible Research!

Author's title

Author*Unverified author*
R Software Modulerwasp_smp.wasp
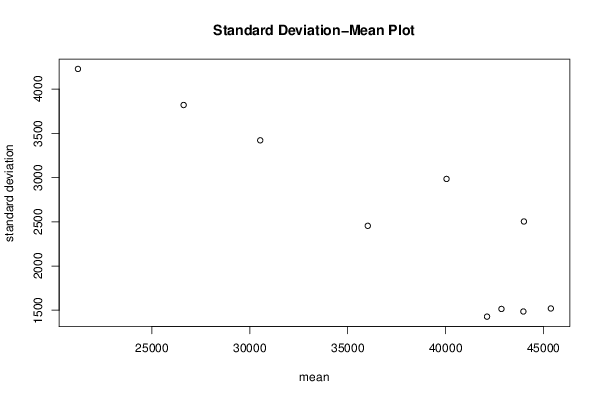
Title produced by softwareStandard Deviation-Mean Plot
Date of computationSat, 17 Aug 2013 13:56:16 -0400
Cite this page as followsStatistical Computations at FreeStatistics.org, Office for Research Development and Education, URL https://freestatistics.org/blog/index.php?v=date/2013/Aug/17/t1376762218pp0se6kk7ceybi7.htm/, Retrieved Sun, 28 Apr 2024 23:54:22 +0000
Statistical Computations at FreeStatistics.org, Office for Research Development and Education, URL https://freestatistics.org/blog/index.php?pk=211149, Retrieved Sun, 28 Apr 2024 23:54:22 +0000
QR Codes:

Original text written by user:
IsPrivate?No (this computation is public)
User-defined keywords
Estimated Impact181
Family? (F = Feedback message, R = changed R code, M = changed R Module, P = changed Parameters, D = changed Data)
-       [Standard Deviation-Mean Plot] [standard deviatio...] [2013-08-17 17:56:16] [3e2b14d12dd0cca2f2b67dfbdf2cdaf9] [Current]
Feedback Forum

Post a new message
Dataseries X:
42364
42206
42046
41715
44991
44818
42364
40733
40891
40891
41067
41382
41873
41873
41558
40733
44991
45640
44660
42364
43346
41873
42538
42855
43186
42364
42538
41382
44991
46131
45151
43346
45309
43186
45151
44991
45482
43678
45640
45482
48426
47762
45151
43835
45640
43186
44991
45309
45973
44502
45309
45800
47604
46131
44169
42046
44011
38611
41224
42695
44169
42046
42046
42046
43186
41558
39420
37631
38929
33862
36967
38771
39102
37298
37455
36967
38611
37455
35178
33531
36315
30269
34195
35984
35984
33862
31900
31742
33531
31900
28798
26660
28956
23558
28464
31075
31900
30096
27816
29447
30096
29604
24696
22418
24047
19140
24207
26011
27482
25029
22733
24047
24696
23398
18491
16353
18316
12918
18807
22418


Summary of computational transaction
Raw Inputview raw input (R code)
Raw Outputview raw output of R engine
Computing time2 seconds
R Server'George Udny Yule' @ yule.wessa.net

\begin{tabular}{lllllllll}
\hline
Summary of computational transaction \tabularnewline
Raw Input & view raw input (R code)  \tabularnewline
Raw Output & view raw output of R engine  \tabularnewline
Computing time & 2 seconds \tabularnewline
R Server & 'George Udny Yule' @ yule.wessa.net \tabularnewline
\hline
\end{tabular}
%Source: https://freestatistics.org/blog/index.php?pk=211149&T=0

[TABLE]
[ROW][C]Summary of computational transaction[/C][/ROW]
[ROW][C]Raw Input[/C][C]view raw input (R code) [/C][/ROW]
[ROW][C]Raw Output[/C][C]view raw output of R engine [/C][/ROW]
[ROW][C]Computing time[/C][C]2 seconds[/C][/ROW]
[ROW][C]R Server[/C][C]'George Udny Yule' @ yule.wessa.net[/C][/ROW]
[/TABLE]
Source: https://freestatistics.org/blog/index.php?pk=211149&T=0

Globally Unique Identifier (entire table): ba.freestatistics.org/blog/index.php?pk=211149&T=0

As an alternative you can also use a QR Code:  

The GUIDs for individual cells are displayed in the table below:

Summary of computational transaction
Raw Inputview raw input (R code)
Raw Outputview raw output of R engine
Computing time2 seconds
R Server'George Udny Yule' @ yule.wessa.net


Standard Deviation-Mean Plot
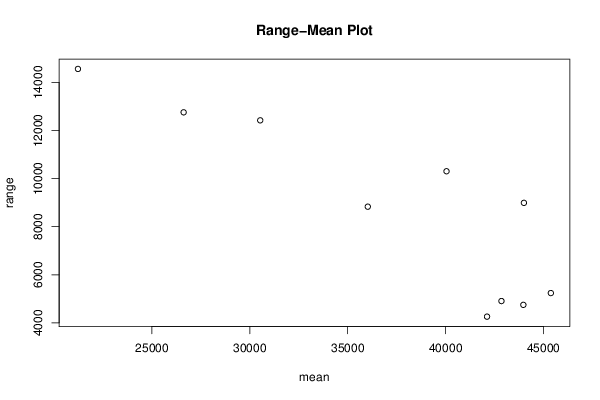
SectionMeanStandard DeviationRange
142122.33333333331427.51700090714258
242858.66666666671514.694708713964907
343977.16666666671485.778695948134749
445381.83333333331519.996281893385240
544006.252503.180563167228993
640052.58333333332984.2596906963610307
7360302454.242708602248833
830535.83333333333420.5932721288812426
926623.16666666673819.7190718531612760
10212244227.3741473659714564

\begin{tabular}{lllllllll}
\hline
Standard Deviation-Mean Plot \tabularnewline
Section & Mean & Standard Deviation & Range \tabularnewline
1 & 42122.3333333333 & 1427.5170009071 & 4258 \tabularnewline
2 & 42858.6666666667 & 1514.69470871396 & 4907 \tabularnewline
3 & 43977.1666666667 & 1485.77869594813 & 4749 \tabularnewline
4 & 45381.8333333333 & 1519.99628189338 & 5240 \tabularnewline
5 & 44006.25 & 2503.18056316722 & 8993 \tabularnewline
6 & 40052.5833333333 & 2984.25969069636 & 10307 \tabularnewline
7 & 36030 & 2454.24270860224 & 8833 \tabularnewline
8 & 30535.8333333333 & 3420.59327212888 & 12426 \tabularnewline
9 & 26623.1666666667 & 3819.71907185316 & 12760 \tabularnewline
10 & 21224 & 4227.37414736597 & 14564 \tabularnewline
\hline
\end{tabular}
%Source: https://freestatistics.org/blog/index.php?pk=211149&T=1

[TABLE]
[ROW][C]Standard Deviation-Mean Plot[/C][/ROW]
[ROW][C]Section[/C][C]Mean[/C][C]Standard Deviation[/C][C]Range[/C][/ROW]
[ROW][C]1[/C][C]42122.3333333333[/C][C]1427.5170009071[/C][C]4258[/C][/ROW]
[ROW][C]2[/C][C]42858.6666666667[/C][C]1514.69470871396[/C][C]4907[/C][/ROW]
[ROW][C]3[/C][C]43977.1666666667[/C][C]1485.77869594813[/C][C]4749[/C][/ROW]
[ROW][C]4[/C][C]45381.8333333333[/C][C]1519.99628189338[/C][C]5240[/C][/ROW]
[ROW][C]5[/C][C]44006.25[/C][C]2503.18056316722[/C][C]8993[/C][/ROW]
[ROW][C]6[/C][C]40052.5833333333[/C][C]2984.25969069636[/C][C]10307[/C][/ROW]
[ROW][C]7[/C][C]36030[/C][C]2454.24270860224[/C][C]8833[/C][/ROW]
[ROW][C]8[/C][C]30535.8333333333[/C][C]3420.59327212888[/C][C]12426[/C][/ROW]
[ROW][C]9[/C][C]26623.1666666667[/C][C]3819.71907185316[/C][C]12760[/C][/ROW]
[ROW][C]10[/C][C]21224[/C][C]4227.37414736597[/C][C]14564[/C][/ROW]
[/TABLE]
Source: https://freestatistics.org/blog/index.php?pk=211149&T=1

Globally Unique Identifier (entire table): ba.freestatistics.org/blog/index.php?pk=211149&T=1

As an alternative you can also use a QR Code:  

The GUIDs for individual cells are displayed in the table below:

Standard Deviation-Mean Plot
SectionMeanStandard DeviationRange
142122.33333333331427.51700090714258
242858.66666666671514.694708713964907
343977.16666666671485.778695948134749
445381.83333333331519.996281893385240
544006.252503.180563167228993
640052.58333333332984.2596906963610307
7360302454.242708602248833
830535.83333333333420.5932721288812426
926623.16666666673819.7190718531612760
10212244227.3741473659714564


Regression: S.E.(k) = alpha + beta * Mean(k)
alpha6754.1061047826
beta-0.113150123292446
S.D.0.0185881289141975
T-STAT-6.08722501413377
p-value0.000293577619473061

\begin{tabular}{lllllllll}
\hline
Regression: S.E.(k) = alpha + beta * Mean(k) \tabularnewline
alpha & 6754.1061047826 \tabularnewline
beta & -0.113150123292446 \tabularnewline
S.D. & 0.0185881289141975 \tabularnewline
T-STAT & -6.08722501413377 \tabularnewline
p-value & 0.000293577619473061 \tabularnewline
\hline
\end{tabular}
%Source: https://freestatistics.org/blog/index.php?pk=211149&T=2

[TABLE]
[ROW][C]Regression: S.E.(k) = alpha + beta * Mean(k)[/C][/ROW]
[ROW][C]alpha[/C][C]6754.1061047826[/C][/ROW]
[ROW][C]beta[/C][C]-0.113150123292446[/C][/ROW]
[ROW][C]S.D.[/C][C]0.0185881289141975[/C][/ROW]
[ROW][C]T-STAT[/C][C]-6.08722501413377[/C][/ROW]
[ROW][C]p-value[/C][C]0.000293577619473061[/C][/ROW]
[/TABLE]
Source: https://freestatistics.org/blog/index.php?pk=211149&T=2

Globally Unique Identifier (entire table): ba.freestatistics.org/blog/index.php?pk=211149&T=2

As an alternative you can also use a QR Code:  

The GUIDs for individual cells are displayed in the table below:

Regression: S.E.(k) = alpha + beta * Mean(k)
alpha6754.1061047826
beta-0.113150123292446
S.D.0.0185881289141975
T-STAT-6.08722501413377
p-value0.000293577619473061


Regression: ln S.E.(k) = alpha + beta * ln Mean(k)
alpha22.308483294442
beta-1.38586392421411
S.D.0.316578285344318
T-STAT-4.37763418519629
p-value0.00235624547935005
Lambda2.38586392421411

\begin{tabular}{lllllllll}
\hline
Regression: ln S.E.(k) = alpha + beta * ln Mean(k) \tabularnewline
alpha & 22.308483294442 \tabularnewline
beta & -1.38586392421411 \tabularnewline
S.D. & 0.316578285344318 \tabularnewline
T-STAT & -4.37763418519629 \tabularnewline
p-value & 0.00235624547935005 \tabularnewline
Lambda & 2.38586392421411 \tabularnewline
\hline
\end{tabular}
%Source: https://freestatistics.org/blog/index.php?pk=211149&T=3

[TABLE]
[ROW][C]Regression: ln S.E.(k) = alpha + beta * ln Mean(k)[/C][/ROW]
[ROW][C]alpha[/C][C]22.308483294442[/C][/ROW]
[ROW][C]beta[/C][C]-1.38586392421411[/C][/ROW]
[ROW][C]S.D.[/C][C]0.316578285344318[/C][/ROW]
[ROW][C]T-STAT[/C][C]-4.37763418519629[/C][/ROW]
[ROW][C]p-value[/C][C]0.00235624547935005[/C][/ROW]
[ROW][C]Lambda[/C][C]2.38586392421411[/C][/ROW]
[/TABLE]
Source: https://freestatistics.org/blog/index.php?pk=211149&T=3

Globally Unique Identifier (entire table): ba.freestatistics.org/blog/index.php?pk=211149&T=3

As an alternative you can also use a QR Code:  

The GUIDs for individual cells are displayed in the table below:

Regression: ln S.E.(k) = alpha + beta * ln Mean(k)
alpha22.308483294442
beta-1.38586392421411
S.D.0.316578285344318
T-STAT-4.37763418519629
p-value0.00235624547935005
Lambda2.38586392421411


Parameters (Session):
par1 = 12 ;
Parameters (R input):
par1 = 12 ;
R code (references can be found in the software module):
par1 <- as.numeric(par1)
(n <- length(x))
(np <- floor(n / par1))
arr <- array(NA,dim=c(par1,np))
j <- 0
k <- 1
for (i in 1:(np*par1))
{
j = j + 1
arr[j,k] <- x[i]
if (j == par1) {
j = 0
k=k+1
}
}
arr
arr.mean <- array(NA,dim=np)
arr.sd <- array(NA,dim=np)
arr.range <- array(NA,dim=np)
for (j in 1:np)
{
arr.mean[j] <- mean(arr[,j],na.rm=TRUE)
arr.sd[j] <- sd(arr[,j],na.rm=TRUE)
arr.range[j] <- max(arr[,j],na.rm=TRUE) - min(arr[,j],na.rm=TRUE)
}
arr.mean
arr.sd
arr.range
(lm1 <- lm(arr.sd~arr.mean))
(lnlm1 <- lm(log(arr.sd)~log(arr.mean)))
(lm2 <- lm(arr.range~arr.mean))
bitmap(file='test1.png')
plot(arr.mean,arr.sd,main='Standard Deviation-Mean Plot',xlab='mean',ylab='standard deviation')
dev.off()
bitmap(file='test2.png')
plot(arr.mean,arr.range,main='Range-Mean Plot',xlab='mean',ylab='range')
dev.off()
load(file='createtable')
a<-table.start()
a<-table.row.start(a)
a<-table.element(a,'Standard Deviation-Mean Plot',4,TRUE)
a<-table.row.end(a)
a<-table.row.start(a)
a<-table.element(a,'Section',header=TRUE)
a<-table.element(a,'Mean',header=TRUE)
a<-table.element(a,'Standard Deviation',header=TRUE)
a<-table.element(a,'Range',header=TRUE)
a<-table.row.end(a)
for (j in 1:np) {
a<-table.row.start(a)
a<-table.element(a,j,header=TRUE)
a<-table.element(a,arr.mean[j])
a<-table.element(a,arr.sd[j] )
a<-table.element(a,arr.range[j] )
a<-table.row.end(a)
}
a<-table.end(a)
table.save(a,file='mytable.tab')
a<-table.start()
a<-table.row.start(a)
a<-table.element(a,'Regression: S.E.(k) = alpha + beta * Mean(k)',2,TRUE)
a<-table.row.end(a)
a<-table.row.start(a)
a<-table.element(a,'alpha',header=TRUE)
a<-table.element(a,lm1$coefficients[[1]])
a<-table.row.end(a)
a<-table.row.start(a)
a<-table.element(a,'beta',header=TRUE)
a<-table.element(a,lm1$coefficients[[2]])
a<-table.row.end(a)
a<-table.row.start(a)
a<-table.element(a,'S.D.',header=TRUE)
a<-table.element(a,summary(lm1)$coefficients[2,2])
a<-table.row.end(a)
a<-table.row.start(a)
a<-table.element(a,'T-STAT',header=TRUE)
a<-table.element(a,summary(lm1)$coefficients[2,3])
a<-table.row.end(a)
a<-table.row.start(a)
a<-table.element(a,'p-value',header=TRUE)
a<-table.element(a,summary(lm1)$coefficients[2,4])
a<-table.row.end(a)
a<-table.end(a)
table.save(a,file='mytable1.tab')
a<-table.start()
a<-table.row.start(a)
a<-table.element(a,'Regression: ln S.E.(k) = alpha + beta * ln Mean(k)',2,TRUE)
a<-table.row.end(a)
a<-table.row.start(a)
a<-table.element(a,'alpha',header=TRUE)
a<-table.element(a,lnlm1$coefficients[[1]])
a<-table.row.end(a)
a<-table.row.start(a)
a<-table.element(a,'beta',header=TRUE)
a<-table.element(a,lnlm1$coefficients[[2]])
a<-table.row.end(a)
a<-table.row.start(a)
a<-table.element(a,'S.D.',header=TRUE)
a<-table.element(a,summary(lnlm1)$coefficients[2,2])
a<-table.row.end(a)
a<-table.row.start(a)
a<-table.element(a,'T-STAT',header=TRUE)
a<-table.element(a,summary(lnlm1)$coefficients[2,3])
a<-table.row.end(a)
a<-table.row.start(a)
a<-table.element(a,'p-value',header=TRUE)
a<-table.element(a,summary(lnlm1)$coefficients[2,4])
a<-table.row.end(a)
a<-table.row.start(a)
a<-table.element(a,'Lambda',header=TRUE)
a<-table.element(a,1-lnlm1$coefficients[[2]])
a<-table.row.end(a)
a<-table.end(a)
table.save(a,file='mytable2.tab')