Free Statistics

of Irreproducible Research!

Author's title

Author*Unverified author*
R Software Modulerwasp_smp.wasp
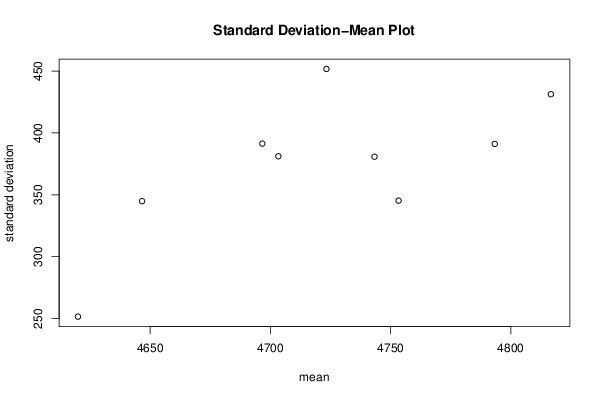
Title produced by softwareStandard Deviation-Mean Plot
Date of computationSun, 18 Aug 2013 08:07:10 -0400
Cite this page as followsStatistical Computations at FreeStatistics.org, Office for Research Development and Education, URL https://freestatistics.org/blog/index.php?v=date/2013/Aug/18/t1376827650zrj80d27tb0lmrn.htm/, Retrieved Sun, 05 May 2024 21:14:23 +0000
Statistical Computations at FreeStatistics.org, Office for Research Development and Education, URL https://freestatistics.org/blog/index.php?pk=211178, Retrieved Sun, 05 May 2024 21:14:23 +0000
QR Codes:

Original text written by user:
IsPrivate?No (this computation is public)
User-defined keywordsDe Laere Dieter
Estimated Impact141
Family? (F = Feedback message, R = changed R code, M = changed R Module, P = changed Parameters, D = changed Data)
-       [Standard Deviation-Mean Plot] [Tijdreeks 2 - Sta...] [2013-08-18 12:07:10] [bc2cf5f41ec5ca561b7a550898b8dd0d] [Current]
Feedback Forum

Post a new message
Dataseries X:
4640
4880
4400
4120
4440
4640
4680
4360
4640
4840
5000
4800
4720
4840
3800
4280
4480
4880
4680
4480
4720
5000
4960
4920
4480
5320
3960
4440
4360
4840
4880
4880
4400
4800
5280
4720
4440
5200
4240
4520
4640
5040
4840
4760
4520
4680
5480
4680
4160
5360
4200
4520
4600
4880
4840
4600
4520
4600
5760
4640
4520
5400
4200
4600
4480
4680
4400
4480
4840
4680
5480
4680
4440
5280
4240
4600
4640
4920
4560
4400
5080
4640
5520
4600
4720
5480
4320
4640
4920
4840
4520
4440
5000
4840
5480
4320
4880
5440
4480
4600
4720
5000
4160
4720
5000
4480
5720
4600


Summary of computational transaction
Raw Inputview raw input (R code)
Raw Outputview raw output of R engine
Computing time2 seconds
R Server'Sir Ronald Aylmer Fisher' @ fisher.wessa.net

\begin{tabular}{lllllllll}
\hline
Summary of computational transaction \tabularnewline
Raw Input & view raw input (R code)  \tabularnewline
Raw Output & view raw output of R engine  \tabularnewline
Computing time & 2 seconds \tabularnewline
R Server & 'Sir Ronald Aylmer Fisher' @ fisher.wessa.net \tabularnewline
\hline
\end{tabular}
%Source: https://freestatistics.org/blog/index.php?pk=211178&T=0

[TABLE]
[ROW][C]Summary of computational transaction[/C][/ROW]
[ROW][C]Raw Input[/C][C]view raw input (R code) [/C][/ROW]
[ROW][C]Raw Output[/C][C]view raw output of R engine [/C][/ROW]
[ROW][C]Computing time[/C][C]2 seconds[/C][/ROW]
[ROW][C]R Server[/C][C]'Sir Ronald Aylmer Fisher' @ fisher.wessa.net[/C][/ROW]
[/TABLE]
Source: https://freestatistics.org/blog/index.php?pk=211178&T=0

Globally Unique Identifier (entire table): ba.freestatistics.org/blog/index.php?pk=211178&T=0

As an alternative you can also use a QR Code:  

The GUIDs for individual cells are displayed in the table below:

Summary of computational transaction
Raw Inputview raw input (R code)
Raw Outputview raw output of R engine
Computing time2 seconds
R Server'Sir Ronald Aylmer Fisher' @ fisher.wessa.net


Standard Deviation-Mean Plot
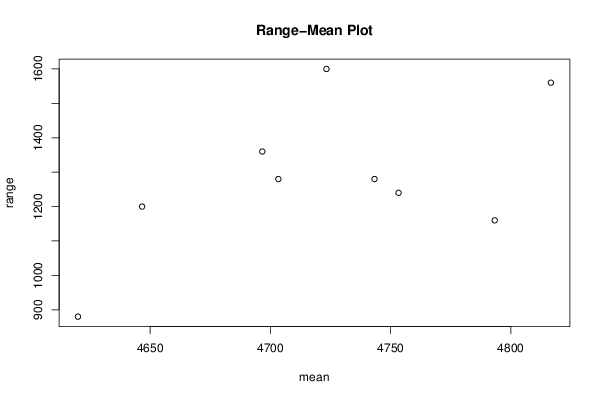
SectionMeanStandard DeviationRange
14620251.5407069894880
24646.66666666667344.8671241700681200
34696.66666666667391.3457744137721360
44753.33333333333345.2886363960481240
54723.33333333333451.7306786799031600
64703.33333333333381.1783961571931280
74743.33333333333380.796613175671280
84793.33333333333391.1134067884881160
94816.66666666667431.3052775288551560

\begin{tabular}{lllllllll}
\hline
Standard Deviation-Mean Plot \tabularnewline
Section & Mean & Standard Deviation & Range \tabularnewline
1 & 4620 & 251.5407069894 & 880 \tabularnewline
2 & 4646.66666666667 & 344.867124170068 & 1200 \tabularnewline
3 & 4696.66666666667 & 391.345774413772 & 1360 \tabularnewline
4 & 4753.33333333333 & 345.288636396048 & 1240 \tabularnewline
5 & 4723.33333333333 & 451.730678679903 & 1600 \tabularnewline
6 & 4703.33333333333 & 381.178396157193 & 1280 \tabularnewline
7 & 4743.33333333333 & 380.79661317567 & 1280 \tabularnewline
8 & 4793.33333333333 & 391.113406788488 & 1160 \tabularnewline
9 & 4816.66666666667 & 431.305277528855 & 1560 \tabularnewline
\hline
\end{tabular}
%Source: https://freestatistics.org/blog/index.php?pk=211178&T=1

[TABLE]
[ROW][C]Standard Deviation-Mean Plot[/C][/ROW]
[ROW][C]Section[/C][C]Mean[/C][C]Standard Deviation[/C][C]Range[/C][/ROW]
[ROW][C]1[/C][C]4620[/C][C]251.5407069894[/C][C]880[/C][/ROW]
[ROW][C]2[/C][C]4646.66666666667[/C][C]344.867124170068[/C][C]1200[/C][/ROW]
[ROW][C]3[/C][C]4696.66666666667[/C][C]391.345774413772[/C][C]1360[/C][/ROW]
[ROW][C]4[/C][C]4753.33333333333[/C][C]345.288636396048[/C][C]1240[/C][/ROW]
[ROW][C]5[/C][C]4723.33333333333[/C][C]451.730678679903[/C][C]1600[/C][/ROW]
[ROW][C]6[/C][C]4703.33333333333[/C][C]381.178396157193[/C][C]1280[/C][/ROW]
[ROW][C]7[/C][C]4743.33333333333[/C][C]380.79661317567[/C][C]1280[/C][/ROW]
[ROW][C]8[/C][C]4793.33333333333[/C][C]391.113406788488[/C][C]1160[/C][/ROW]
[ROW][C]9[/C][C]4816.66666666667[/C][C]431.305277528855[/C][C]1560[/C][/ROW]
[/TABLE]
Source: https://freestatistics.org/blog/index.php?pk=211178&T=1

Globally Unique Identifier (entire table): ba.freestatistics.org/blog/index.php?pk=211178&T=1

As an alternative you can also use a QR Code:  

The GUIDs for individual cells are displayed in the table below:

Standard Deviation-Mean Plot
SectionMeanStandard DeviationRange
14620251.5407069894880
24646.66666666667344.8671241700681200
34696.66666666667391.3457744137721360
44753.33333333333345.2886363960481240
54723.33333333333451.7306786799031600
64703.33333333333381.1783961571931280
74743.33333333333380.796613175671280
84793.33333333333391.1134067884881160
94816.66666666667431.3052775288551560


Regression: S.E.(k) = alpha + beta * Mean(k)
alpha-2541.77729696227
beta0.617581668059296
S.D.0.250207491918768
T-STAT2.46827808121668
p-value0.0429411900044206

\begin{tabular}{lllllllll}
\hline
Regression: S.E.(k) = alpha + beta * Mean(k) \tabularnewline
alpha & -2541.77729696227 \tabularnewline
beta & 0.617581668059296 \tabularnewline
S.D. & 0.250207491918768 \tabularnewline
T-STAT & 2.46827808121668 \tabularnewline
p-value & 0.0429411900044206 \tabularnewline
\hline
\end{tabular}
%Source: https://freestatistics.org/blog/index.php?pk=211178&T=2

[TABLE]
[ROW][C]Regression: S.E.(k) = alpha + beta * Mean(k)[/C][/ROW]
[ROW][C]alpha[/C][C]-2541.77729696227[/C][/ROW]
[ROW][C]beta[/C][C]0.617581668059296[/C][/ROW]
[ROW][C]S.D.[/C][C]0.250207491918768[/C][/ROW]
[ROW][C]T-STAT[/C][C]2.46827808121668[/C][/ROW]
[ROW][C]p-value[/C][C]0.0429411900044206[/C][/ROW]
[/TABLE]
Source: https://freestatistics.org/blog/index.php?pk=211178&T=2

Globally Unique Identifier (entire table): ba.freestatistics.org/blog/index.php?pk=211178&T=2

As an alternative you can also use a QR Code:  

The GUIDs for individual cells are displayed in the table below:

Regression: S.E.(k) = alpha + beta * Mean(k)
alpha-2541.77729696227
beta0.617581668059296
S.D.0.250207491918768
T-STAT2.46827808121668
p-value0.0429411900044206


Regression: ln S.E.(k) = alpha + beta * ln Mean(k)
alpha-67.7719973762082
beta8.70996762455412
S.D.3.40782890293441
T-STAT2.55586999014362
p-value0.037778574719673
Lambda-7.70996762455412

\begin{tabular}{lllllllll}
\hline
Regression: ln S.E.(k) = alpha + beta * ln Mean(k) \tabularnewline
alpha & -67.7719973762082 \tabularnewline
beta & 8.70996762455412 \tabularnewline
S.D. & 3.40782890293441 \tabularnewline
T-STAT & 2.55586999014362 \tabularnewline
p-value & 0.037778574719673 \tabularnewline
Lambda & -7.70996762455412 \tabularnewline
\hline
\end{tabular}
%Source: https://freestatistics.org/blog/index.php?pk=211178&T=3

[TABLE]
[ROW][C]Regression: ln S.E.(k) = alpha + beta * ln Mean(k)[/C][/ROW]
[ROW][C]alpha[/C][C]-67.7719973762082[/C][/ROW]
[ROW][C]beta[/C][C]8.70996762455412[/C][/ROW]
[ROW][C]S.D.[/C][C]3.40782890293441[/C][/ROW]
[ROW][C]T-STAT[/C][C]2.55586999014362[/C][/ROW]
[ROW][C]p-value[/C][C]0.037778574719673[/C][/ROW]
[ROW][C]Lambda[/C][C]-7.70996762455412[/C][/ROW]
[/TABLE]
Source: https://freestatistics.org/blog/index.php?pk=211178&T=3

Globally Unique Identifier (entire table): ba.freestatistics.org/blog/index.php?pk=211178&T=3

As an alternative you can also use a QR Code:  

The GUIDs for individual cells are displayed in the table below:

Regression: ln S.E.(k) = alpha + beta * ln Mean(k)
alpha-67.7719973762082
beta8.70996762455412
S.D.3.40782890293441
T-STAT2.55586999014362
p-value0.037778574719673
Lambda-7.70996762455412


Parameters (Session):
par1 = 12 ;
Parameters (R input):
par1 = 12 ;
R code (references can be found in the software module):
par1 <- as.numeric(par1)
(n <- length(x))
(np <- floor(n / par1))
arr <- array(NA,dim=c(par1,np))
j <- 0
k <- 1
for (i in 1:(np*par1))
{
j = j + 1
arr[j,k] <- x[i]
if (j == par1) {
j = 0
k=k+1
}
}
arr
arr.mean <- array(NA,dim=np)
arr.sd <- array(NA,dim=np)
arr.range <- array(NA,dim=np)
for (j in 1:np)
{
arr.mean[j] <- mean(arr[,j],na.rm=TRUE)
arr.sd[j] <- sd(arr[,j],na.rm=TRUE)
arr.range[j] <- max(arr[,j],na.rm=TRUE) - min(arr[,j],na.rm=TRUE)
}
arr.mean
arr.sd
arr.range
(lm1 <- lm(arr.sd~arr.mean))
(lnlm1 <- lm(log(arr.sd)~log(arr.mean)))
(lm2 <- lm(arr.range~arr.mean))
bitmap(file='test1.png')
plot(arr.mean,arr.sd,main='Standard Deviation-Mean Plot',xlab='mean',ylab='standard deviation')
dev.off()
bitmap(file='test2.png')
plot(arr.mean,arr.range,main='Range-Mean Plot',xlab='mean',ylab='range')
dev.off()
load(file='createtable')
a<-table.start()
a<-table.row.start(a)
a<-table.element(a,'Standard Deviation-Mean Plot',4,TRUE)
a<-table.row.end(a)
a<-table.row.start(a)
a<-table.element(a,'Section',header=TRUE)
a<-table.element(a,'Mean',header=TRUE)
a<-table.element(a,'Standard Deviation',header=TRUE)
a<-table.element(a,'Range',header=TRUE)
a<-table.row.end(a)
for (j in 1:np) {
a<-table.row.start(a)
a<-table.element(a,j,header=TRUE)
a<-table.element(a,arr.mean[j])
a<-table.element(a,arr.sd[j] )
a<-table.element(a,arr.range[j] )
a<-table.row.end(a)
}
a<-table.end(a)
table.save(a,file='mytable.tab')
a<-table.start()
a<-table.row.start(a)
a<-table.element(a,'Regression: S.E.(k) = alpha + beta * Mean(k)',2,TRUE)
a<-table.row.end(a)
a<-table.row.start(a)
a<-table.element(a,'alpha',header=TRUE)
a<-table.element(a,lm1$coefficients[[1]])
a<-table.row.end(a)
a<-table.row.start(a)
a<-table.element(a,'beta',header=TRUE)
a<-table.element(a,lm1$coefficients[[2]])
a<-table.row.end(a)
a<-table.row.start(a)
a<-table.element(a,'S.D.',header=TRUE)
a<-table.element(a,summary(lm1)$coefficients[2,2])
a<-table.row.end(a)
a<-table.row.start(a)
a<-table.element(a,'T-STAT',header=TRUE)
a<-table.element(a,summary(lm1)$coefficients[2,3])
a<-table.row.end(a)
a<-table.row.start(a)
a<-table.element(a,'p-value',header=TRUE)
a<-table.element(a,summary(lm1)$coefficients[2,4])
a<-table.row.end(a)
a<-table.end(a)
table.save(a,file='mytable1.tab')
a<-table.start()
a<-table.row.start(a)
a<-table.element(a,'Regression: ln S.E.(k) = alpha + beta * ln Mean(k)',2,TRUE)
a<-table.row.end(a)
a<-table.row.start(a)
a<-table.element(a,'alpha',header=TRUE)
a<-table.element(a,lnlm1$coefficients[[1]])
a<-table.row.end(a)
a<-table.row.start(a)
a<-table.element(a,'beta',header=TRUE)
a<-table.element(a,lnlm1$coefficients[[2]])
a<-table.row.end(a)
a<-table.row.start(a)
a<-table.element(a,'S.D.',header=TRUE)
a<-table.element(a,summary(lnlm1)$coefficients[2,2])
a<-table.row.end(a)
a<-table.row.start(a)
a<-table.element(a,'T-STAT',header=TRUE)
a<-table.element(a,summary(lnlm1)$coefficients[2,3])
a<-table.row.end(a)
a<-table.row.start(a)
a<-table.element(a,'p-value',header=TRUE)
a<-table.element(a,summary(lnlm1)$coefficients[2,4])
a<-table.row.end(a)
a<-table.row.start(a)
a<-table.element(a,'Lambda',header=TRUE)
a<-table.element(a,1-lnlm1$coefficients[[2]])
a<-table.row.end(a)
a<-table.end(a)
table.save(a,file='mytable2.tab')