Free Statistics

of Irreproducible Research!

Author's title

Author*Unverified author*
R Software Modulerwasp_autocorrelation.wasp
Title produced by software(Partial) Autocorrelation Function
Date of computationSun, 18 Aug 2013 09:28:05 -0400
Cite this page as followsStatistical Computations at FreeStatistics.org, Office for Research Development and Education, URL https://freestatistics.org/blog/index.php?v=date/2013/Aug/18/t1376832545gqtphjixbdqlm1g.htm/, Retrieved Sun, 05 May 2024 23:06:36 +0000
Statistical Computations at FreeStatistics.org, Office for Research Development and Education, URL https://freestatistics.org/blog/index.php?pk=211184, Retrieved Sun, 05 May 2024 23:06:36 +0000
QR Codes:

Original text written by user:
IsPrivate?No (this computation is public)
User-defined keywordsJespers Eva
Estimated Impact176
Family? (F = Feedback message, R = changed R code, M = changed R Module, P = changed Parameters, D = changed Data)
-     [Histogram] [Tijdreeks A - Stap 3] [2013-08-18 09:07:17] [b1b8dc218b2120b615e99c976a670bd0]
- RMPD  [Harrell-Davis Quantiles] [Tijdreeks A - Sta...] [2013-08-18 11:01:33] [b1b8dc218b2120b615e99c976a670bd0]
- RMP     [Mean Plot] [Tijdreeks A - Sta...] [2013-08-18 13:01:51] [b1b8dc218b2120b615e99c976a670bd0]
- RMP         [(Partial) Autocorrelation Function] [Tijdreeks A - Sta...] [2013-08-18 13:28:05] [987ccabfb1247e6edeac48c68eb55107] [Current]
Feedback Forum

Post a new message
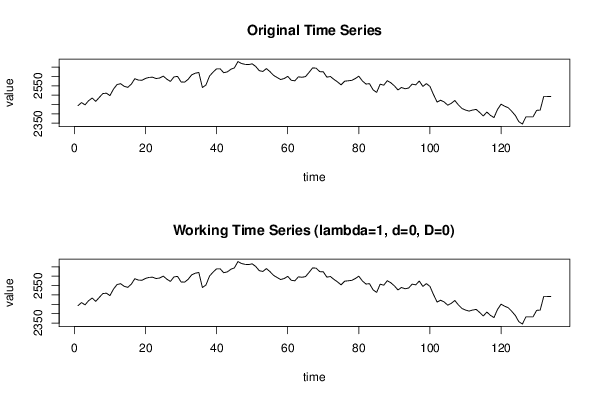
Dataseries X:
2443.6
2460.2
2448.2
2470.4
2484.7
2466.8
2487.9
2508.4
2510.5
2497.4
2532.5
2556.8
2561
2547.3
2541.5
2558.5
2587.9
2580.5
2579.6
2589.3
2595
2595.6
2588.8
2591.7
2601.7
2585.4
2573.3
2597.4
2600.6
2570.6
2569.4
2584.9
2608.8
2617.2
2621
2540.5
2554.5
2601.9
2623
2640.7
2640.7
2619.8
2624.2
2638.2
2645.7
2679.6
2669
2664.6
2663.3
2667.4
2653.2
2630.8
2626.6
2641.9
2625.8
2606
2594.4
2583.6
2588.7
2600.3
2579.5
2576.6
2597.8
2595.6
2599
2621.7
2645.6
2644.2
2625.6
2624.6
2596.2
2599.5
2584.1
2570.8
2555
2574.5
2576.7
2579
2588.7
2601.1
2575.7
2559.5
2561.1
2528.3
2514.7
2558.5
2553.3
2577.1
2566
2549.5
2527.8
2540.9
2534.2
2538
2559
2554.9
2575.5
2546.5
2561.6
2546.6
2502.9
2463.1
2472.6
2463.5
2446.3
2456.2
2471.5
2447.5
2428.6
2420.2
2414.9
2420.2
2423.8
2407
2388.7
2409.6
2392
2380.2
2423.3
2451.6
2440.8
2432.9
2413.6
2391.6
2358.1
2345.4
2384.4
2384.4
2384.4
2418.7
2420
2493.1
2493.1
2492.8


Summary of computational transaction
Raw Inputview raw input (R code)
Raw Outputview raw output of R engine
Computing time2 seconds
R Server'Sir Maurice George Kendall' @ kendall.wessa.net

\begin{tabular}{lllllllll}
\hline
Summary of computational transaction \tabularnewline
Raw Input & view raw input (R code)  \tabularnewline
Raw Output & view raw output of R engine  \tabularnewline
Computing time & 2 seconds \tabularnewline
R Server & 'Sir Maurice George Kendall' @ kendall.wessa.net \tabularnewline
\hline
\end{tabular}
%Source: https://freestatistics.org/blog/index.php?pk=211184&T=0

[TABLE]
[ROW][C]Summary of computational transaction[/C][/ROW]
[ROW][C]Raw Input[/C][C]view raw input (R code) [/C][/ROW]
[ROW][C]Raw Output[/C][C]view raw output of R engine [/C][/ROW]
[ROW][C]Computing time[/C][C]2 seconds[/C][/ROW]
[ROW][C]R Server[/C][C]'Sir Maurice George Kendall' @ kendall.wessa.net[/C][/ROW]
[/TABLE]
Source: https://freestatistics.org/blog/index.php?pk=211184&T=0

Globally Unique Identifier (entire table): ba.freestatistics.org/blog/index.php?pk=211184&T=0

As an alternative you can also use a QR Code:  

The GUIDs for individual cells are displayed in the table below:

Summary of computational transaction
Raw Inputview raw input (R code)
Raw Outputview raw output of R engine
Computing time2 seconds
R Server'Sir Maurice George Kendall' @ kendall.wessa.net


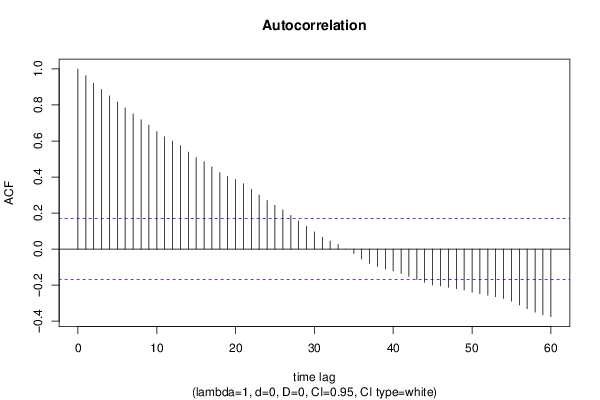
Autocorrelation Function
Time lag kACF(k)T-STATP-value
10.96198811.13580
20.92057410.65640
30.88611210.25750
40.8500059.83950
50.8165719.45250
60.7833599.0680
70.7496788.67820
80.7184468.31660
90.6872437.95540
100.6523967.5520
110.6240627.2240
120.5995926.94080
130.5733856.63740
140.5383716.23210
150.5076245.87620
160.4848795.61290
170.4563125.28220
180.4246534.91571e-06
190.4029444.66444e-06
200.3863534.47248e-06
210.3625974.19742.4e-05
220.3316653.83939.5e-05
230.3004213.47760.000341
240.2697173.12220.0011
250.242852.81120.002838
260.2169152.5110.006614
270.186672.16090.016242
280.1560931.80690.03651
290.1267561.46730.072318
300.0951341.10130.136381
310.0653160.75610.225464
320.044250.51220.304666
330.0259270.30010.382273
34-0.000531-0.00620.49755
35-0.023786-0.27530.391738
36-0.055057-0.63730.262497
37-0.079592-0.92130.179264
38-0.096697-1.11930.132497
39-0.109935-1.27260.102684
40-0.121282-1.40390.081324
41-0.134921-1.56180.060344
42-0.151538-1.75420.040843
43-0.169215-1.95880.026106
44-0.184857-2.13990.017088
45-0.199068-2.30440.01137
46-0.204384-2.36590.009709
47-0.211863-2.45250.007736
48-0.2198-2.54440.006041
49-0.227447-2.63290.00473
50-0.239017-2.76680.003231
51-0.247181-2.86130.002448
52-0.256021-2.96370.001799
53-0.264211-3.05850.001344
54-0.274306-3.17530.000929
55-0.28917-3.34740.00053
56-0.31006-3.58920.000232
57-0.330733-3.82859.9e-05
58-0.350141-4.05324.3e-05
59-0.364329-4.21742.3e-05
60-0.375115-4.34231.4e-05

\begin{tabular}{lllllllll}
\hline
Autocorrelation Function \tabularnewline
Time lag k & ACF(k) & T-STAT & P-value \tabularnewline
1 & 0.961988 & 11.1358 & 0 \tabularnewline
2 & 0.920574 & 10.6564 & 0 \tabularnewline
3 & 0.886112 & 10.2575 & 0 \tabularnewline
4 & 0.850005 & 9.8395 & 0 \tabularnewline
5 & 0.816571 & 9.4525 & 0 \tabularnewline
6 & 0.783359 & 9.068 & 0 \tabularnewline
7 & 0.749678 & 8.6782 & 0 \tabularnewline
8 & 0.718446 & 8.3166 & 0 \tabularnewline
9 & 0.687243 & 7.9554 & 0 \tabularnewline
10 & 0.652396 & 7.552 & 0 \tabularnewline
11 & 0.624062 & 7.224 & 0 \tabularnewline
12 & 0.599592 & 6.9408 & 0 \tabularnewline
13 & 0.573385 & 6.6374 & 0 \tabularnewline
14 & 0.538371 & 6.2321 & 0 \tabularnewline
15 & 0.507624 & 5.8762 & 0 \tabularnewline
16 & 0.484879 & 5.6129 & 0 \tabularnewline
17 & 0.456312 & 5.2822 & 0 \tabularnewline
18 & 0.424653 & 4.9157 & 1e-06 \tabularnewline
19 & 0.402944 & 4.6644 & 4e-06 \tabularnewline
20 & 0.386353 & 4.4724 & 8e-06 \tabularnewline
21 & 0.362597 & 4.1974 & 2.4e-05 \tabularnewline
22 & 0.331665 & 3.8393 & 9.5e-05 \tabularnewline
23 & 0.300421 & 3.4776 & 0.000341 \tabularnewline
24 & 0.269717 & 3.1222 & 0.0011 \tabularnewline
25 & 0.24285 & 2.8112 & 0.002838 \tabularnewline
26 & 0.216915 & 2.511 & 0.006614 \tabularnewline
27 & 0.18667 & 2.1609 & 0.016242 \tabularnewline
28 & 0.156093 & 1.8069 & 0.03651 \tabularnewline
29 & 0.126756 & 1.4673 & 0.072318 \tabularnewline
30 & 0.095134 & 1.1013 & 0.136381 \tabularnewline
31 & 0.065316 & 0.7561 & 0.225464 \tabularnewline
32 & 0.04425 & 0.5122 & 0.304666 \tabularnewline
33 & 0.025927 & 0.3001 & 0.382273 \tabularnewline
34 & -0.000531 & -0.0062 & 0.49755 \tabularnewline
35 & -0.023786 & -0.2753 & 0.391738 \tabularnewline
36 & -0.055057 & -0.6373 & 0.262497 \tabularnewline
37 & -0.079592 & -0.9213 & 0.179264 \tabularnewline
38 & -0.096697 & -1.1193 & 0.132497 \tabularnewline
39 & -0.109935 & -1.2726 & 0.102684 \tabularnewline
40 & -0.121282 & -1.4039 & 0.081324 \tabularnewline
41 & -0.134921 & -1.5618 & 0.060344 \tabularnewline
42 & -0.151538 & -1.7542 & 0.040843 \tabularnewline
43 & -0.169215 & -1.9588 & 0.026106 \tabularnewline
44 & -0.184857 & -2.1399 & 0.017088 \tabularnewline
45 & -0.199068 & -2.3044 & 0.01137 \tabularnewline
46 & -0.204384 & -2.3659 & 0.009709 \tabularnewline
47 & -0.211863 & -2.4525 & 0.007736 \tabularnewline
48 & -0.2198 & -2.5444 & 0.006041 \tabularnewline
49 & -0.227447 & -2.6329 & 0.00473 \tabularnewline
50 & -0.239017 & -2.7668 & 0.003231 \tabularnewline
51 & -0.247181 & -2.8613 & 0.002448 \tabularnewline
52 & -0.256021 & -2.9637 & 0.001799 \tabularnewline
53 & -0.264211 & -3.0585 & 0.001344 \tabularnewline
54 & -0.274306 & -3.1753 & 0.000929 \tabularnewline
55 & -0.28917 & -3.3474 & 0.00053 \tabularnewline
56 & -0.31006 & -3.5892 & 0.000232 \tabularnewline
57 & -0.330733 & -3.8285 & 9.9e-05 \tabularnewline
58 & -0.350141 & -4.0532 & 4.3e-05 \tabularnewline
59 & -0.364329 & -4.2174 & 2.3e-05 \tabularnewline
60 & -0.375115 & -4.3423 & 1.4e-05 \tabularnewline
\hline
\end{tabular}
%Source: https://freestatistics.org/blog/index.php?pk=211184&T=1

[TABLE]
[ROW][C]Autocorrelation Function[/C][/ROW]
[ROW][C]Time lag k[/C][C]ACF(k)[/C][C]T-STAT[/C][C]P-value[/C][/ROW]
[ROW][C]1[/C][C]0.961988[/C][C]11.1358[/C][C]0[/C][/ROW]
[ROW][C]2[/C][C]0.920574[/C][C]10.6564[/C][C]0[/C][/ROW]
[ROW][C]3[/C][C]0.886112[/C][C]10.2575[/C][C]0[/C][/ROW]
[ROW][C]4[/C][C]0.850005[/C][C]9.8395[/C][C]0[/C][/ROW]
[ROW][C]5[/C][C]0.816571[/C][C]9.4525[/C][C]0[/C][/ROW]
[ROW][C]6[/C][C]0.783359[/C][C]9.068[/C][C]0[/C][/ROW]
[ROW][C]7[/C][C]0.749678[/C][C]8.6782[/C][C]0[/C][/ROW]
[ROW][C]8[/C][C]0.718446[/C][C]8.3166[/C][C]0[/C][/ROW]
[ROW][C]9[/C][C]0.687243[/C][C]7.9554[/C][C]0[/C][/ROW]
[ROW][C]10[/C][C]0.652396[/C][C]7.552[/C][C]0[/C][/ROW]
[ROW][C]11[/C][C]0.624062[/C][C]7.224[/C][C]0[/C][/ROW]
[ROW][C]12[/C][C]0.599592[/C][C]6.9408[/C][C]0[/C][/ROW]
[ROW][C]13[/C][C]0.573385[/C][C]6.6374[/C][C]0[/C][/ROW]
[ROW][C]14[/C][C]0.538371[/C][C]6.2321[/C][C]0[/C][/ROW]
[ROW][C]15[/C][C]0.507624[/C][C]5.8762[/C][C]0[/C][/ROW]
[ROW][C]16[/C][C]0.484879[/C][C]5.6129[/C][C]0[/C][/ROW]
[ROW][C]17[/C][C]0.456312[/C][C]5.2822[/C][C]0[/C][/ROW]
[ROW][C]18[/C][C]0.424653[/C][C]4.9157[/C][C]1e-06[/C][/ROW]
[ROW][C]19[/C][C]0.402944[/C][C]4.6644[/C][C]4e-06[/C][/ROW]
[ROW][C]20[/C][C]0.386353[/C][C]4.4724[/C][C]8e-06[/C][/ROW]
[ROW][C]21[/C][C]0.362597[/C][C]4.1974[/C][C]2.4e-05[/C][/ROW]
[ROW][C]22[/C][C]0.331665[/C][C]3.8393[/C][C]9.5e-05[/C][/ROW]
[ROW][C]23[/C][C]0.300421[/C][C]3.4776[/C][C]0.000341[/C][/ROW]
[ROW][C]24[/C][C]0.269717[/C][C]3.1222[/C][C]0.0011[/C][/ROW]
[ROW][C]25[/C][C]0.24285[/C][C]2.8112[/C][C]0.002838[/C][/ROW]
[ROW][C]26[/C][C]0.216915[/C][C]2.511[/C][C]0.006614[/C][/ROW]
[ROW][C]27[/C][C]0.18667[/C][C]2.1609[/C][C]0.016242[/C][/ROW]
[ROW][C]28[/C][C]0.156093[/C][C]1.8069[/C][C]0.03651[/C][/ROW]
[ROW][C]29[/C][C]0.126756[/C][C]1.4673[/C][C]0.072318[/C][/ROW]
[ROW][C]30[/C][C]0.095134[/C][C]1.1013[/C][C]0.136381[/C][/ROW]
[ROW][C]31[/C][C]0.065316[/C][C]0.7561[/C][C]0.225464[/C][/ROW]
[ROW][C]32[/C][C]0.04425[/C][C]0.5122[/C][C]0.304666[/C][/ROW]
[ROW][C]33[/C][C]0.025927[/C][C]0.3001[/C][C]0.382273[/C][/ROW]
[ROW][C]34[/C][C]-0.000531[/C][C]-0.0062[/C][C]0.49755[/C][/ROW]
[ROW][C]35[/C][C]-0.023786[/C][C]-0.2753[/C][C]0.391738[/C][/ROW]
[ROW][C]36[/C][C]-0.055057[/C][C]-0.6373[/C][C]0.262497[/C][/ROW]
[ROW][C]37[/C][C]-0.079592[/C][C]-0.9213[/C][C]0.179264[/C][/ROW]
[ROW][C]38[/C][C]-0.096697[/C][C]-1.1193[/C][C]0.132497[/C][/ROW]
[ROW][C]39[/C][C]-0.109935[/C][C]-1.2726[/C][C]0.102684[/C][/ROW]
[ROW][C]40[/C][C]-0.121282[/C][C]-1.4039[/C][C]0.081324[/C][/ROW]
[ROW][C]41[/C][C]-0.134921[/C][C]-1.5618[/C][C]0.060344[/C][/ROW]
[ROW][C]42[/C][C]-0.151538[/C][C]-1.7542[/C][C]0.040843[/C][/ROW]
[ROW][C]43[/C][C]-0.169215[/C][C]-1.9588[/C][C]0.026106[/C][/ROW]
[ROW][C]44[/C][C]-0.184857[/C][C]-2.1399[/C][C]0.017088[/C][/ROW]
[ROW][C]45[/C][C]-0.199068[/C][C]-2.3044[/C][C]0.01137[/C][/ROW]
[ROW][C]46[/C][C]-0.204384[/C][C]-2.3659[/C][C]0.009709[/C][/ROW]
[ROW][C]47[/C][C]-0.211863[/C][C]-2.4525[/C][C]0.007736[/C][/ROW]
[ROW][C]48[/C][C]-0.2198[/C][C]-2.5444[/C][C]0.006041[/C][/ROW]
[ROW][C]49[/C][C]-0.227447[/C][C]-2.6329[/C][C]0.00473[/C][/ROW]
[ROW][C]50[/C][C]-0.239017[/C][C]-2.7668[/C][C]0.003231[/C][/ROW]
[ROW][C]51[/C][C]-0.247181[/C][C]-2.8613[/C][C]0.002448[/C][/ROW]
[ROW][C]52[/C][C]-0.256021[/C][C]-2.9637[/C][C]0.001799[/C][/ROW]
[ROW][C]53[/C][C]-0.264211[/C][C]-3.0585[/C][C]0.001344[/C][/ROW]
[ROW][C]54[/C][C]-0.274306[/C][C]-3.1753[/C][C]0.000929[/C][/ROW]
[ROW][C]55[/C][C]-0.28917[/C][C]-3.3474[/C][C]0.00053[/C][/ROW]
[ROW][C]56[/C][C]-0.31006[/C][C]-3.5892[/C][C]0.000232[/C][/ROW]
[ROW][C]57[/C][C]-0.330733[/C][C]-3.8285[/C][C]9.9e-05[/C][/ROW]
[ROW][C]58[/C][C]-0.350141[/C][C]-4.0532[/C][C]4.3e-05[/C][/ROW]
[ROW][C]59[/C][C]-0.364329[/C][C]-4.2174[/C][C]2.3e-05[/C][/ROW]
[ROW][C]60[/C][C]-0.375115[/C][C]-4.3423[/C][C]1.4e-05[/C][/ROW]
[/TABLE]
Source: https://freestatistics.org/blog/index.php?pk=211184&T=1

Globally Unique Identifier (entire table): ba.freestatistics.org/blog/index.php?pk=211184&T=1

As an alternative you can also use a QR Code:  

The GUIDs for individual cells are displayed in the table below:

Autocorrelation Function
Time lag kACF(k)T-STATP-value
10.96198811.13580
20.92057410.65640
30.88611210.25750
40.8500059.83950
50.8165719.45250
60.7833599.0680
70.7496788.67820
80.7184468.31660
90.6872437.95540
100.6523967.5520
110.6240627.2240
120.5995926.94080
130.5733856.63740
140.5383716.23210
150.5076245.87620
160.4848795.61290
170.4563125.28220
180.4246534.91571e-06
190.4029444.66444e-06
200.3863534.47248e-06
210.3625974.19742.4e-05
220.3316653.83939.5e-05
230.3004213.47760.000341
240.2697173.12220.0011
250.242852.81120.002838
260.2169152.5110.006614
270.186672.16090.016242
280.1560931.80690.03651
290.1267561.46730.072318
300.0951341.10130.136381
310.0653160.75610.225464
320.044250.51220.304666
330.0259270.30010.382273
34-0.000531-0.00620.49755
35-0.023786-0.27530.391738
36-0.055057-0.63730.262497
37-0.079592-0.92130.179264
38-0.096697-1.11930.132497
39-0.109935-1.27260.102684
40-0.121282-1.40390.081324
41-0.134921-1.56180.060344
42-0.151538-1.75420.040843
43-0.169215-1.95880.026106
44-0.184857-2.13990.017088
45-0.199068-2.30440.01137
46-0.204384-2.36590.009709
47-0.211863-2.45250.007736
48-0.2198-2.54440.006041
49-0.227447-2.63290.00473
50-0.239017-2.76680.003231
51-0.247181-2.86130.002448
52-0.256021-2.96370.001799
53-0.264211-3.05850.001344
54-0.274306-3.17530.000929
55-0.28917-3.34740.00053
56-0.31006-3.58920.000232
57-0.330733-3.82859.9e-05
58-0.350141-4.05324.3e-05
59-0.364329-4.21742.3e-05
60-0.375115-4.34231.4e-05


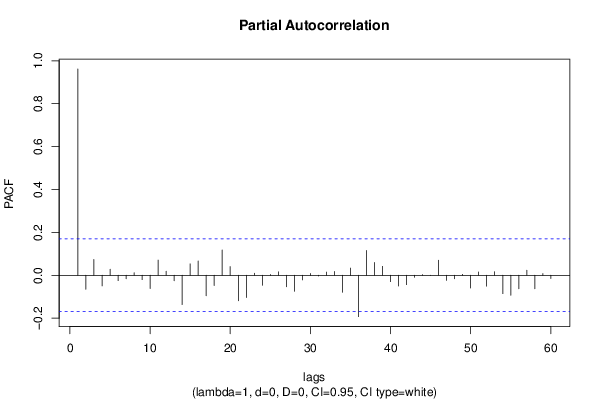
Partial Autocorrelation Function
Time lag kPACF(k)T-STATP-value
10.96198811.13580
2-0.064992-0.75230.226584
30.0740080.85670.19657
4-0.049455-0.57250.283976
50.0280220.32440.373078
6-0.024805-0.28710.387225
7-0.016346-0.18920.425104
80.0117060.13550.446207
9-0.020096-0.23260.408202
10-0.061932-0.71690.237337
110.0708330.820.206849
120.0187710.21730.414156
13-0.025533-0.29560.384012
14-0.136613-1.58140.058071
150.0533210.61720.269064
160.0667970.77320.220374
17-0.09576-1.10850.134815
18-0.04786-0.5540.290246
190.1180041.3660.087115
200.0404370.46810.32024
21-0.118968-1.37720.08538
22-0.103366-1.19650.116798
230.0092460.1070.457464
24-0.046514-0.53840.295583
250.0037980.0440.482499
260.0159560.18470.426869
27-0.053733-0.6220.267496
28-0.074615-0.86370.19464
29-0.021411-0.24790.402313
300.0087650.10150.459668
31-0.003326-0.03850.484672
320.0147870.17120.432175
330.0180660.20910.417332
34-0.078839-0.91260.18154
350.0335320.38820.349256
36-0.192802-2.23180.013643
370.115661.33890.091441
380.0597330.69150.245238
390.0415410.48090.315697
40-0.029435-0.34070.36692
41-0.050345-0.58280.280509
42-0.043538-0.5040.307548
43-0.009523-0.11020.456194
440.0029930.03460.486207
45-7.6e-05-9e-040.499649
460.0699960.81030.209612
47-0.023545-0.27260.392807
48-0.016118-0.18660.426138
490.0043010.04980.480182
50-0.059273-0.68610.246907
510.0150920.17470.430789
52-0.050625-0.5860.27942
530.0163830.18970.424934
54-0.085509-0.98980.162018
55-0.093385-1.0810.140817
56-0.06245-0.72290.235498
570.0235650.27280.392721
58-0.062516-0.72370.235264
590.007890.09130.46368
60-0.015286-0.1770.429906

\begin{tabular}{lllllllll}
\hline
Partial Autocorrelation Function \tabularnewline
Time lag k & PACF(k) & T-STAT & P-value \tabularnewline
1 & 0.961988 & 11.1358 & 0 \tabularnewline
2 & -0.064992 & -0.7523 & 0.226584 \tabularnewline
3 & 0.074008 & 0.8567 & 0.19657 \tabularnewline
4 & -0.049455 & -0.5725 & 0.283976 \tabularnewline
5 & 0.028022 & 0.3244 & 0.373078 \tabularnewline
6 & -0.024805 & -0.2871 & 0.387225 \tabularnewline
7 & -0.016346 & -0.1892 & 0.425104 \tabularnewline
8 & 0.011706 & 0.1355 & 0.446207 \tabularnewline
9 & -0.020096 & -0.2326 & 0.408202 \tabularnewline
10 & -0.061932 & -0.7169 & 0.237337 \tabularnewline
11 & 0.070833 & 0.82 & 0.206849 \tabularnewline
12 & 0.018771 & 0.2173 & 0.414156 \tabularnewline
13 & -0.025533 & -0.2956 & 0.384012 \tabularnewline
14 & -0.136613 & -1.5814 & 0.058071 \tabularnewline
15 & 0.053321 & 0.6172 & 0.269064 \tabularnewline
16 & 0.066797 & 0.7732 & 0.220374 \tabularnewline
17 & -0.09576 & -1.1085 & 0.134815 \tabularnewline
18 & -0.04786 & -0.554 & 0.290246 \tabularnewline
19 & 0.118004 & 1.366 & 0.087115 \tabularnewline
20 & 0.040437 & 0.4681 & 0.32024 \tabularnewline
21 & -0.118968 & -1.3772 & 0.08538 \tabularnewline
22 & -0.103366 & -1.1965 & 0.116798 \tabularnewline
23 & 0.009246 & 0.107 & 0.457464 \tabularnewline
24 & -0.046514 & -0.5384 & 0.295583 \tabularnewline
25 & 0.003798 & 0.044 & 0.482499 \tabularnewline
26 & 0.015956 & 0.1847 & 0.426869 \tabularnewline
27 & -0.053733 & -0.622 & 0.267496 \tabularnewline
28 & -0.074615 & -0.8637 & 0.19464 \tabularnewline
29 & -0.021411 & -0.2479 & 0.402313 \tabularnewline
30 & 0.008765 & 0.1015 & 0.459668 \tabularnewline
31 & -0.003326 & -0.0385 & 0.484672 \tabularnewline
32 & 0.014787 & 0.1712 & 0.432175 \tabularnewline
33 & 0.018066 & 0.2091 & 0.417332 \tabularnewline
34 & -0.078839 & -0.9126 & 0.18154 \tabularnewline
35 & 0.033532 & 0.3882 & 0.349256 \tabularnewline
36 & -0.192802 & -2.2318 & 0.013643 \tabularnewline
37 & 0.11566 & 1.3389 & 0.091441 \tabularnewline
38 & 0.059733 & 0.6915 & 0.245238 \tabularnewline
39 & 0.041541 & 0.4809 & 0.315697 \tabularnewline
40 & -0.029435 & -0.3407 & 0.36692 \tabularnewline
41 & -0.050345 & -0.5828 & 0.280509 \tabularnewline
42 & -0.043538 & -0.504 & 0.307548 \tabularnewline
43 & -0.009523 & -0.1102 & 0.456194 \tabularnewline
44 & 0.002993 & 0.0346 & 0.486207 \tabularnewline
45 & -7.6e-05 & -9e-04 & 0.499649 \tabularnewline
46 & 0.069996 & 0.8103 & 0.209612 \tabularnewline
47 & -0.023545 & -0.2726 & 0.392807 \tabularnewline
48 & -0.016118 & -0.1866 & 0.426138 \tabularnewline
49 & 0.004301 & 0.0498 & 0.480182 \tabularnewline
50 & -0.059273 & -0.6861 & 0.246907 \tabularnewline
51 & 0.015092 & 0.1747 & 0.430789 \tabularnewline
52 & -0.050625 & -0.586 & 0.27942 \tabularnewline
53 & 0.016383 & 0.1897 & 0.424934 \tabularnewline
54 & -0.085509 & -0.9898 & 0.162018 \tabularnewline
55 & -0.093385 & -1.081 & 0.140817 \tabularnewline
56 & -0.06245 & -0.7229 & 0.235498 \tabularnewline
57 & 0.023565 & 0.2728 & 0.392721 \tabularnewline
58 & -0.062516 & -0.7237 & 0.235264 \tabularnewline
59 & 0.00789 & 0.0913 & 0.46368 \tabularnewline
60 & -0.015286 & -0.177 & 0.429906 \tabularnewline
\hline
\end{tabular}
%Source: https://freestatistics.org/blog/index.php?pk=211184&T=2

[TABLE]
[ROW][C]Partial Autocorrelation Function[/C][/ROW]
[ROW][C]Time lag k[/C][C]PACF(k)[/C][C]T-STAT[/C][C]P-value[/C][/ROW]
[ROW][C]1[/C][C]0.961988[/C][C]11.1358[/C][C]0[/C][/ROW]
[ROW][C]2[/C][C]-0.064992[/C][C]-0.7523[/C][C]0.226584[/C][/ROW]
[ROW][C]3[/C][C]0.074008[/C][C]0.8567[/C][C]0.19657[/C][/ROW]
[ROW][C]4[/C][C]-0.049455[/C][C]-0.5725[/C][C]0.283976[/C][/ROW]
[ROW][C]5[/C][C]0.028022[/C][C]0.3244[/C][C]0.373078[/C][/ROW]
[ROW][C]6[/C][C]-0.024805[/C][C]-0.2871[/C][C]0.387225[/C][/ROW]
[ROW][C]7[/C][C]-0.016346[/C][C]-0.1892[/C][C]0.425104[/C][/ROW]
[ROW][C]8[/C][C]0.011706[/C][C]0.1355[/C][C]0.446207[/C][/ROW]
[ROW][C]9[/C][C]-0.020096[/C][C]-0.2326[/C][C]0.408202[/C][/ROW]
[ROW][C]10[/C][C]-0.061932[/C][C]-0.7169[/C][C]0.237337[/C][/ROW]
[ROW][C]11[/C][C]0.070833[/C][C]0.82[/C][C]0.206849[/C][/ROW]
[ROW][C]12[/C][C]0.018771[/C][C]0.2173[/C][C]0.414156[/C][/ROW]
[ROW][C]13[/C][C]-0.025533[/C][C]-0.2956[/C][C]0.384012[/C][/ROW]
[ROW][C]14[/C][C]-0.136613[/C][C]-1.5814[/C][C]0.058071[/C][/ROW]
[ROW][C]15[/C][C]0.053321[/C][C]0.6172[/C][C]0.269064[/C][/ROW]
[ROW][C]16[/C][C]0.066797[/C][C]0.7732[/C][C]0.220374[/C][/ROW]
[ROW][C]17[/C][C]-0.09576[/C][C]-1.1085[/C][C]0.134815[/C][/ROW]
[ROW][C]18[/C][C]-0.04786[/C][C]-0.554[/C][C]0.290246[/C][/ROW]
[ROW][C]19[/C][C]0.118004[/C][C]1.366[/C][C]0.087115[/C][/ROW]
[ROW][C]20[/C][C]0.040437[/C][C]0.4681[/C][C]0.32024[/C][/ROW]
[ROW][C]21[/C][C]-0.118968[/C][C]-1.3772[/C][C]0.08538[/C][/ROW]
[ROW][C]22[/C][C]-0.103366[/C][C]-1.1965[/C][C]0.116798[/C][/ROW]
[ROW][C]23[/C][C]0.009246[/C][C]0.107[/C][C]0.457464[/C][/ROW]
[ROW][C]24[/C][C]-0.046514[/C][C]-0.5384[/C][C]0.295583[/C][/ROW]
[ROW][C]25[/C][C]0.003798[/C][C]0.044[/C][C]0.482499[/C][/ROW]
[ROW][C]26[/C][C]0.015956[/C][C]0.1847[/C][C]0.426869[/C][/ROW]
[ROW][C]27[/C][C]-0.053733[/C][C]-0.622[/C][C]0.267496[/C][/ROW]
[ROW][C]28[/C][C]-0.074615[/C][C]-0.8637[/C][C]0.19464[/C][/ROW]
[ROW][C]29[/C][C]-0.021411[/C][C]-0.2479[/C][C]0.402313[/C][/ROW]
[ROW][C]30[/C][C]0.008765[/C][C]0.1015[/C][C]0.459668[/C][/ROW]
[ROW][C]31[/C][C]-0.003326[/C][C]-0.0385[/C][C]0.484672[/C][/ROW]
[ROW][C]32[/C][C]0.014787[/C][C]0.1712[/C][C]0.432175[/C][/ROW]
[ROW][C]33[/C][C]0.018066[/C][C]0.2091[/C][C]0.417332[/C][/ROW]
[ROW][C]34[/C][C]-0.078839[/C][C]-0.9126[/C][C]0.18154[/C][/ROW]
[ROW][C]35[/C][C]0.033532[/C][C]0.3882[/C][C]0.349256[/C][/ROW]
[ROW][C]36[/C][C]-0.192802[/C][C]-2.2318[/C][C]0.013643[/C][/ROW]
[ROW][C]37[/C][C]0.11566[/C][C]1.3389[/C][C]0.091441[/C][/ROW]
[ROW][C]38[/C][C]0.059733[/C][C]0.6915[/C][C]0.245238[/C][/ROW]
[ROW][C]39[/C][C]0.041541[/C][C]0.4809[/C][C]0.315697[/C][/ROW]
[ROW][C]40[/C][C]-0.029435[/C][C]-0.3407[/C][C]0.36692[/C][/ROW]
[ROW][C]41[/C][C]-0.050345[/C][C]-0.5828[/C][C]0.280509[/C][/ROW]
[ROW][C]42[/C][C]-0.043538[/C][C]-0.504[/C][C]0.307548[/C][/ROW]
[ROW][C]43[/C][C]-0.009523[/C][C]-0.1102[/C][C]0.456194[/C][/ROW]
[ROW][C]44[/C][C]0.002993[/C][C]0.0346[/C][C]0.486207[/C][/ROW]
[ROW][C]45[/C][C]-7.6e-05[/C][C]-9e-04[/C][C]0.499649[/C][/ROW]
[ROW][C]46[/C][C]0.069996[/C][C]0.8103[/C][C]0.209612[/C][/ROW]
[ROW][C]47[/C][C]-0.023545[/C][C]-0.2726[/C][C]0.392807[/C][/ROW]
[ROW][C]48[/C][C]-0.016118[/C][C]-0.1866[/C][C]0.426138[/C][/ROW]
[ROW][C]49[/C][C]0.004301[/C][C]0.0498[/C][C]0.480182[/C][/ROW]
[ROW][C]50[/C][C]-0.059273[/C][C]-0.6861[/C][C]0.246907[/C][/ROW]
[ROW][C]51[/C][C]0.015092[/C][C]0.1747[/C][C]0.430789[/C][/ROW]
[ROW][C]52[/C][C]-0.050625[/C][C]-0.586[/C][C]0.27942[/C][/ROW]
[ROW][C]53[/C][C]0.016383[/C][C]0.1897[/C][C]0.424934[/C][/ROW]
[ROW][C]54[/C][C]-0.085509[/C][C]-0.9898[/C][C]0.162018[/C][/ROW]
[ROW][C]55[/C][C]-0.093385[/C][C]-1.081[/C][C]0.140817[/C][/ROW]
[ROW][C]56[/C][C]-0.06245[/C][C]-0.7229[/C][C]0.235498[/C][/ROW]
[ROW][C]57[/C][C]0.023565[/C][C]0.2728[/C][C]0.392721[/C][/ROW]
[ROW][C]58[/C][C]-0.062516[/C][C]-0.7237[/C][C]0.235264[/C][/ROW]
[ROW][C]59[/C][C]0.00789[/C][C]0.0913[/C][C]0.46368[/C][/ROW]
[ROW][C]60[/C][C]-0.015286[/C][C]-0.177[/C][C]0.429906[/C][/ROW]
[/TABLE]
Source: https://freestatistics.org/blog/index.php?pk=211184&T=2

Globally Unique Identifier (entire table): ba.freestatistics.org/blog/index.php?pk=211184&T=2

As an alternative you can also use a QR Code:  

The GUIDs for individual cells are displayed in the table below:

Partial Autocorrelation Function
Time lag kPACF(k)T-STATP-value
10.96198811.13580
2-0.064992-0.75230.226584
30.0740080.85670.19657
4-0.049455-0.57250.283976
50.0280220.32440.373078
6-0.024805-0.28710.387225
7-0.016346-0.18920.425104
80.0117060.13550.446207
9-0.020096-0.23260.408202
10-0.061932-0.71690.237337
110.0708330.820.206849
120.0187710.21730.414156
13-0.025533-0.29560.384012
14-0.136613-1.58140.058071
150.0533210.61720.269064
160.0667970.77320.220374
17-0.09576-1.10850.134815
18-0.04786-0.5540.290246
190.1180041.3660.087115
200.0404370.46810.32024
21-0.118968-1.37720.08538
22-0.103366-1.19650.116798
230.0092460.1070.457464
24-0.046514-0.53840.295583
250.0037980.0440.482499
260.0159560.18470.426869
27-0.053733-0.6220.267496
28-0.074615-0.86370.19464
29-0.021411-0.24790.402313
300.0087650.10150.459668
31-0.003326-0.03850.484672
320.0147870.17120.432175
330.0180660.20910.417332
34-0.078839-0.91260.18154
350.0335320.38820.349256
36-0.192802-2.23180.013643
370.115661.33890.091441
380.0597330.69150.245238
390.0415410.48090.315697
40-0.029435-0.34070.36692
41-0.050345-0.58280.280509
42-0.043538-0.5040.307548
43-0.009523-0.11020.456194
440.0029930.03460.486207
45-7.6e-05-9e-040.499649
460.0699960.81030.209612
47-0.023545-0.27260.392807
48-0.016118-0.18660.426138
490.0043010.04980.480182
50-0.059273-0.68610.246907
510.0150920.17470.430789
52-0.050625-0.5860.27942
530.0163830.18970.424934
54-0.085509-0.98980.162018
55-0.093385-1.0810.140817
56-0.06245-0.72290.235498
570.0235650.27280.392721
58-0.062516-0.72370.235264
590.007890.09130.46368
60-0.015286-0.1770.429906


Parameters (Session):
par1 = 60 ; par2 = 1 ; par3 = 0 ; par4 = 0 ; par5 = 12 ; par6 = White Noise ; par7 = 0.95 ;
Parameters (R input):
par1 = 60 ; par2 = 1 ; par3 = 0 ; par4 = 0 ; par5 = 12 ; par6 = White Noise ; par7 = 0.95 ; par8 = ;
R code (references can be found in the software module):
if (par1 == 'Default') {
par1 = 10*log10(length(x))
} else {
par1 <- as.numeric(par1)
}
par2 <- as.numeric(par2)
par3 <- as.numeric(par3)
par4 <- as.numeric(par4)
par5 <- as.numeric(par5)
if (par6 == 'White Noise') par6 <- 'white' else par6 <- 'ma'
par7 <- as.numeric(par7)
if (par8 != '') par8 <- as.numeric(par8)
ox <- x
if (par8 == '') {
if (par2 == 0) {
x <- log(x)
} else {
x <- (x ^ par2 - 1) / par2
}
} else {
x <- log(x,base=par8)
}
if (par3 > 0) x <- diff(x,lag=1,difference=par3)
if (par4 > 0) x <- diff(x,lag=par5,difference=par4)
bitmap(file='picts.png')
op <- par(mfrow=c(2,1))
plot(ox,type='l',main='Original Time Series',xlab='time',ylab='value')
if (par8=='') {
mytitle <- paste('Working Time Series (lambda=',par2,', d=',par3,', D=',par4,')',sep='')
mysub <- paste('(lambda=',par2,', d=',par3,', D=',par4,', CI=', par7, ', CI type=',par6,')',sep='')
} else {
mytitle <- paste('Working Time Series (base=',par8,', d=',par3,', D=',par4,')',sep='')
mysub <- paste('(base=',par8,', d=',par3,', D=',par4,', CI=', par7, ', CI type=',par6,')',sep='')
}
plot(x,type='l', main=mytitle,xlab='time',ylab='value')
par(op)
dev.off()
bitmap(file='pic1.png')
racf <- acf(x, par1, main='Autocorrelation', xlab='time lag', ylab='ACF', ci.type=par6, ci=par7, sub=mysub)
dev.off()
bitmap(file='pic2.png')
rpacf <- pacf(x,par1,main='Partial Autocorrelation',xlab='lags',ylab='PACF',sub=mysub)
dev.off()
(myacf <- c(racf$acf))
(mypacf <- c(rpacf$acf))
lengthx <- length(x)
sqrtn <- sqrt(lengthx)
load(file='createtable')
a<-table.start()
a<-table.row.start(a)
a<-table.element(a,'Autocorrelation Function',4,TRUE)
a<-table.row.end(a)
a<-table.row.start(a)
a<-table.element(a,'Time lag k',header=TRUE)
a<-table.element(a,hyperlink('basics.htm','ACF(k)','click here for more information about the Autocorrelation Function'),header=TRUE)
a<-table.element(a,'T-STAT',header=TRUE)
a<-table.element(a,'P-value',header=TRUE)
a<-table.row.end(a)
for (i in 2:(par1+1)) {
a<-table.row.start(a)
a<-table.element(a,i-1,header=TRUE)
a<-table.element(a,round(myacf[i],6))
mytstat <- myacf[i]*sqrtn
a<-table.element(a,round(mytstat,4))
a<-table.element(a,round(1-pt(abs(mytstat),lengthx),6))
a<-table.row.end(a)
}
a<-table.end(a)
table.save(a,file='mytable.tab')
a<-table.start()
a<-table.row.start(a)
a<-table.element(a,'Partial Autocorrelation Function',4,TRUE)
a<-table.row.end(a)
a<-table.row.start(a)
a<-table.element(a,'Time lag k',header=TRUE)
a<-table.element(a,hyperlink('basics.htm','PACF(k)','click here for more information about the Partial Autocorrelation Function'),header=TRUE)
a<-table.element(a,'T-STAT',header=TRUE)
a<-table.element(a,'P-value',header=TRUE)
a<-table.row.end(a)
for (i in 1:par1) {
a<-table.row.start(a)
a<-table.element(a,i,header=TRUE)
a<-table.element(a,round(mypacf[i],6))
mytstat <- mypacf[i]*sqrtn
a<-table.element(a,round(mytstat,4))
a<-table.element(a,round(1-pt(abs(mytstat),lengthx),6))
a<-table.row.end(a)
}
a<-table.end(a)
table.save(a,file='mytable1.tab')