Free Statistics

of Irreproducible Research!

Author's title

Author*The author of this computation has been verified*
R Software Modulerwasp_autocorrelation.wasp
Title produced by software(Partial) Autocorrelation Function
Date of computationThu, 12 Dec 2013 03:29:23 -0500
Cite this page as followsStatistical Computations at FreeStatistics.org, Office for Research Development and Education, URL https://freestatistics.org/blog/index.php?v=date/2013/Dec/12/t13868369761dzy8h7a7wx23zd.htm/, Retrieved Tue, 16 Apr 2024 23:41:59 +0000
Statistical Computations at FreeStatistics.org, Office for Research Development and Education, URL https://freestatistics.org/blog/index.php?pk=232213, Retrieved Tue, 16 Apr 2024 23:41:59 +0000
QR Codes:

Original text written by user:
IsPrivate?No (this computation is public)
User-defined keywords
Estimated Impact121
Family? (F = Feedback message, R = changed R code, M = changed R Module, P = changed Parameters, D = changed Data)
-       [(Partial) Autocorrelation Function] [] [2013-12-12 08:29:23] [9e6a405f514733ea23d87e4507d39d29] [Current]
Feedback Forum

Post a new message
Dataseries X:
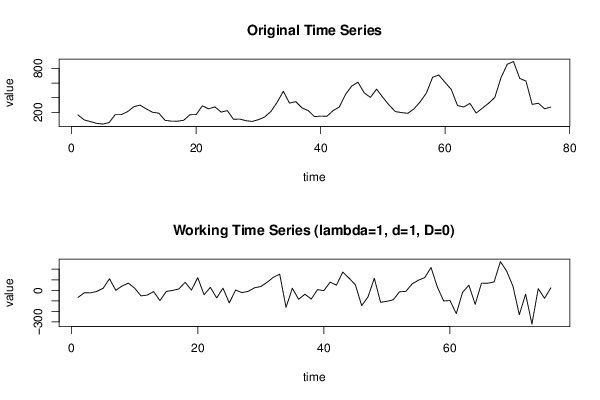
164
96
73
49
39
59
169
169
210
278
298
245
200
188
90
79
78
91
167
169
289
247
275
203
223
104
107
85
75
99
135
211
335
488
326
346
261
224
141
148
145
223
272
445
560
612
467
404
518
404
300
210
196
186
247
343
464
680
711
610
513
292
273
322
189
257
324
404
677
858
895
664
628
308
324
248
272


Summary of computational transaction
Raw Inputview raw input (R code)
Raw Outputview raw output of R engine
Computing time5 seconds
R Server'Sir Maurice George Kendall' @ kendall.wessa.net

\begin{tabular}{lllllllll}
\hline
Summary of computational transaction \tabularnewline
Raw Input & view raw input (R code)  \tabularnewline
Raw Output & view raw output of R engine  \tabularnewline
Computing time & 5 seconds \tabularnewline
R Server & 'Sir Maurice George Kendall' @ kendall.wessa.net \tabularnewline
\hline
\end{tabular}
%Source: https://freestatistics.org/blog/index.php?pk=232213&T=0

[TABLE]
[ROW][C]Summary of computational transaction[/C][/ROW]
[ROW][C]Raw Input[/C][C]view raw input (R code) [/C][/ROW]
[ROW][C]Raw Output[/C][C]view raw output of R engine [/C][/ROW]
[ROW][C]Computing time[/C][C]5 seconds[/C][/ROW]
[ROW][C]R Server[/C][C]'Sir Maurice George Kendall' @ kendall.wessa.net[/C][/ROW]
[/TABLE]
Source: https://freestatistics.org/blog/index.php?pk=232213&T=0

Globally Unique Identifier (entire table): ba.freestatistics.org/blog/index.php?pk=232213&T=0

As an alternative you can also use a QR Code:  

The GUIDs for individual cells are displayed in the table below:

Summary of computational transaction
Raw Inputview raw input (R code)
Raw Outputview raw output of R engine
Computing time5 seconds
R Server'Sir Maurice George Kendall' @ kendall.wessa.net


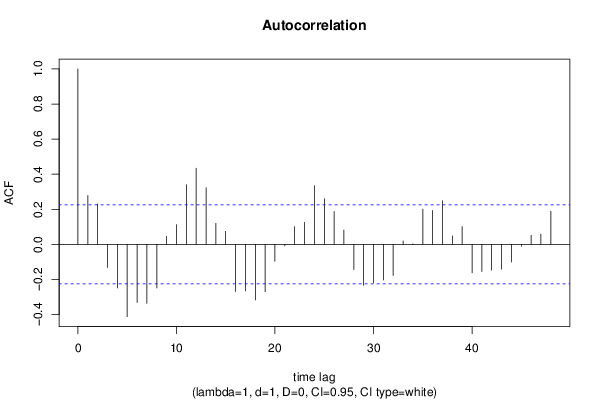
Autocorrelation Function
Time lag kACF(k)T-STATP-value
10.2776312.42030.008947
20.2297292.00270.024386
3-0.131974-1.15050.126768
4-0.248477-2.16620.016717
5-0.412365-3.59490.000287
6-0.331555-2.89040.002506
7-0.336216-2.93110.00223
8-0.248679-2.16790.016647
90.045810.39940.345374
100.1114250.97140.167221
110.3393832.95870.002059
120.434243.78560.000152
130.3230292.81610.003095
140.1193971.04090.150615
150.0738120.64350.260925
16-0.268925-2.34440.010835
17-0.265657-2.31590.01163
18-0.316891-2.76260.003594
19-0.269873-2.35270.010613
20-0.096581-0.8420.201222
21-0.008652-0.07540.470037
220.100880.87950.190965
230.1252111.09160.139237
240.3343562.91480.002337
250.2601212.26770.013095
260.1871871.63190.053424
270.0809750.70590.241197
28-0.143177-1.24820.107897
29-0.233386-2.03460.022689
30-0.219101-1.91010.029948
31-0.203046-1.77010.04036
32-0.178178-1.55330.062251
330.0190550.16610.434253
340.0027180.02370.490578
350.2006971.74960.042109
360.1929591.68220.04832
370.2481792.16360.01682
380.0473820.41310.340362
390.1010160.88060.190645
40-0.162632-1.41780.080169
41-0.154769-1.34920.090632
42-0.146908-1.28070.102094
43-0.141575-1.23420.110461
44-0.101156-0.88190.190316
45-0.011124-0.0970.461499
460.0511410.44580.328492
470.0580170.50580.307238
480.1890381.6480.051741

\begin{tabular}{lllllllll}
\hline
Autocorrelation Function \tabularnewline
Time lag k & ACF(k) & T-STAT & P-value \tabularnewline
1 & 0.277631 & 2.4203 & 0.008947 \tabularnewline
2 & 0.229729 & 2.0027 & 0.024386 \tabularnewline
3 & -0.131974 & -1.1505 & 0.126768 \tabularnewline
4 & -0.248477 & -2.1662 & 0.016717 \tabularnewline
5 & -0.412365 & -3.5949 & 0.000287 \tabularnewline
6 & -0.331555 & -2.8904 & 0.002506 \tabularnewline
7 & -0.336216 & -2.9311 & 0.00223 \tabularnewline
8 & -0.248679 & -2.1679 & 0.016647 \tabularnewline
9 & 0.04581 & 0.3994 & 0.345374 \tabularnewline
10 & 0.111425 & 0.9714 & 0.167221 \tabularnewline
11 & 0.339383 & 2.9587 & 0.002059 \tabularnewline
12 & 0.43424 & 3.7856 & 0.000152 \tabularnewline
13 & 0.323029 & 2.8161 & 0.003095 \tabularnewline
14 & 0.119397 & 1.0409 & 0.150615 \tabularnewline
15 & 0.073812 & 0.6435 & 0.260925 \tabularnewline
16 & -0.268925 & -2.3444 & 0.010835 \tabularnewline
17 & -0.265657 & -2.3159 & 0.01163 \tabularnewline
18 & -0.316891 & -2.7626 & 0.003594 \tabularnewline
19 & -0.269873 & -2.3527 & 0.010613 \tabularnewline
20 & -0.096581 & -0.842 & 0.201222 \tabularnewline
21 & -0.008652 & -0.0754 & 0.470037 \tabularnewline
22 & 0.10088 & 0.8795 & 0.190965 \tabularnewline
23 & 0.125211 & 1.0916 & 0.139237 \tabularnewline
24 & 0.334356 & 2.9148 & 0.002337 \tabularnewline
25 & 0.260121 & 2.2677 & 0.013095 \tabularnewline
26 & 0.187187 & 1.6319 & 0.053424 \tabularnewline
27 & 0.080975 & 0.7059 & 0.241197 \tabularnewline
28 & -0.143177 & -1.2482 & 0.107897 \tabularnewline
29 & -0.233386 & -2.0346 & 0.022689 \tabularnewline
30 & -0.219101 & -1.9101 & 0.029948 \tabularnewline
31 & -0.203046 & -1.7701 & 0.04036 \tabularnewline
32 & -0.178178 & -1.5533 & 0.062251 \tabularnewline
33 & 0.019055 & 0.1661 & 0.434253 \tabularnewline
34 & 0.002718 & 0.0237 & 0.490578 \tabularnewline
35 & 0.200697 & 1.7496 & 0.042109 \tabularnewline
36 & 0.192959 & 1.6822 & 0.04832 \tabularnewline
37 & 0.248179 & 2.1636 & 0.01682 \tabularnewline
38 & 0.047382 & 0.4131 & 0.340362 \tabularnewline
39 & 0.101016 & 0.8806 & 0.190645 \tabularnewline
40 & -0.162632 & -1.4178 & 0.080169 \tabularnewline
41 & -0.154769 & -1.3492 & 0.090632 \tabularnewline
42 & -0.146908 & -1.2807 & 0.102094 \tabularnewline
43 & -0.141575 & -1.2342 & 0.110461 \tabularnewline
44 & -0.101156 & -0.8819 & 0.190316 \tabularnewline
45 & -0.011124 & -0.097 & 0.461499 \tabularnewline
46 & 0.051141 & 0.4458 & 0.328492 \tabularnewline
47 & 0.058017 & 0.5058 & 0.307238 \tabularnewline
48 & 0.189038 & 1.648 & 0.051741 \tabularnewline
\hline
\end{tabular}
%Source: https://freestatistics.org/blog/index.php?pk=232213&T=1

[TABLE]
[ROW][C]Autocorrelation Function[/C][/ROW]
[ROW][C]Time lag k[/C][C]ACF(k)[/C][C]T-STAT[/C][C]P-value[/C][/ROW]
[ROW][C]1[/C][C]0.277631[/C][C]2.4203[/C][C]0.008947[/C][/ROW]
[ROW][C]2[/C][C]0.229729[/C][C]2.0027[/C][C]0.024386[/C][/ROW]
[ROW][C]3[/C][C]-0.131974[/C][C]-1.1505[/C][C]0.126768[/C][/ROW]
[ROW][C]4[/C][C]-0.248477[/C][C]-2.1662[/C][C]0.016717[/C][/ROW]
[ROW][C]5[/C][C]-0.412365[/C][C]-3.5949[/C][C]0.000287[/C][/ROW]
[ROW][C]6[/C][C]-0.331555[/C][C]-2.8904[/C][C]0.002506[/C][/ROW]
[ROW][C]7[/C][C]-0.336216[/C][C]-2.9311[/C][C]0.00223[/C][/ROW]
[ROW][C]8[/C][C]-0.248679[/C][C]-2.1679[/C][C]0.016647[/C][/ROW]
[ROW][C]9[/C][C]0.04581[/C][C]0.3994[/C][C]0.345374[/C][/ROW]
[ROW][C]10[/C][C]0.111425[/C][C]0.9714[/C][C]0.167221[/C][/ROW]
[ROW][C]11[/C][C]0.339383[/C][C]2.9587[/C][C]0.002059[/C][/ROW]
[ROW][C]12[/C][C]0.43424[/C][C]3.7856[/C][C]0.000152[/C][/ROW]
[ROW][C]13[/C][C]0.323029[/C][C]2.8161[/C][C]0.003095[/C][/ROW]
[ROW][C]14[/C][C]0.119397[/C][C]1.0409[/C][C]0.150615[/C][/ROW]
[ROW][C]15[/C][C]0.073812[/C][C]0.6435[/C][C]0.260925[/C][/ROW]
[ROW][C]16[/C][C]-0.268925[/C][C]-2.3444[/C][C]0.010835[/C][/ROW]
[ROW][C]17[/C][C]-0.265657[/C][C]-2.3159[/C][C]0.01163[/C][/ROW]
[ROW][C]18[/C][C]-0.316891[/C][C]-2.7626[/C][C]0.003594[/C][/ROW]
[ROW][C]19[/C][C]-0.269873[/C][C]-2.3527[/C][C]0.010613[/C][/ROW]
[ROW][C]20[/C][C]-0.096581[/C][C]-0.842[/C][C]0.201222[/C][/ROW]
[ROW][C]21[/C][C]-0.008652[/C][C]-0.0754[/C][C]0.470037[/C][/ROW]
[ROW][C]22[/C][C]0.10088[/C][C]0.8795[/C][C]0.190965[/C][/ROW]
[ROW][C]23[/C][C]0.125211[/C][C]1.0916[/C][C]0.139237[/C][/ROW]
[ROW][C]24[/C][C]0.334356[/C][C]2.9148[/C][C]0.002337[/C][/ROW]
[ROW][C]25[/C][C]0.260121[/C][C]2.2677[/C][C]0.013095[/C][/ROW]
[ROW][C]26[/C][C]0.187187[/C][C]1.6319[/C][C]0.053424[/C][/ROW]
[ROW][C]27[/C][C]0.080975[/C][C]0.7059[/C][C]0.241197[/C][/ROW]
[ROW][C]28[/C][C]-0.143177[/C][C]-1.2482[/C][C]0.107897[/C][/ROW]
[ROW][C]29[/C][C]-0.233386[/C][C]-2.0346[/C][C]0.022689[/C][/ROW]
[ROW][C]30[/C][C]-0.219101[/C][C]-1.9101[/C][C]0.029948[/C][/ROW]
[ROW][C]31[/C][C]-0.203046[/C][C]-1.7701[/C][C]0.04036[/C][/ROW]
[ROW][C]32[/C][C]-0.178178[/C][C]-1.5533[/C][C]0.062251[/C][/ROW]
[ROW][C]33[/C][C]0.019055[/C][C]0.1661[/C][C]0.434253[/C][/ROW]
[ROW][C]34[/C][C]0.002718[/C][C]0.0237[/C][C]0.490578[/C][/ROW]
[ROW][C]35[/C][C]0.200697[/C][C]1.7496[/C][C]0.042109[/C][/ROW]
[ROW][C]36[/C][C]0.192959[/C][C]1.6822[/C][C]0.04832[/C][/ROW]
[ROW][C]37[/C][C]0.248179[/C][C]2.1636[/C][C]0.01682[/C][/ROW]
[ROW][C]38[/C][C]0.047382[/C][C]0.4131[/C][C]0.340362[/C][/ROW]
[ROW][C]39[/C][C]0.101016[/C][C]0.8806[/C][C]0.190645[/C][/ROW]
[ROW][C]40[/C][C]-0.162632[/C][C]-1.4178[/C][C]0.080169[/C][/ROW]
[ROW][C]41[/C][C]-0.154769[/C][C]-1.3492[/C][C]0.090632[/C][/ROW]
[ROW][C]42[/C][C]-0.146908[/C][C]-1.2807[/C][C]0.102094[/C][/ROW]
[ROW][C]43[/C][C]-0.141575[/C][C]-1.2342[/C][C]0.110461[/C][/ROW]
[ROW][C]44[/C][C]-0.101156[/C][C]-0.8819[/C][C]0.190316[/C][/ROW]
[ROW][C]45[/C][C]-0.011124[/C][C]-0.097[/C][C]0.461499[/C][/ROW]
[ROW][C]46[/C][C]0.051141[/C][C]0.4458[/C][C]0.328492[/C][/ROW]
[ROW][C]47[/C][C]0.058017[/C][C]0.5058[/C][C]0.307238[/C][/ROW]
[ROW][C]48[/C][C]0.189038[/C][C]1.648[/C][C]0.051741[/C][/ROW]
[/TABLE]
Source: https://freestatistics.org/blog/index.php?pk=232213&T=1

Globally Unique Identifier (entire table): ba.freestatistics.org/blog/index.php?pk=232213&T=1

As an alternative you can also use a QR Code:  

The GUIDs for individual cells are displayed in the table below:

Autocorrelation Function
Time lag kACF(k)T-STATP-value
10.2776312.42030.008947
20.2297292.00270.024386
3-0.131974-1.15050.126768
4-0.248477-2.16620.016717
5-0.412365-3.59490.000287
6-0.331555-2.89040.002506
7-0.336216-2.93110.00223
8-0.248679-2.16790.016647
90.045810.39940.345374
100.1114250.97140.167221
110.3393832.95870.002059
120.434243.78560.000152
130.3230292.81610.003095
140.1193971.04090.150615
150.0738120.64350.260925
16-0.268925-2.34440.010835
17-0.265657-2.31590.01163
18-0.316891-2.76260.003594
19-0.269873-2.35270.010613
20-0.096581-0.8420.201222
21-0.008652-0.07540.470037
220.100880.87950.190965
230.1252111.09160.139237
240.3343562.91480.002337
250.2601212.26770.013095
260.1871871.63190.053424
270.0809750.70590.241197
28-0.143177-1.24820.107897
29-0.233386-2.03460.022689
30-0.219101-1.91010.029948
31-0.203046-1.77010.04036
32-0.178178-1.55330.062251
330.0190550.16610.434253
340.0027180.02370.490578
350.2006971.74960.042109
360.1929591.68220.04832
370.2481792.16360.01682
380.0473820.41310.340362
390.1010160.88060.190645
40-0.162632-1.41780.080169
41-0.154769-1.34920.090632
42-0.146908-1.28070.102094
43-0.141575-1.23420.110461
44-0.101156-0.88190.190316
45-0.011124-0.0970.461499
460.0511410.44580.328492
470.0580170.50580.307238
480.1890381.6480.051741


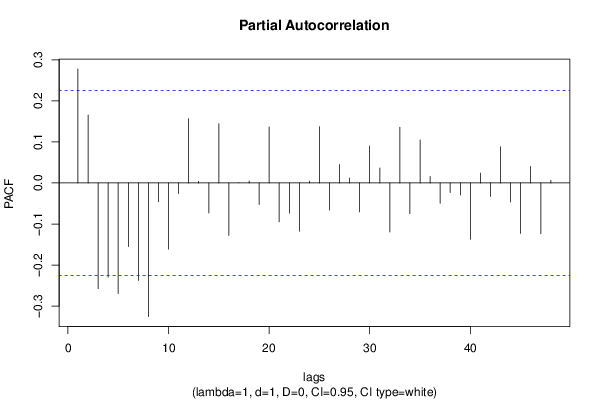
Partial Autocorrelation Function
Time lag kPACF(k)T-STATP-value
10.2776312.42030.008947
20.1653991.44190.076718
3-0.257471-2.24460.013852
4-0.229665-2.00220.024417
5-0.26946-2.34910.010709
6-0.155065-1.35180.09022
7-0.237549-2.07090.020882
8-0.325671-2.83910.0029
9-0.045968-0.40070.344869
10-0.161201-1.40530.082001
11-0.025738-0.22440.411533
120.1565941.36520.088116
130.0041130.03590.485745
14-0.073326-0.63920.262295
150.1440371.25570.106538
16-0.12773-1.11350.134496
17-2.2e-05-2e-040.499922
180.0047090.04110.483679
19-0.052494-0.45760.324262
200.1365081.190.118866
21-0.094775-0.82620.20563
22-0.073544-0.64110.261681
23-0.117664-1.02580.154126
240.0045020.03920.484398
250.1367191.19190.118506
26-0.066164-0.57680.282888
270.0449980.39230.347973
280.0119650.10430.4586
29-0.07057-0.61520.270124
300.0902030.78640.217049
310.0362910.31640.376293
32-0.119686-1.04340.150035
330.1356761.18280.120289
34-0.075181-0.65540.257091
350.1047920.91360.18192
360.0156170.13610.446032
37-0.049379-0.43050.334035
38-0.023247-0.20270.41997
39-0.029315-0.25560.399491
40-0.136978-1.19410.118068
410.0239870.20910.417459
42-0.033168-0.28920.386625
430.0880080.76720.222658
44-0.046518-0.40550.343114
45-0.122827-1.07080.143829
460.0400350.3490.364021
47-0.123582-1.07740.142364
480.0062420.05440.478373

\begin{tabular}{lllllllll}
\hline
Partial Autocorrelation Function \tabularnewline
Time lag k & PACF(k) & T-STAT & P-value \tabularnewline
1 & 0.277631 & 2.4203 & 0.008947 \tabularnewline
2 & 0.165399 & 1.4419 & 0.076718 \tabularnewline
3 & -0.257471 & -2.2446 & 0.013852 \tabularnewline
4 & -0.229665 & -2.0022 & 0.024417 \tabularnewline
5 & -0.26946 & -2.3491 & 0.010709 \tabularnewline
6 & -0.155065 & -1.3518 & 0.09022 \tabularnewline
7 & -0.237549 & -2.0709 & 0.020882 \tabularnewline
8 & -0.325671 & -2.8391 & 0.0029 \tabularnewline
9 & -0.045968 & -0.4007 & 0.344869 \tabularnewline
10 & -0.161201 & -1.4053 & 0.082001 \tabularnewline
11 & -0.025738 & -0.2244 & 0.411533 \tabularnewline
12 & 0.156594 & 1.3652 & 0.088116 \tabularnewline
13 & 0.004113 & 0.0359 & 0.485745 \tabularnewline
14 & -0.073326 & -0.6392 & 0.262295 \tabularnewline
15 & 0.144037 & 1.2557 & 0.106538 \tabularnewline
16 & -0.12773 & -1.1135 & 0.134496 \tabularnewline
17 & -2.2e-05 & -2e-04 & 0.499922 \tabularnewline
18 & 0.004709 & 0.0411 & 0.483679 \tabularnewline
19 & -0.052494 & -0.4576 & 0.324262 \tabularnewline
20 & 0.136508 & 1.19 & 0.118866 \tabularnewline
21 & -0.094775 & -0.8262 & 0.20563 \tabularnewline
22 & -0.073544 & -0.6411 & 0.261681 \tabularnewline
23 & -0.117664 & -1.0258 & 0.154126 \tabularnewline
24 & 0.004502 & 0.0392 & 0.484398 \tabularnewline
25 & 0.136719 & 1.1919 & 0.118506 \tabularnewline
26 & -0.066164 & -0.5768 & 0.282888 \tabularnewline
27 & 0.044998 & 0.3923 & 0.347973 \tabularnewline
28 & 0.011965 & 0.1043 & 0.4586 \tabularnewline
29 & -0.07057 & -0.6152 & 0.270124 \tabularnewline
30 & 0.090203 & 0.7864 & 0.217049 \tabularnewline
31 & 0.036291 & 0.3164 & 0.376293 \tabularnewline
32 & -0.119686 & -1.0434 & 0.150035 \tabularnewline
33 & 0.135676 & 1.1828 & 0.120289 \tabularnewline
34 & -0.075181 & -0.6554 & 0.257091 \tabularnewline
35 & 0.104792 & 0.9136 & 0.18192 \tabularnewline
36 & 0.015617 & 0.1361 & 0.446032 \tabularnewline
37 & -0.049379 & -0.4305 & 0.334035 \tabularnewline
38 & -0.023247 & -0.2027 & 0.41997 \tabularnewline
39 & -0.029315 & -0.2556 & 0.399491 \tabularnewline
40 & -0.136978 & -1.1941 & 0.118068 \tabularnewline
41 & 0.023987 & 0.2091 & 0.417459 \tabularnewline
42 & -0.033168 & -0.2892 & 0.386625 \tabularnewline
43 & 0.088008 & 0.7672 & 0.222658 \tabularnewline
44 & -0.046518 & -0.4055 & 0.343114 \tabularnewline
45 & -0.122827 & -1.0708 & 0.143829 \tabularnewline
46 & 0.040035 & 0.349 & 0.364021 \tabularnewline
47 & -0.123582 & -1.0774 & 0.142364 \tabularnewline
48 & 0.006242 & 0.0544 & 0.478373 \tabularnewline
\hline
\end{tabular}
%Source: https://freestatistics.org/blog/index.php?pk=232213&T=2

[TABLE]
[ROW][C]Partial Autocorrelation Function[/C][/ROW]
[ROW][C]Time lag k[/C][C]PACF(k)[/C][C]T-STAT[/C][C]P-value[/C][/ROW]
[ROW][C]1[/C][C]0.277631[/C][C]2.4203[/C][C]0.008947[/C][/ROW]
[ROW][C]2[/C][C]0.165399[/C][C]1.4419[/C][C]0.076718[/C][/ROW]
[ROW][C]3[/C][C]-0.257471[/C][C]-2.2446[/C][C]0.013852[/C][/ROW]
[ROW][C]4[/C][C]-0.229665[/C][C]-2.0022[/C][C]0.024417[/C][/ROW]
[ROW][C]5[/C][C]-0.26946[/C][C]-2.3491[/C][C]0.010709[/C][/ROW]
[ROW][C]6[/C][C]-0.155065[/C][C]-1.3518[/C][C]0.09022[/C][/ROW]
[ROW][C]7[/C][C]-0.237549[/C][C]-2.0709[/C][C]0.020882[/C][/ROW]
[ROW][C]8[/C][C]-0.325671[/C][C]-2.8391[/C][C]0.0029[/C][/ROW]
[ROW][C]9[/C][C]-0.045968[/C][C]-0.4007[/C][C]0.344869[/C][/ROW]
[ROW][C]10[/C][C]-0.161201[/C][C]-1.4053[/C][C]0.082001[/C][/ROW]
[ROW][C]11[/C][C]-0.025738[/C][C]-0.2244[/C][C]0.411533[/C][/ROW]
[ROW][C]12[/C][C]0.156594[/C][C]1.3652[/C][C]0.088116[/C][/ROW]
[ROW][C]13[/C][C]0.004113[/C][C]0.0359[/C][C]0.485745[/C][/ROW]
[ROW][C]14[/C][C]-0.073326[/C][C]-0.6392[/C][C]0.262295[/C][/ROW]
[ROW][C]15[/C][C]0.144037[/C][C]1.2557[/C][C]0.106538[/C][/ROW]
[ROW][C]16[/C][C]-0.12773[/C][C]-1.1135[/C][C]0.134496[/C][/ROW]
[ROW][C]17[/C][C]-2.2e-05[/C][C]-2e-04[/C][C]0.499922[/C][/ROW]
[ROW][C]18[/C][C]0.004709[/C][C]0.0411[/C][C]0.483679[/C][/ROW]
[ROW][C]19[/C][C]-0.052494[/C][C]-0.4576[/C][C]0.324262[/C][/ROW]
[ROW][C]20[/C][C]0.136508[/C][C]1.19[/C][C]0.118866[/C][/ROW]
[ROW][C]21[/C][C]-0.094775[/C][C]-0.8262[/C][C]0.20563[/C][/ROW]
[ROW][C]22[/C][C]-0.073544[/C][C]-0.6411[/C][C]0.261681[/C][/ROW]
[ROW][C]23[/C][C]-0.117664[/C][C]-1.0258[/C][C]0.154126[/C][/ROW]
[ROW][C]24[/C][C]0.004502[/C][C]0.0392[/C][C]0.484398[/C][/ROW]
[ROW][C]25[/C][C]0.136719[/C][C]1.1919[/C][C]0.118506[/C][/ROW]
[ROW][C]26[/C][C]-0.066164[/C][C]-0.5768[/C][C]0.282888[/C][/ROW]
[ROW][C]27[/C][C]0.044998[/C][C]0.3923[/C][C]0.347973[/C][/ROW]
[ROW][C]28[/C][C]0.011965[/C][C]0.1043[/C][C]0.4586[/C][/ROW]
[ROW][C]29[/C][C]-0.07057[/C][C]-0.6152[/C][C]0.270124[/C][/ROW]
[ROW][C]30[/C][C]0.090203[/C][C]0.7864[/C][C]0.217049[/C][/ROW]
[ROW][C]31[/C][C]0.036291[/C][C]0.3164[/C][C]0.376293[/C][/ROW]
[ROW][C]32[/C][C]-0.119686[/C][C]-1.0434[/C][C]0.150035[/C][/ROW]
[ROW][C]33[/C][C]0.135676[/C][C]1.1828[/C][C]0.120289[/C][/ROW]
[ROW][C]34[/C][C]-0.075181[/C][C]-0.6554[/C][C]0.257091[/C][/ROW]
[ROW][C]35[/C][C]0.104792[/C][C]0.9136[/C][C]0.18192[/C][/ROW]
[ROW][C]36[/C][C]0.015617[/C][C]0.1361[/C][C]0.446032[/C][/ROW]
[ROW][C]37[/C][C]-0.049379[/C][C]-0.4305[/C][C]0.334035[/C][/ROW]
[ROW][C]38[/C][C]-0.023247[/C][C]-0.2027[/C][C]0.41997[/C][/ROW]
[ROW][C]39[/C][C]-0.029315[/C][C]-0.2556[/C][C]0.399491[/C][/ROW]
[ROW][C]40[/C][C]-0.136978[/C][C]-1.1941[/C][C]0.118068[/C][/ROW]
[ROW][C]41[/C][C]0.023987[/C][C]0.2091[/C][C]0.417459[/C][/ROW]
[ROW][C]42[/C][C]-0.033168[/C][C]-0.2892[/C][C]0.386625[/C][/ROW]
[ROW][C]43[/C][C]0.088008[/C][C]0.7672[/C][C]0.222658[/C][/ROW]
[ROW][C]44[/C][C]-0.046518[/C][C]-0.4055[/C][C]0.343114[/C][/ROW]
[ROW][C]45[/C][C]-0.122827[/C][C]-1.0708[/C][C]0.143829[/C][/ROW]
[ROW][C]46[/C][C]0.040035[/C][C]0.349[/C][C]0.364021[/C][/ROW]
[ROW][C]47[/C][C]-0.123582[/C][C]-1.0774[/C][C]0.142364[/C][/ROW]
[ROW][C]48[/C][C]0.006242[/C][C]0.0544[/C][C]0.478373[/C][/ROW]
[/TABLE]
Source: https://freestatistics.org/blog/index.php?pk=232213&T=2

Globally Unique Identifier (entire table): ba.freestatistics.org/blog/index.php?pk=232213&T=2

As an alternative you can also use a QR Code:  

The GUIDs for individual cells are displayed in the table below:

Partial Autocorrelation Function
Time lag kPACF(k)T-STATP-value
10.2776312.42030.008947
20.1653991.44190.076718
3-0.257471-2.24460.013852
4-0.229665-2.00220.024417
5-0.26946-2.34910.010709
6-0.155065-1.35180.09022
7-0.237549-2.07090.020882
8-0.325671-2.83910.0029
9-0.045968-0.40070.344869
10-0.161201-1.40530.082001
11-0.025738-0.22440.411533
120.1565941.36520.088116
130.0041130.03590.485745
14-0.073326-0.63920.262295
150.1440371.25570.106538
16-0.12773-1.11350.134496
17-2.2e-05-2e-040.499922
180.0047090.04110.483679
19-0.052494-0.45760.324262
200.1365081.190.118866
21-0.094775-0.82620.20563
22-0.073544-0.64110.261681
23-0.117664-1.02580.154126
240.0045020.03920.484398
250.1367191.19190.118506
26-0.066164-0.57680.282888
270.0449980.39230.347973
280.0119650.10430.4586
29-0.07057-0.61520.270124
300.0902030.78640.217049
310.0362910.31640.376293
32-0.119686-1.04340.150035
330.1356761.18280.120289
34-0.075181-0.65540.257091
350.1047920.91360.18192
360.0156170.13610.446032
37-0.049379-0.43050.334035
38-0.023247-0.20270.41997
39-0.029315-0.25560.399491
40-0.136978-1.19410.118068
410.0239870.20910.417459
42-0.033168-0.28920.386625
430.0880080.76720.222658
44-0.046518-0.40550.343114
45-0.122827-1.07080.143829
460.0400350.3490.364021
47-0.123582-1.07740.142364
480.0062420.05440.478373


Parameters (Session):
par1 = 48 ; par2 = 1 ; par3 = 1 ; par4 = 0 ; par5 = 12 ; par6 = White Noise ; par7 = 0.95 ;
Parameters (R input):
par1 = 48 ; par2 = 1 ; par3 = 1 ; par4 = 0 ; par5 = 12 ; par6 = White Noise ; par7 = 0.95 ; par8 = ;
R code (references can be found in the software module):
if (par1 == 'Default') {
par1 = 10*log10(length(x))
} else {
par1 <- as.numeric(par1)
}
par2 <- as.numeric(par2)
par3 <- as.numeric(par3)
par4 <- as.numeric(par4)
par5 <- as.numeric(par5)
if (par6 == 'White Noise') par6 <- 'white' else par6 <- 'ma'
par7 <- as.numeric(par7)
if (par8 != '') par8 <- as.numeric(par8)
ox <- x
if (par8 == '') {
if (par2 == 0) {
x <- log(x)
} else {
x <- (x ^ par2 - 1) / par2
}
} else {
x <- log(x,base=par8)
}
if (par3 > 0) x <- diff(x,lag=1,difference=par3)
if (par4 > 0) x <- diff(x,lag=par5,difference=par4)
bitmap(file='picts.png')
op <- par(mfrow=c(2,1))
plot(ox,type='l',main='Original Time Series',xlab='time',ylab='value')
if (par8=='') {
mytitle <- paste('Working Time Series (lambda=',par2,', d=',par3,', D=',par4,')',sep='')
mysub <- paste('(lambda=',par2,', d=',par3,', D=',par4,', CI=', par7, ', CI type=',par6,')',sep='')
} else {
mytitle <- paste('Working Time Series (base=',par8,', d=',par3,', D=',par4,')',sep='')
mysub <- paste('(base=',par8,', d=',par3,', D=',par4,', CI=', par7, ', CI type=',par6,')',sep='')
}
plot(x,type='l', main=mytitle,xlab='time',ylab='value')
par(op)
dev.off()
bitmap(file='pic1.png')
racf <- acf(x, par1, main='Autocorrelation', xlab='time lag', ylab='ACF', ci.type=par6, ci=par7, sub=mysub)
dev.off()
bitmap(file='pic2.png')
rpacf <- pacf(x,par1,main='Partial Autocorrelation',xlab='lags',ylab='PACF',sub=mysub)
dev.off()
(myacf <- c(racf$acf))
(mypacf <- c(rpacf$acf))
lengthx <- length(x)
sqrtn <- sqrt(lengthx)
load(file='createtable')
a<-table.start()
a<-table.row.start(a)
a<-table.element(a,'Autocorrelation Function',4,TRUE)
a<-table.row.end(a)
a<-table.row.start(a)
a<-table.element(a,'Time lag k',header=TRUE)
a<-table.element(a,hyperlink('basics.htm','ACF(k)','click here for more information about the Autocorrelation Function'),header=TRUE)
a<-table.element(a,'T-STAT',header=TRUE)
a<-table.element(a,'P-value',header=TRUE)
a<-table.row.end(a)
for (i in 2:(par1+1)) {
a<-table.row.start(a)
a<-table.element(a,i-1,header=TRUE)
a<-table.element(a,round(myacf[i],6))
mytstat <- myacf[i]*sqrtn
a<-table.element(a,round(mytstat,4))
a<-table.element(a,round(1-pt(abs(mytstat),lengthx),6))
a<-table.row.end(a)
}
a<-table.end(a)
table.save(a,file='mytable.tab')
a<-table.start()
a<-table.row.start(a)
a<-table.element(a,'Partial Autocorrelation Function',4,TRUE)
a<-table.row.end(a)
a<-table.row.start(a)
a<-table.element(a,'Time lag k',header=TRUE)
a<-table.element(a,hyperlink('basics.htm','PACF(k)','click here for more information about the Partial Autocorrelation Function'),header=TRUE)
a<-table.element(a,'T-STAT',header=TRUE)
a<-table.element(a,'P-value',header=TRUE)
a<-table.row.end(a)
for (i in 1:par1) {
a<-table.row.start(a)
a<-table.element(a,i,header=TRUE)
a<-table.element(a,round(mypacf[i],6))
mytstat <- mypacf[i]*sqrtn
a<-table.element(a,round(mytstat,4))
a<-table.element(a,round(1-pt(abs(mytstat),lengthx),6))
a<-table.row.end(a)
}
a<-table.end(a)
table.save(a,file='mytable1.tab')