Free Statistics
of Irreproducible Research!
Description of Statistical Computation | |||||||||||||||||||||||||||||||||||||||||
|---|---|---|---|---|---|---|---|---|---|---|---|---|---|---|---|---|---|---|---|---|---|---|---|---|---|---|---|---|---|---|---|---|---|---|---|---|---|---|---|---|---|
| Author's title | |||||||||||||||||||||||||||||||||||||||||
| Author | *Unverified author* | ||||||||||||||||||||||||||||||||||||||||
| R Software Module | rwasp_univariatedataseries.wasp | ||||||||||||||||||||||||||||||||||||||||
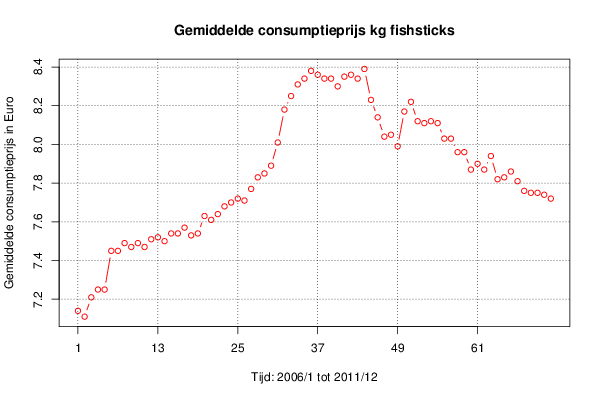
| Title produced by software | Univariate Data Series | ||||||||||||||||||||||||||||||||||||||||
| Date of computation | Tue, 05 Feb 2013 11:06:58 -0500 | ||||||||||||||||||||||||||||||||||||||||
| Cite this page as follows | Statistical Computations at FreeStatistics.org, Office for Research Development and Education, URL https://freestatistics.org/blog/index.php?v=date/2013/Feb/05/t1360080804h9p9djf5j2y0i0i.htm/, Retrieved Sat, 04 May 2024 17:48:02 +0000 | ||||||||||||||||||||||||||||||||||||||||
| Statistical Computations at FreeStatistics.org, Office for Research Development and Education, URL https://freestatistics.org/blog/index.php?pk=206064, Retrieved Sat, 04 May 2024 17:48:02 +0000 | |||||||||||||||||||||||||||||||||||||||||
| QR Codes: | |||||||||||||||||||||||||||||||||||||||||
|
| |||||||||||||||||||||||||||||||||||||||||
| Original text written by user: | |||||||||||||||||||||||||||||||||||||||||
| IsPrivate? | No (this computation is public) | ||||||||||||||||||||||||||||||||||||||||
| User-defined keywords | |||||||||||||||||||||||||||||||||||||||||
| Estimated Impact | 143 | ||||||||||||||||||||||||||||||||||||||||
Tree of Dependent Computations | |||||||||||||||||||||||||||||||||||||||||
| Family? (F = Feedback message, R = changed R code, M = changed R Module, P = changed Parameters, D = changed Data) | |||||||||||||||||||||||||||||||||||||||||
| - [Univariate Data Series] [Grafiek gemiddeld...] [2013-02-05 16:06:58] [1d769b43b3426eacfc1d7d5ec9e3993f] [Current] - RMPD [Histogram] [Histogram: gemidd...] [2013-02-11 19:44:26] [8938395a60f281c662ca944d44f5d825] - RMPD [Kernel Density Estimation] [Gemiddelde consum...] [2013-02-11 19:46:50] [8938395a60f281c662ca944d44f5d825] | |||||||||||||||||||||||||||||||||||||||||
| Feedback Forum | |||||||||||||||||||||||||||||||||||||||||
Post a new message | |||||||||||||||||||||||||||||||||||||||||
Dataset | |||||||||||||||||||||||||||||||||||||||||
| Dataseries X: | |||||||||||||||||||||||||||||||||||||||||
7,14 7,11 7,21 7,25 7,25 7,45 7,45 7,49 7,47 7,49 7,47 7,51 7,52 7,5 7,54 7,54 7,57 7,53 7,54 7,63 7,61 7,64 7,68 7,7 7,72 7,71 7,77 7,83 7,85 7,89 8,01 8,18 8,25 8,31 8,34 8,38 8,36 8,34 8,34 8,3 8,35 8,36 8,34 8,39 8,23 8,14 8,04 8,05 7,99 8,17 8,22 8,12 8,11 8,12 8,11 8,03 8,03 7,96 7,96 7,87 7,9 7,87 7,94 7,82 7,83 7,86 7,81 7,76 7,75 7,75 7,74 7,72 | |||||||||||||||||||||||||||||||||||||||||
Tables (Output of Computation) | |||||||||||||||||||||||||||||||||||||||||
| |||||||||||||||||||||||||||||||||||||||||
Figures (Output of Computation) | |||||||||||||||||||||||||||||||||||||||||
Input Parameters & R Code | |||||||||||||||||||||||||||||||||||||||||
| Parameters (Session): | |||||||||||||||||||||||||||||||||||||||||
| par1 = Gemiddelde consumptieprijs 1kg fish-sticks ; par2 = nbb.be ; par3 = Dit zijn de gemiddelde consumptieprijzen van 1kg fish-sticks, uitgedrukt per maand. ; par4 = 12 ; | |||||||||||||||||||||||||||||||||||||||||
| Parameters (R input): | |||||||||||||||||||||||||||||||||||||||||
| par1 = Gemiddelde consumptieprijs 1kg fish-sticks ; par2 = nbb.be ; par3 = Dit zijn de gemiddelde consumptieprijzen van 1kg fish-sticks, uitgedrukt per maand. ; par4 = 12 ; | |||||||||||||||||||||||||||||||||||||||||
| R code (references can be found in the software module): | |||||||||||||||||||||||||||||||||||||||||
if (par4 != 'No season') { | |||||||||||||||||||||||||||||||||||||||||