\begin{tabular}{lllllllll}
\hline
Summary of computational transaction \tabularnewline
Raw Input & view raw input (R code)  \tabularnewline
Raw Output & view raw output of R engine  \tabularnewline
Computing time & 2 seconds \tabularnewline
R Server & 'Sir Ronald Aylmer Fisher' @ fisher.wessa.net \tabularnewline
\hline
\end{tabular}
%Source: https://freestatistics.org/blog/index.php?pk=206288&T=0
[TABLE]
[ROW][C]Summary of computational transaction[/C][/ROW]
[ROW][C]Raw Input[/C][C]view raw input (R code) [/C][/ROW]
[ROW][C]Raw Output[/C][C]view raw output of R engine [/C][/ROW]
[ROW][C]Computing time[/C][C]2 seconds[/C][/ROW]
[ROW][C]R Server[/C][C]'Sir Ronald Aylmer Fisher' @ fisher.wessa.net[/C][/ROW]
[/TABLE]
Source: https://freestatistics.org/blog/index.php?pk=206288&T=0
If you paste this QR Code into your document, anyone with a smartphone or tablet will be able to scan it and view this table in a browser.
If you paste this QR Code into your document, anyone with a smartphone or tablet will be able to scan it and view this table in a browser.
If you paste this QR Code into your document, anyone with a smartphone or tablet will be able to scan it and view this table in a browser.
If you paste this QR Code into your document, anyone with a smartphone or tablet will be able to scan it and view this table in a browser.
If you paste this QR Code into your document, anyone with a smartphone or tablet will be able to scan it and view this table in a browser.
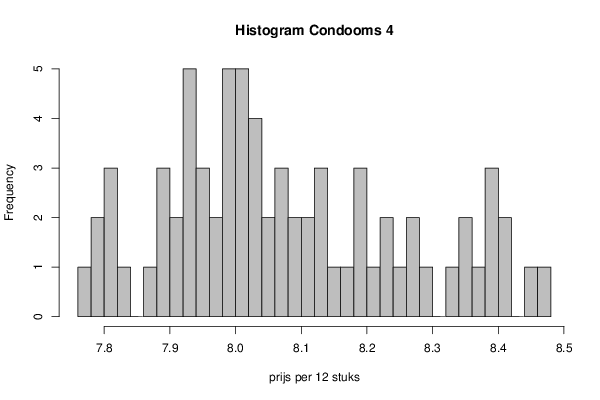
| Frequency Table (Histogram) | | Bins | Midpoint | Abs. Frequency | Rel. Frequency | Cumul. Rel. Freq. | Density | | [7.76,7.78[ | 7.77 | 1 | 0.013889 | 0.013889 | 0.694444 | | [7.78,7.8[ | 7.79 | 2 | 0.027778 | 0.041667 | 1.388889 | | [7.8,7.82[ | 7.81 | 3 | 0.041667 | 0.083333 | 2.083333 | | [7.82,7.84[ | 7.83 | 1 | 0.013889 | 0.097222 | 0.694444 | | [7.84,7.86[ | 7.85 | 0 | 0 | 0.097222 | 0 | | [7.86,7.88[ | 7.87 | 1 | 0.013889 | 0.111111 | 0.694444 | | [7.88,7.9[ | 7.89 | 3 | 0.041667 | 0.152778 | 2.083333 | | [7.9,7.92[ | 7.91 | 2 | 0.027778 | 0.180556 | 1.388889 | | [7.92,7.94[ | 7.93 | 5 | 0.069444 | 0.25 | 3.472222 | | [7.94,7.96[ | 7.95 | 3 | 0.041667 | 0.291667 | 2.083333 | | [7.96,7.98[ | 7.97 | 2 | 0.027778 | 0.319444 | 1.388889 | | [7.98,8[ | 7.99 | 5 | 0.069444 | 0.388889 | 3.472222 | | [8,8.02[ | 8.01 | 5 | 0.069444 | 0.458333 | 3.472222 | | [8.02,8.04[ | 8.03 | 4 | 0.055556 | 0.513889 | 2.777778 | | [8.04,8.06[ | 8.05 | 2 | 0.027778 | 0.541667 | 1.388889 | | [8.06,8.08[ | 8.07 | 3 | 0.041667 | 0.583333 | 2.083333 | | [8.08,8.1[ | 8.09 | 2 | 0.027778 | 0.611111 | 1.388889 | | [8.1,8.12[ | 8.11 | 2 | 0.027778 | 0.638889 | 1.388889 | | [8.12,8.14[ | 8.13 | 3 | 0.041667 | 0.680556 | 2.083333 | | [8.14,8.16[ | 8.15 | 1 | 0.013889 | 0.694444 | 0.694444 | | [8.16,8.18[ | 8.17 | 1 | 0.013889 | 0.708333 | 0.694444 | | [8.18,8.2[ | 8.19 | 3 | 0.041667 | 0.75 | 2.083333 | | [8.2,8.22[ | 8.21 | 1 | 0.013889 | 0.763889 | 0.694444 | | [8.22,8.24[ | 8.23 | 2 | 0.027778 | 0.791667 | 1.388889 | | [8.24,8.26[ | 8.25 | 1 | 0.013889 | 0.805556 | 0.694444 | | [8.26,8.28[ | 8.27 | 2 | 0.027778 | 0.833333 | 1.388889 | | [8.28,8.3[ | 8.29 | 1 | 0.013889 | 0.847222 | 0.694444 | | [8.3,8.32[ | 8.31 | 0 | 0 | 0.847222 | 0 | | [8.32,8.34[ | 8.33 | 1 | 0.013889 | 0.861111 | 0.694444 | | [8.34,8.36[ | 8.35 | 2 | 0.027778 | 0.888889 | 1.388889 | | [8.36,8.38[ | 8.37 | 1 | 0.013889 | 0.902778 | 0.694444 | | [8.38,8.4[ | 8.39 | 3 | 0.041667 | 0.944444 | 2.083333 | | [8.4,8.42[ | 8.41 | 2 | 0.027778 | 0.972222 | 1.388889 | | [8.42,8.44[ | 8.43 | 0 | 0 | 0.972222 | 0 | | [8.44,8.46[ | 8.45 | 1 | 0.013889 | 0.986111 | 0.694444 | | [8.46,8.48] | 8.47 | 1 | 0.013889 | 1 | 0.694444 |
\begin{tabular}{lllllllll}
\hline
Frequency Table (Histogram) \tabularnewline
Bins & Midpoint & Abs. Frequency & Rel. Frequency & Cumul. Rel. Freq. & Density \tabularnewline
[7.76,7.78[ & 7.77 & 1 & 0.013889 & 0.013889 & 0.694444 \tabularnewline
[7.78,7.8[ & 7.79 & 2 & 0.027778 & 0.041667 & 1.388889 \tabularnewline
[7.8,7.82[ & 7.81 & 3 & 0.041667 & 0.083333 & 2.083333 \tabularnewline
[7.82,7.84[ & 7.83 & 1 & 0.013889 & 0.097222 & 0.694444 \tabularnewline
[7.84,7.86[ & 7.85 & 0 & 0 & 0.097222 & 0 \tabularnewline
[7.86,7.88[ & 7.87 & 1 & 0.013889 & 0.111111 & 0.694444 \tabularnewline
[7.88,7.9[ & 7.89 & 3 & 0.041667 & 0.152778 & 2.083333 \tabularnewline
[7.9,7.92[ & 7.91 & 2 & 0.027778 & 0.180556 & 1.388889 \tabularnewline
[7.92,7.94[ & 7.93 & 5 & 0.069444 & 0.25 & 3.472222 \tabularnewline
[7.94,7.96[ & 7.95 & 3 & 0.041667 & 0.291667 & 2.083333 \tabularnewline
[7.96,7.98[ & 7.97 & 2 & 0.027778 & 0.319444 & 1.388889 \tabularnewline
[7.98,8[ & 7.99 & 5 & 0.069444 & 0.388889 & 3.472222 \tabularnewline
[8,8.02[ & 8.01 & 5 & 0.069444 & 0.458333 & 3.472222 \tabularnewline
[8.02,8.04[ & 8.03 & 4 & 0.055556 & 0.513889 & 2.777778 \tabularnewline
[8.04,8.06[ & 8.05 & 2 & 0.027778 & 0.541667 & 1.388889 \tabularnewline
[8.06,8.08[ & 8.07 & 3 & 0.041667 & 0.583333 & 2.083333 \tabularnewline
[8.08,8.1[ & 8.09 & 2 & 0.027778 & 0.611111 & 1.388889 \tabularnewline
[8.1,8.12[ & 8.11 & 2 & 0.027778 & 0.638889 & 1.388889 \tabularnewline
[8.12,8.14[ & 8.13 & 3 & 0.041667 & 0.680556 & 2.083333 \tabularnewline
[8.14,8.16[ & 8.15 & 1 & 0.013889 & 0.694444 & 0.694444 \tabularnewline
[8.16,8.18[ & 8.17 & 1 & 0.013889 & 0.708333 & 0.694444 \tabularnewline
[8.18,8.2[ & 8.19 & 3 & 0.041667 & 0.75 & 2.083333 \tabularnewline
[8.2,8.22[ & 8.21 & 1 & 0.013889 & 0.763889 & 0.694444 \tabularnewline
[8.22,8.24[ & 8.23 & 2 & 0.027778 & 0.791667 & 1.388889 \tabularnewline
[8.24,8.26[ & 8.25 & 1 & 0.013889 & 0.805556 & 0.694444 \tabularnewline
[8.26,8.28[ & 8.27 & 2 & 0.027778 & 0.833333 & 1.388889 \tabularnewline
[8.28,8.3[ & 8.29 & 1 & 0.013889 & 0.847222 & 0.694444 \tabularnewline
[8.3,8.32[ & 8.31 & 0 & 0 & 0.847222 & 0 \tabularnewline
[8.32,8.34[ & 8.33 & 1 & 0.013889 & 0.861111 & 0.694444 \tabularnewline
[8.34,8.36[ & 8.35 & 2 & 0.027778 & 0.888889 & 1.388889 \tabularnewline
[8.36,8.38[ & 8.37 & 1 & 0.013889 & 0.902778 & 0.694444 \tabularnewline
[8.38,8.4[ & 8.39 & 3 & 0.041667 & 0.944444 & 2.083333 \tabularnewline
[8.4,8.42[ & 8.41 & 2 & 0.027778 & 0.972222 & 1.388889 \tabularnewline
[8.42,8.44[ & 8.43 & 0 & 0 & 0.972222 & 0 \tabularnewline
[8.44,8.46[ & 8.45 & 1 & 0.013889 & 0.986111 & 0.694444 \tabularnewline
[8.46,8.48] & 8.47 & 1 & 0.013889 & 1 & 0.694444 \tabularnewline
\hline
\end{tabular}
%Source: https://freestatistics.org/blog/index.php?pk=206288&T=1
[TABLE]
[ROW][C]Frequency Table (Histogram)[/C][/ROW]
[ROW][C]Bins[/C][C]Midpoint[/C][C]Abs. Frequency[/C][C]Rel. Frequency[/C][C]Cumul. Rel. Freq.[/C][C]Density[/C][/ROW]
[ROW][C][7.76,7.78[[/C][C]7.77[/C][C]1[/C][C]0.013889[/C][C]0.013889[/C][C]0.694444[/C][/ROW]
[ROW][C][7.78,7.8[[/C][C]7.79[/C][C]2[/C][C]0.027778[/C][C]0.041667[/C][C]1.388889[/C][/ROW]
[ROW][C][7.8,7.82[[/C][C]7.81[/C][C]3[/C][C]0.041667[/C][C]0.083333[/C][C]2.083333[/C][/ROW]
[ROW][C][7.82,7.84[[/C][C]7.83[/C][C]1[/C][C]0.013889[/C][C]0.097222[/C][C]0.694444[/C][/ROW]
[ROW][C][7.84,7.86[[/C][C]7.85[/C][C]0[/C][C]0[/C][C]0.097222[/C][C]0[/C][/ROW]
[ROW][C][7.86,7.88[[/C][C]7.87[/C][C]1[/C][C]0.013889[/C][C]0.111111[/C][C]0.694444[/C][/ROW]
[ROW][C][7.88,7.9[[/C][C]7.89[/C][C]3[/C][C]0.041667[/C][C]0.152778[/C][C]2.083333[/C][/ROW]
[ROW][C][7.9,7.92[[/C][C]7.91[/C][C]2[/C][C]0.027778[/C][C]0.180556[/C][C]1.388889[/C][/ROW]
[ROW][C][7.92,7.94[[/C][C]7.93[/C][C]5[/C][C]0.069444[/C][C]0.25[/C][C]3.472222[/C][/ROW]
[ROW][C][7.94,7.96[[/C][C]7.95[/C][C]3[/C][C]0.041667[/C][C]0.291667[/C][C]2.083333[/C][/ROW]
[ROW][C][7.96,7.98[[/C][C]7.97[/C][C]2[/C][C]0.027778[/C][C]0.319444[/C][C]1.388889[/C][/ROW]
[ROW][C][7.98,8[[/C][C]7.99[/C][C]5[/C][C]0.069444[/C][C]0.388889[/C][C]3.472222[/C][/ROW]
[ROW][C][8,8.02[[/C][C]8.01[/C][C]5[/C][C]0.069444[/C][C]0.458333[/C][C]3.472222[/C][/ROW]
[ROW][C][8.02,8.04[[/C][C]8.03[/C][C]4[/C][C]0.055556[/C][C]0.513889[/C][C]2.777778[/C][/ROW]
[ROW][C][8.04,8.06[[/C][C]8.05[/C][C]2[/C][C]0.027778[/C][C]0.541667[/C][C]1.388889[/C][/ROW]
[ROW][C][8.06,8.08[[/C][C]8.07[/C][C]3[/C][C]0.041667[/C][C]0.583333[/C][C]2.083333[/C][/ROW]
[ROW][C][8.08,8.1[[/C][C]8.09[/C][C]2[/C][C]0.027778[/C][C]0.611111[/C][C]1.388889[/C][/ROW]
[ROW][C][8.1,8.12[[/C][C]8.11[/C][C]2[/C][C]0.027778[/C][C]0.638889[/C][C]1.388889[/C][/ROW]
[ROW][C][8.12,8.14[[/C][C]8.13[/C][C]3[/C][C]0.041667[/C][C]0.680556[/C][C]2.083333[/C][/ROW]
[ROW][C][8.14,8.16[[/C][C]8.15[/C][C]1[/C][C]0.013889[/C][C]0.694444[/C][C]0.694444[/C][/ROW]
[ROW][C][8.16,8.18[[/C][C]8.17[/C][C]1[/C][C]0.013889[/C][C]0.708333[/C][C]0.694444[/C][/ROW]
[ROW][C][8.18,8.2[[/C][C]8.19[/C][C]3[/C][C]0.041667[/C][C]0.75[/C][C]2.083333[/C][/ROW]
[ROW][C][8.2,8.22[[/C][C]8.21[/C][C]1[/C][C]0.013889[/C][C]0.763889[/C][C]0.694444[/C][/ROW]
[ROW][C][8.22,8.24[[/C][C]8.23[/C][C]2[/C][C]0.027778[/C][C]0.791667[/C][C]1.388889[/C][/ROW]
[ROW][C][8.24,8.26[[/C][C]8.25[/C][C]1[/C][C]0.013889[/C][C]0.805556[/C][C]0.694444[/C][/ROW]
[ROW][C][8.26,8.28[[/C][C]8.27[/C][C]2[/C][C]0.027778[/C][C]0.833333[/C][C]1.388889[/C][/ROW]
[ROW][C][8.28,8.3[[/C][C]8.29[/C][C]1[/C][C]0.013889[/C][C]0.847222[/C][C]0.694444[/C][/ROW]
[ROW][C][8.3,8.32[[/C][C]8.31[/C][C]0[/C][C]0[/C][C]0.847222[/C][C]0[/C][/ROW]
[ROW][C][8.32,8.34[[/C][C]8.33[/C][C]1[/C][C]0.013889[/C][C]0.861111[/C][C]0.694444[/C][/ROW]
[ROW][C][8.34,8.36[[/C][C]8.35[/C][C]2[/C][C]0.027778[/C][C]0.888889[/C][C]1.388889[/C][/ROW]
[ROW][C][8.36,8.38[[/C][C]8.37[/C][C]1[/C][C]0.013889[/C][C]0.902778[/C][C]0.694444[/C][/ROW]
[ROW][C][8.38,8.4[[/C][C]8.39[/C][C]3[/C][C]0.041667[/C][C]0.944444[/C][C]2.083333[/C][/ROW]
[ROW][C][8.4,8.42[[/C][C]8.41[/C][C]2[/C][C]0.027778[/C][C]0.972222[/C][C]1.388889[/C][/ROW]
[ROW][C][8.42,8.44[[/C][C]8.43[/C][C]0[/C][C]0[/C][C]0.972222[/C][C]0[/C][/ROW]
[ROW][C][8.44,8.46[[/C][C]8.45[/C][C]1[/C][C]0.013889[/C][C]0.986111[/C][C]0.694444[/C][/ROW]
[ROW][C][8.46,8.48][/C][C]8.47[/C][C]1[/C][C]0.013889[/C][C]1[/C][C]0.694444[/C][/ROW]
[/TABLE]
Source: https://freestatistics.org/blog/index.php?pk=206288&T=1
Globally Unique Identifier (entire table): ba.freestatistics.org/blog/index.php?pk=206288&T=1
As an alternative you can also use a QR Code:
The GUIDs for individual cells are displayed in the table below:
| Frequency Table (Histogram) | | Bins | Midpoint | Abs. Frequency | Rel. Frequency | Cumul. Rel. Freq. | Density | | [7.76,7.78[ | 7.77 | 1 | 0.013889 | 0.013889 | 0.694444 | | [7.78,7.8[ | 7.79 | 2 | 0.027778 | 0.041667 | 1.388889 | | [7.8,7.82[ | 7.81 | 3 | 0.041667 | 0.083333 | 2.083333 | | [7.82,7.84[ | 7.83 | 1 | 0.013889 | 0.097222 | 0.694444 | | [7.84,7.86[ | 7.85 | 0 | 0 | 0.097222 | 0 | | [7.86,7.88[ | 7.87 | 1 | 0.013889 | 0.111111 | 0.694444 | | [7.88,7.9[ | 7.89 | 3 | 0.041667 | 0.152778 | 2.083333 | | [7.9,7.92[ | 7.91 | 2 | 0.027778 | 0.180556 | 1.388889 | | [7.92,7.94[ | 7.93 | 5 | 0.069444 | 0.25 | 3.472222 | | [7.94,7.96[ | 7.95 | 3 | 0.041667 | 0.291667 | 2.083333 | | [7.96,7.98[ | 7.97 | 2 | 0.027778 | 0.319444 | 1.388889 | | [7.98,8[ | 7.99 | 5 | 0.069444 | 0.388889 | 3.472222 | | [8,8.02[ | 8.01 | 5 | 0.069444 | 0.458333 | 3.472222 | | [8.02,8.04[ | 8.03 | 4 | 0.055556 | 0.513889 | 2.777778 | | [8.04,8.06[ | 8.05 | 2 | 0.027778 | 0.541667 | 1.388889 | | [8.06,8.08[ | 8.07 | 3 | 0.041667 | 0.583333 | 2.083333 | | [8.08,8.1[ | 8.09 | 2 | 0.027778 | 0.611111 | 1.388889 | | [8.1,8.12[ | 8.11 | 2 | 0.027778 | 0.638889 | 1.388889 | | [8.12,8.14[ | 8.13 | 3 | 0.041667 | 0.680556 | 2.083333 | | [8.14,8.16[ | 8.15 | 1 | 0.013889 | 0.694444 | 0.694444 | | [8.16,8.18[ | 8.17 | 1 | 0.013889 | 0.708333 | 0.694444 | | [8.18,8.2[ | 8.19 | 3 | 0.041667 | 0.75 | 2.083333 | | [8.2,8.22[ | 8.21 | 1 | 0.013889 | 0.763889 | 0.694444 | | [8.22,8.24[ | 8.23 | 2 | 0.027778 | 0.791667 | 1.388889 | | [8.24,8.26[ | 8.25 | 1 | 0.013889 | 0.805556 | 0.694444 | | [8.26,8.28[ | 8.27 | 2 | 0.027778 | 0.833333 | 1.388889 | | [8.28,8.3[ | 8.29 | 1 | 0.013889 | 0.847222 | 0.694444 | | [8.3,8.32[ | 8.31 | 0 | 0 | 0.847222 | 0 | | [8.32,8.34[ | 8.33 | 1 | 0.013889 | 0.861111 | 0.694444 | | [8.34,8.36[ | 8.35 | 2 | 0.027778 | 0.888889 | 1.388889 | | [8.36,8.38[ | 8.37 | 1 | 0.013889 | 0.902778 | 0.694444 | | [8.38,8.4[ | 8.39 | 3 | 0.041667 | 0.944444 | 2.083333 | | [8.4,8.42[ | 8.41 | 2 | 0.027778 | 0.972222 | 1.388889 | | [8.42,8.44[ | 8.43 | 0 | 0 | 0.972222 | 0 | | [8.44,8.46[ | 8.45 | 1 | 0.013889 | 0.986111 | 0.694444 | | [8.46,8.48] | 8.47 | 1 | 0.013889 | 1 | 0.694444 |
If you paste this QR Code into your document, anyone with a smartphone or tablet will be able to scan it and view this table in a browser.
If you paste this QR Code into your document, anyone with a smartphone or tablet will be able to scan it and view this table in a browser.
If you paste this QR Code into your document, anyone with a smartphone or tablet will be able to scan it and view this table in a browser.
If you paste this QR Code into your document, anyone with a smartphone or tablet will be able to scan it and view this table in a browser.
If you paste this QR Code into your document, anyone with a smartphone or tablet will be able to scan it and view this table in a browser.
|