Free Statistics

of Irreproducible Research!

Author's title

Author*Unverified author*
R Software Modulerwasp_autocorrelation.wasp
Title produced by software(Partial) Autocorrelation Function
Date of computationThu, 03 Jan 2013 14:04:28 -0500
Cite this page as followsStatistical Computations at FreeStatistics.org, Office for Research Development and Education, URL https://freestatistics.org/blog/index.php?v=date/2013/Jan/03/t1357239921phhjgh0wdutqiqc.htm/, Retrieved Sat, 27 Apr 2024 12:55:42 +0000
Statistical Computations at FreeStatistics.org, Office for Research Development and Education, URL https://freestatistics.org/blog/index.php?pk=204987, Retrieved Sat, 27 Apr 2024 12:55:42 +0000
QR Codes:

Original text written by user:
IsPrivate?No (this computation is public)
User-defined keywords
Estimated Impact175
Family? (F = Feedback message, R = changed R code, M = changed R Module, P = changed Parameters, D = changed Data)
-     [(Partial) Autocorrelation Function] [Inschrijving nieu...] [2012-04-04 20:49:29] [dd1db122e2fe6bd517fcf7008a48ce3e]
-   PD    [(Partial) Autocorrelation Function] [Werkloosheid in B...] [2013-01-03 19:04:28] [3dc49aa854023f81b84d8b52a8455da2] [Current]
Feedback Forum

Post a new message
Dataseries X:
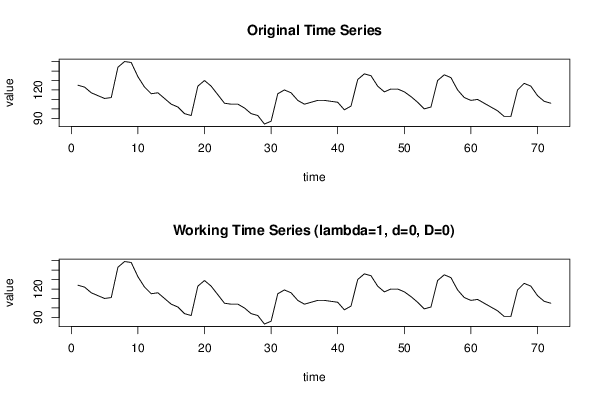
125
123
117
114
111
112
144
150
149
134
123
116
117
111
105
102
95
93
124
130
124
115
106
105
105
101
95
93
84
87
116
120
117
109
105
107
109
109
108
107
99
103
131
137
135
124
118
121
121
118
113
107
100
102
130
136
133
120
112
109
110
106
102
98
92
92
120
127
124
114
108
106


Summary of computational transaction
Raw Inputview raw input (R code)
Raw Outputview raw output of R engine
Computing time4 seconds
R Server'Sir Ronald Aylmer Fisher' @ fisher.wessa.net

\begin{tabular}{lllllllll}
\hline
Summary of computational transaction \tabularnewline
Raw Input & view raw input (R code)  \tabularnewline
Raw Output & view raw output of R engine  \tabularnewline
Computing time & 4 seconds \tabularnewline
R Server & 'Sir Ronald Aylmer Fisher' @ fisher.wessa.net \tabularnewline
\hline
\end{tabular}
%Source: https://freestatistics.org/blog/index.php?pk=204987&T=0

[TABLE]
[ROW][C]Summary of computational transaction[/C][/ROW]
[ROW][C]Raw Input[/C][C]view raw input (R code) [/C][/ROW]
[ROW][C]Raw Output[/C][C]view raw output of R engine [/C][/ROW]
[ROW][C]Computing time[/C][C]4 seconds[/C][/ROW]
[ROW][C]R Server[/C][C]'Sir Ronald Aylmer Fisher' @ fisher.wessa.net[/C][/ROW]
[/TABLE]
Source: https://freestatistics.org/blog/index.php?pk=204987&T=0

Globally Unique Identifier (entire table): ba.freestatistics.org/blog/index.php?pk=204987&T=0

As an alternative you can also use a QR Code:  

The GUIDs for individual cells are displayed in the table below:

Summary of computational transaction
Raw Inputview raw input (R code)
Raw Outputview raw output of R engine
Computing time4 seconds
R Server'Sir Ronald Aylmer Fisher' @ fisher.wessa.net


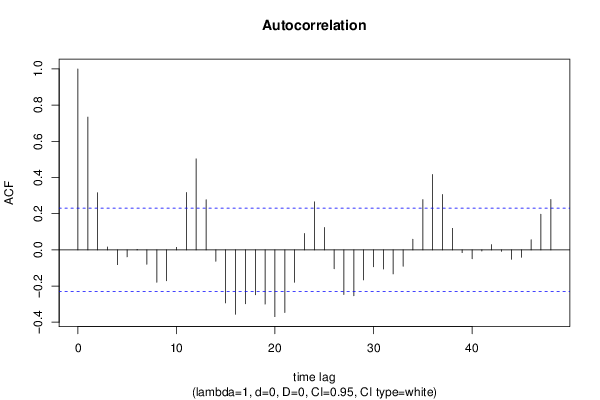
Autocorrelation Function
Time lag kACF(k)T-STATP-value
10.7339926.22810
20.3156362.67830.004581
30.0155680.13210.447638
4-0.081435-0.6910.245895
5-0.038559-0.32720.37224
60.0030280.02570.489785
7-0.079677-0.67610.250577
8-0.178623-1.51570.066991
9-0.171082-1.45170.075467
100.0138550.11760.45337
110.3169542.68940.004444
120.5031874.26972.9e-05
130.2766982.34790.010816
14-0.063306-0.53720.296403
15-0.292907-2.48540.007632
16-0.356065-3.02130.001741
17-0.297852-2.52740.006844
18-0.248436-2.1080.019254
19-0.299703-2.54310.006569
20-0.369089-3.13180.001256
21-0.346647-2.94140.002196
22-0.1792-1.52060.066375
230.0908780.77110.221578
240.2655682.25340.01364
250.1240181.05230.148085
26-0.104093-0.88330.190018
27-0.246268-2.08960.020091
28-0.253401-2.15020.01745
29-0.165745-1.40640.081955
30-0.092984-0.7890.216352
31-0.106041-0.89980.185618
32-0.132636-1.12550.132068
33-0.090795-0.77040.221785
340.0589460.50020.30924
350.2777322.35660.010582
360.4165223.53430.000359
370.3062682.59880.005671
380.1188881.00880.158226
39-0.015474-0.13130.447951
40-0.04881-0.41420.339991
41-0.006214-0.05270.479046
420.0291840.24760.40256
43-0.008362-0.0710.471816
44-0.052033-0.44150.330082
45-0.040639-0.34480.365612
460.0557560.47310.318785
470.19691.67080.049556
480.2786712.36460.010374

\begin{tabular}{lllllllll}
\hline
Autocorrelation Function \tabularnewline
Time lag k & ACF(k) & T-STAT & P-value \tabularnewline
1 & 0.733992 & 6.2281 & 0 \tabularnewline
2 & 0.315636 & 2.6783 & 0.004581 \tabularnewline
3 & 0.015568 & 0.1321 & 0.447638 \tabularnewline
4 & -0.081435 & -0.691 & 0.245895 \tabularnewline
5 & -0.038559 & -0.3272 & 0.37224 \tabularnewline
6 & 0.003028 & 0.0257 & 0.489785 \tabularnewline
7 & -0.079677 & -0.6761 & 0.250577 \tabularnewline
8 & -0.178623 & -1.5157 & 0.066991 \tabularnewline
9 & -0.171082 & -1.4517 & 0.075467 \tabularnewline
10 & 0.013855 & 0.1176 & 0.45337 \tabularnewline
11 & 0.316954 & 2.6894 & 0.004444 \tabularnewline
12 & 0.503187 & 4.2697 & 2.9e-05 \tabularnewline
13 & 0.276698 & 2.3479 & 0.010816 \tabularnewline
14 & -0.063306 & -0.5372 & 0.296403 \tabularnewline
15 & -0.292907 & -2.4854 & 0.007632 \tabularnewline
16 & -0.356065 & -3.0213 & 0.001741 \tabularnewline
17 & -0.297852 & -2.5274 & 0.006844 \tabularnewline
18 & -0.248436 & -2.108 & 0.019254 \tabularnewline
19 & -0.299703 & -2.5431 & 0.006569 \tabularnewline
20 & -0.369089 & -3.1318 & 0.001256 \tabularnewline
21 & -0.346647 & -2.9414 & 0.002196 \tabularnewline
22 & -0.1792 & -1.5206 & 0.066375 \tabularnewline
23 & 0.090878 & 0.7711 & 0.221578 \tabularnewline
24 & 0.265568 & 2.2534 & 0.01364 \tabularnewline
25 & 0.124018 & 1.0523 & 0.148085 \tabularnewline
26 & -0.104093 & -0.8833 & 0.190018 \tabularnewline
27 & -0.246268 & -2.0896 & 0.020091 \tabularnewline
28 & -0.253401 & -2.1502 & 0.01745 \tabularnewline
29 & -0.165745 & -1.4064 & 0.081955 \tabularnewline
30 & -0.092984 & -0.789 & 0.216352 \tabularnewline
31 & -0.106041 & -0.8998 & 0.185618 \tabularnewline
32 & -0.132636 & -1.1255 & 0.132068 \tabularnewline
33 & -0.090795 & -0.7704 & 0.221785 \tabularnewline
34 & 0.058946 & 0.5002 & 0.30924 \tabularnewline
35 & 0.277732 & 2.3566 & 0.010582 \tabularnewline
36 & 0.416522 & 3.5343 & 0.000359 \tabularnewline
37 & 0.306268 & 2.5988 & 0.005671 \tabularnewline
38 & 0.118888 & 1.0088 & 0.158226 \tabularnewline
39 & -0.015474 & -0.1313 & 0.447951 \tabularnewline
40 & -0.04881 & -0.4142 & 0.339991 \tabularnewline
41 & -0.006214 & -0.0527 & 0.479046 \tabularnewline
42 & 0.029184 & 0.2476 & 0.40256 \tabularnewline
43 & -0.008362 & -0.071 & 0.471816 \tabularnewline
44 & -0.052033 & -0.4415 & 0.330082 \tabularnewline
45 & -0.040639 & -0.3448 & 0.365612 \tabularnewline
46 & 0.055756 & 0.4731 & 0.318785 \tabularnewline
47 & 0.1969 & 1.6708 & 0.049556 \tabularnewline
48 & 0.278671 & 2.3646 & 0.010374 \tabularnewline
\hline
\end{tabular}
%Source: https://freestatistics.org/blog/index.php?pk=204987&T=1

[TABLE]
[ROW][C]Autocorrelation Function[/C][/ROW]
[ROW][C]Time lag k[/C][C]ACF(k)[/C][C]T-STAT[/C][C]P-value[/C][/ROW]
[ROW][C]1[/C][C]0.733992[/C][C]6.2281[/C][C]0[/C][/ROW]
[ROW][C]2[/C][C]0.315636[/C][C]2.6783[/C][C]0.004581[/C][/ROW]
[ROW][C]3[/C][C]0.015568[/C][C]0.1321[/C][C]0.447638[/C][/ROW]
[ROW][C]4[/C][C]-0.081435[/C][C]-0.691[/C][C]0.245895[/C][/ROW]
[ROW][C]5[/C][C]-0.038559[/C][C]-0.3272[/C][C]0.37224[/C][/ROW]
[ROW][C]6[/C][C]0.003028[/C][C]0.0257[/C][C]0.489785[/C][/ROW]
[ROW][C]7[/C][C]-0.079677[/C][C]-0.6761[/C][C]0.250577[/C][/ROW]
[ROW][C]8[/C][C]-0.178623[/C][C]-1.5157[/C][C]0.066991[/C][/ROW]
[ROW][C]9[/C][C]-0.171082[/C][C]-1.4517[/C][C]0.075467[/C][/ROW]
[ROW][C]10[/C][C]0.013855[/C][C]0.1176[/C][C]0.45337[/C][/ROW]
[ROW][C]11[/C][C]0.316954[/C][C]2.6894[/C][C]0.004444[/C][/ROW]
[ROW][C]12[/C][C]0.503187[/C][C]4.2697[/C][C]2.9e-05[/C][/ROW]
[ROW][C]13[/C][C]0.276698[/C][C]2.3479[/C][C]0.010816[/C][/ROW]
[ROW][C]14[/C][C]-0.063306[/C][C]-0.5372[/C][C]0.296403[/C][/ROW]
[ROW][C]15[/C][C]-0.292907[/C][C]-2.4854[/C][C]0.007632[/C][/ROW]
[ROW][C]16[/C][C]-0.356065[/C][C]-3.0213[/C][C]0.001741[/C][/ROW]
[ROW][C]17[/C][C]-0.297852[/C][C]-2.5274[/C][C]0.006844[/C][/ROW]
[ROW][C]18[/C][C]-0.248436[/C][C]-2.108[/C][C]0.019254[/C][/ROW]
[ROW][C]19[/C][C]-0.299703[/C][C]-2.5431[/C][C]0.006569[/C][/ROW]
[ROW][C]20[/C][C]-0.369089[/C][C]-3.1318[/C][C]0.001256[/C][/ROW]
[ROW][C]21[/C][C]-0.346647[/C][C]-2.9414[/C][C]0.002196[/C][/ROW]
[ROW][C]22[/C][C]-0.1792[/C][C]-1.5206[/C][C]0.066375[/C][/ROW]
[ROW][C]23[/C][C]0.090878[/C][C]0.7711[/C][C]0.221578[/C][/ROW]
[ROW][C]24[/C][C]0.265568[/C][C]2.2534[/C][C]0.01364[/C][/ROW]
[ROW][C]25[/C][C]0.124018[/C][C]1.0523[/C][C]0.148085[/C][/ROW]
[ROW][C]26[/C][C]-0.104093[/C][C]-0.8833[/C][C]0.190018[/C][/ROW]
[ROW][C]27[/C][C]-0.246268[/C][C]-2.0896[/C][C]0.020091[/C][/ROW]
[ROW][C]28[/C][C]-0.253401[/C][C]-2.1502[/C][C]0.01745[/C][/ROW]
[ROW][C]29[/C][C]-0.165745[/C][C]-1.4064[/C][C]0.081955[/C][/ROW]
[ROW][C]30[/C][C]-0.092984[/C][C]-0.789[/C][C]0.216352[/C][/ROW]
[ROW][C]31[/C][C]-0.106041[/C][C]-0.8998[/C][C]0.185618[/C][/ROW]
[ROW][C]32[/C][C]-0.132636[/C][C]-1.1255[/C][C]0.132068[/C][/ROW]
[ROW][C]33[/C][C]-0.090795[/C][C]-0.7704[/C][C]0.221785[/C][/ROW]
[ROW][C]34[/C][C]0.058946[/C][C]0.5002[/C][C]0.30924[/C][/ROW]
[ROW][C]35[/C][C]0.277732[/C][C]2.3566[/C][C]0.010582[/C][/ROW]
[ROW][C]36[/C][C]0.416522[/C][C]3.5343[/C][C]0.000359[/C][/ROW]
[ROW][C]37[/C][C]0.306268[/C][C]2.5988[/C][C]0.005671[/C][/ROW]
[ROW][C]38[/C][C]0.118888[/C][C]1.0088[/C][C]0.158226[/C][/ROW]
[ROW][C]39[/C][C]-0.015474[/C][C]-0.1313[/C][C]0.447951[/C][/ROW]
[ROW][C]40[/C][C]-0.04881[/C][C]-0.4142[/C][C]0.339991[/C][/ROW]
[ROW][C]41[/C][C]-0.006214[/C][C]-0.0527[/C][C]0.479046[/C][/ROW]
[ROW][C]42[/C][C]0.029184[/C][C]0.2476[/C][C]0.40256[/C][/ROW]
[ROW][C]43[/C][C]-0.008362[/C][C]-0.071[/C][C]0.471816[/C][/ROW]
[ROW][C]44[/C][C]-0.052033[/C][C]-0.4415[/C][C]0.330082[/C][/ROW]
[ROW][C]45[/C][C]-0.040639[/C][C]-0.3448[/C][C]0.365612[/C][/ROW]
[ROW][C]46[/C][C]0.055756[/C][C]0.4731[/C][C]0.318785[/C][/ROW]
[ROW][C]47[/C][C]0.1969[/C][C]1.6708[/C][C]0.049556[/C][/ROW]
[ROW][C]48[/C][C]0.278671[/C][C]2.3646[/C][C]0.010374[/C][/ROW]
[/TABLE]
Source: https://freestatistics.org/blog/index.php?pk=204987&T=1

Globally Unique Identifier (entire table): ba.freestatistics.org/blog/index.php?pk=204987&T=1

As an alternative you can also use a QR Code:  

The GUIDs for individual cells are displayed in the table below:

Autocorrelation Function
Time lag kACF(k)T-STATP-value
10.7339926.22810
20.3156362.67830.004581
30.0155680.13210.447638
4-0.081435-0.6910.245895
5-0.038559-0.32720.37224
60.0030280.02570.489785
7-0.079677-0.67610.250577
8-0.178623-1.51570.066991
9-0.171082-1.45170.075467
100.0138550.11760.45337
110.3169542.68940.004444
120.5031874.26972.9e-05
130.2766982.34790.010816
14-0.063306-0.53720.296403
15-0.292907-2.48540.007632
16-0.356065-3.02130.001741
17-0.297852-2.52740.006844
18-0.248436-2.1080.019254
19-0.299703-2.54310.006569
20-0.369089-3.13180.001256
21-0.346647-2.94140.002196
22-0.1792-1.52060.066375
230.0908780.77110.221578
240.2655682.25340.01364
250.1240181.05230.148085
26-0.104093-0.88330.190018
27-0.246268-2.08960.020091
28-0.253401-2.15020.01745
29-0.165745-1.40640.081955
30-0.092984-0.7890.216352
31-0.106041-0.89980.185618
32-0.132636-1.12550.132068
33-0.090795-0.77040.221785
340.0589460.50020.30924
350.2777322.35660.010582
360.4165223.53430.000359
370.3062682.59880.005671
380.1188881.00880.158226
39-0.015474-0.13130.447951
40-0.04881-0.41420.339991
41-0.006214-0.05270.479046
420.0291840.24760.40256
43-0.008362-0.0710.471816
44-0.052033-0.44150.330082
45-0.040639-0.34480.365612
460.0557560.47310.318785
470.19691.67080.049556
480.2786712.36460.010374


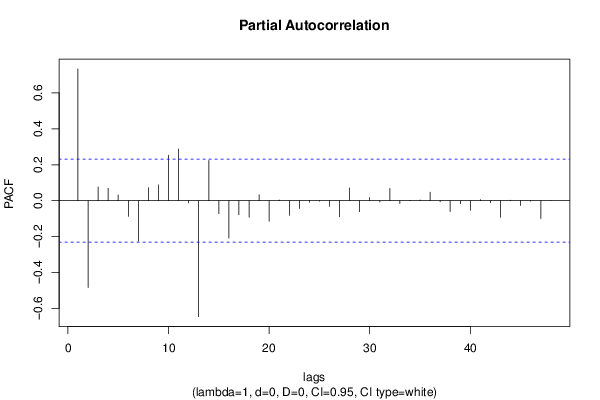
Partial Autocorrelation Function
Time lag kPACF(k)T-STATP-value
10.7339926.22810
2-0.483698-4.10435.3e-05
30.0760260.64510.260456
40.0684390.58070.28162
50.0314620.2670.39513
6-0.08768-0.7440.229651
7-0.225753-1.91560.029695
80.0721430.61220.271183
90.0880940.74750.228598
100.2532062.14850.017518
110.28732.43780.008623
12-0.012523-0.10630.457836
13-0.646447-5.48530
140.2236241.89750.030885
15-0.07283-0.6180.269269
16-0.208691-1.77080.040413
17-0.078499-0.66610.253742
18-0.092326-0.78340.217977
190.0326350.27690.391317
20-0.114703-0.97330.166834
210.0040880.03470.486211
22-0.081946-0.69530.244542
23-0.043531-0.36940.356466
24-0.008668-0.07350.470787
25-0.002473-0.0210.491658
26-0.031923-0.27090.39363
27-0.090152-0.7650.223395
280.0703360.59680.27625
29-0.061674-0.52330.301178
300.0175450.14890.441034
31-0.007945-0.06740.47322
320.0675960.57360.284022
33-0.015963-0.13550.446316
340.0015220.01290.494867
350.0034110.02890.488496
360.0465450.3950.347023
37-0.006446-0.05470.478266
38-0.060732-0.51530.303952
39-0.016629-0.14110.444093
40-0.054099-0.4590.323791
410.0058430.04960.480298
42-0.011254-0.09550.462093
43-0.092919-0.78840.216512
440.002450.02080.491737
45-0.026773-0.22720.410464
46-0.002619-0.02220.491164
47-0.099759-0.84650.200043
480.0003990.00340.498653

\begin{tabular}{lllllllll}
\hline
Partial Autocorrelation Function \tabularnewline
Time lag k & PACF(k) & T-STAT & P-value \tabularnewline
1 & 0.733992 & 6.2281 & 0 \tabularnewline
2 & -0.483698 & -4.1043 & 5.3e-05 \tabularnewline
3 & 0.076026 & 0.6451 & 0.260456 \tabularnewline
4 & 0.068439 & 0.5807 & 0.28162 \tabularnewline
5 & 0.031462 & 0.267 & 0.39513 \tabularnewline
6 & -0.08768 & -0.744 & 0.229651 \tabularnewline
7 & -0.225753 & -1.9156 & 0.029695 \tabularnewline
8 & 0.072143 & 0.6122 & 0.271183 \tabularnewline
9 & 0.088094 & 0.7475 & 0.228598 \tabularnewline
10 & 0.253206 & 2.1485 & 0.017518 \tabularnewline
11 & 0.2873 & 2.4378 & 0.008623 \tabularnewline
12 & -0.012523 & -0.1063 & 0.457836 \tabularnewline
13 & -0.646447 & -5.4853 & 0 \tabularnewline
14 & 0.223624 & 1.8975 & 0.030885 \tabularnewline
15 & -0.07283 & -0.618 & 0.269269 \tabularnewline
16 & -0.208691 & -1.7708 & 0.040413 \tabularnewline
17 & -0.078499 & -0.6661 & 0.253742 \tabularnewline
18 & -0.092326 & -0.7834 & 0.217977 \tabularnewline
19 & 0.032635 & 0.2769 & 0.391317 \tabularnewline
20 & -0.114703 & -0.9733 & 0.166834 \tabularnewline
21 & 0.004088 & 0.0347 & 0.486211 \tabularnewline
22 & -0.081946 & -0.6953 & 0.244542 \tabularnewline
23 & -0.043531 & -0.3694 & 0.356466 \tabularnewline
24 & -0.008668 & -0.0735 & 0.470787 \tabularnewline
25 & -0.002473 & -0.021 & 0.491658 \tabularnewline
26 & -0.031923 & -0.2709 & 0.39363 \tabularnewline
27 & -0.090152 & -0.765 & 0.223395 \tabularnewline
28 & 0.070336 & 0.5968 & 0.27625 \tabularnewline
29 & -0.061674 & -0.5233 & 0.301178 \tabularnewline
30 & 0.017545 & 0.1489 & 0.441034 \tabularnewline
31 & -0.007945 & -0.0674 & 0.47322 \tabularnewline
32 & 0.067596 & 0.5736 & 0.284022 \tabularnewline
33 & -0.015963 & -0.1355 & 0.446316 \tabularnewline
34 & 0.001522 & 0.0129 & 0.494867 \tabularnewline
35 & 0.003411 & 0.0289 & 0.488496 \tabularnewline
36 & 0.046545 & 0.395 & 0.347023 \tabularnewline
37 & -0.006446 & -0.0547 & 0.478266 \tabularnewline
38 & -0.060732 & -0.5153 & 0.303952 \tabularnewline
39 & -0.016629 & -0.1411 & 0.444093 \tabularnewline
40 & -0.054099 & -0.459 & 0.323791 \tabularnewline
41 & 0.005843 & 0.0496 & 0.480298 \tabularnewline
42 & -0.011254 & -0.0955 & 0.462093 \tabularnewline
43 & -0.092919 & -0.7884 & 0.216512 \tabularnewline
44 & 0.00245 & 0.0208 & 0.491737 \tabularnewline
45 & -0.026773 & -0.2272 & 0.410464 \tabularnewline
46 & -0.002619 & -0.0222 & 0.491164 \tabularnewline
47 & -0.099759 & -0.8465 & 0.200043 \tabularnewline
48 & 0.000399 & 0.0034 & 0.498653 \tabularnewline
\hline
\end{tabular}
%Source: https://freestatistics.org/blog/index.php?pk=204987&T=2

[TABLE]
[ROW][C]Partial Autocorrelation Function[/C][/ROW]
[ROW][C]Time lag k[/C][C]PACF(k)[/C][C]T-STAT[/C][C]P-value[/C][/ROW]
[ROW][C]1[/C][C]0.733992[/C][C]6.2281[/C][C]0[/C][/ROW]
[ROW][C]2[/C][C]-0.483698[/C][C]-4.1043[/C][C]5.3e-05[/C][/ROW]
[ROW][C]3[/C][C]0.076026[/C][C]0.6451[/C][C]0.260456[/C][/ROW]
[ROW][C]4[/C][C]0.068439[/C][C]0.5807[/C][C]0.28162[/C][/ROW]
[ROW][C]5[/C][C]0.031462[/C][C]0.267[/C][C]0.39513[/C][/ROW]
[ROW][C]6[/C][C]-0.08768[/C][C]-0.744[/C][C]0.229651[/C][/ROW]
[ROW][C]7[/C][C]-0.225753[/C][C]-1.9156[/C][C]0.029695[/C][/ROW]
[ROW][C]8[/C][C]0.072143[/C][C]0.6122[/C][C]0.271183[/C][/ROW]
[ROW][C]9[/C][C]0.088094[/C][C]0.7475[/C][C]0.228598[/C][/ROW]
[ROW][C]10[/C][C]0.253206[/C][C]2.1485[/C][C]0.017518[/C][/ROW]
[ROW][C]11[/C][C]0.2873[/C][C]2.4378[/C][C]0.008623[/C][/ROW]
[ROW][C]12[/C][C]-0.012523[/C][C]-0.1063[/C][C]0.457836[/C][/ROW]
[ROW][C]13[/C][C]-0.646447[/C][C]-5.4853[/C][C]0[/C][/ROW]
[ROW][C]14[/C][C]0.223624[/C][C]1.8975[/C][C]0.030885[/C][/ROW]
[ROW][C]15[/C][C]-0.07283[/C][C]-0.618[/C][C]0.269269[/C][/ROW]
[ROW][C]16[/C][C]-0.208691[/C][C]-1.7708[/C][C]0.040413[/C][/ROW]
[ROW][C]17[/C][C]-0.078499[/C][C]-0.6661[/C][C]0.253742[/C][/ROW]
[ROW][C]18[/C][C]-0.092326[/C][C]-0.7834[/C][C]0.217977[/C][/ROW]
[ROW][C]19[/C][C]0.032635[/C][C]0.2769[/C][C]0.391317[/C][/ROW]
[ROW][C]20[/C][C]-0.114703[/C][C]-0.9733[/C][C]0.166834[/C][/ROW]
[ROW][C]21[/C][C]0.004088[/C][C]0.0347[/C][C]0.486211[/C][/ROW]
[ROW][C]22[/C][C]-0.081946[/C][C]-0.6953[/C][C]0.244542[/C][/ROW]
[ROW][C]23[/C][C]-0.043531[/C][C]-0.3694[/C][C]0.356466[/C][/ROW]
[ROW][C]24[/C][C]-0.008668[/C][C]-0.0735[/C][C]0.470787[/C][/ROW]
[ROW][C]25[/C][C]-0.002473[/C][C]-0.021[/C][C]0.491658[/C][/ROW]
[ROW][C]26[/C][C]-0.031923[/C][C]-0.2709[/C][C]0.39363[/C][/ROW]
[ROW][C]27[/C][C]-0.090152[/C][C]-0.765[/C][C]0.223395[/C][/ROW]
[ROW][C]28[/C][C]0.070336[/C][C]0.5968[/C][C]0.27625[/C][/ROW]
[ROW][C]29[/C][C]-0.061674[/C][C]-0.5233[/C][C]0.301178[/C][/ROW]
[ROW][C]30[/C][C]0.017545[/C][C]0.1489[/C][C]0.441034[/C][/ROW]
[ROW][C]31[/C][C]-0.007945[/C][C]-0.0674[/C][C]0.47322[/C][/ROW]
[ROW][C]32[/C][C]0.067596[/C][C]0.5736[/C][C]0.284022[/C][/ROW]
[ROW][C]33[/C][C]-0.015963[/C][C]-0.1355[/C][C]0.446316[/C][/ROW]
[ROW][C]34[/C][C]0.001522[/C][C]0.0129[/C][C]0.494867[/C][/ROW]
[ROW][C]35[/C][C]0.003411[/C][C]0.0289[/C][C]0.488496[/C][/ROW]
[ROW][C]36[/C][C]0.046545[/C][C]0.395[/C][C]0.347023[/C][/ROW]
[ROW][C]37[/C][C]-0.006446[/C][C]-0.0547[/C][C]0.478266[/C][/ROW]
[ROW][C]38[/C][C]-0.060732[/C][C]-0.5153[/C][C]0.303952[/C][/ROW]
[ROW][C]39[/C][C]-0.016629[/C][C]-0.1411[/C][C]0.444093[/C][/ROW]
[ROW][C]40[/C][C]-0.054099[/C][C]-0.459[/C][C]0.323791[/C][/ROW]
[ROW][C]41[/C][C]0.005843[/C][C]0.0496[/C][C]0.480298[/C][/ROW]
[ROW][C]42[/C][C]-0.011254[/C][C]-0.0955[/C][C]0.462093[/C][/ROW]
[ROW][C]43[/C][C]-0.092919[/C][C]-0.7884[/C][C]0.216512[/C][/ROW]
[ROW][C]44[/C][C]0.00245[/C][C]0.0208[/C][C]0.491737[/C][/ROW]
[ROW][C]45[/C][C]-0.026773[/C][C]-0.2272[/C][C]0.410464[/C][/ROW]
[ROW][C]46[/C][C]-0.002619[/C][C]-0.0222[/C][C]0.491164[/C][/ROW]
[ROW][C]47[/C][C]-0.099759[/C][C]-0.8465[/C][C]0.200043[/C][/ROW]
[ROW][C]48[/C][C]0.000399[/C][C]0.0034[/C][C]0.498653[/C][/ROW]
[/TABLE]
Source: https://freestatistics.org/blog/index.php?pk=204987&T=2

Globally Unique Identifier (entire table): ba.freestatistics.org/blog/index.php?pk=204987&T=2

As an alternative you can also use a QR Code:  

The GUIDs for individual cells are displayed in the table below:

Partial Autocorrelation Function
Time lag kPACF(k)T-STATP-value
10.7339926.22810
2-0.483698-4.10435.3e-05
30.0760260.64510.260456
40.0684390.58070.28162
50.0314620.2670.39513
6-0.08768-0.7440.229651
7-0.225753-1.91560.029695
80.0721430.61220.271183
90.0880940.74750.228598
100.2532062.14850.017518
110.28732.43780.008623
12-0.012523-0.10630.457836
13-0.646447-5.48530
140.2236241.89750.030885
15-0.07283-0.6180.269269
16-0.208691-1.77080.040413
17-0.078499-0.66610.253742
18-0.092326-0.78340.217977
190.0326350.27690.391317
20-0.114703-0.97330.166834
210.0040880.03470.486211
22-0.081946-0.69530.244542
23-0.043531-0.36940.356466
24-0.008668-0.07350.470787
25-0.002473-0.0210.491658
26-0.031923-0.27090.39363
27-0.090152-0.7650.223395
280.0703360.59680.27625
29-0.061674-0.52330.301178
300.0175450.14890.441034
31-0.007945-0.06740.47322
320.0675960.57360.284022
33-0.015963-0.13550.446316
340.0015220.01290.494867
350.0034110.02890.488496
360.0465450.3950.347023
37-0.006446-0.05470.478266
38-0.060732-0.51530.303952
39-0.016629-0.14110.444093
40-0.054099-0.4590.323791
410.0058430.04960.480298
42-0.011254-0.09550.462093
43-0.092919-0.78840.216512
440.002450.02080.491737
45-0.026773-0.22720.410464
46-0.002619-0.02220.491164
47-0.099759-0.84650.200043
480.0003990.00340.498653


Parameters (Session):
par1 = 48 ; par2 = 1 ; par3 = 0 ; par4 = 0 ; par5 = 12 ; par6 = White Noise ; par7 = 0.95 ;
Parameters (R input):
par1 = 48 ; par2 = 1 ; par3 = 0 ; par4 = 0 ; par5 = 12 ; par6 = White Noise ; par7 = 0.95 ; par8 = ;
R code (references can be found in the software module):
if (par1 == 'Default') {
par1 = 10*log10(length(x))
} else {
par1 <- as.numeric(par1)
}
par2 <- as.numeric(par2)
par3 <- as.numeric(par3)
par4 <- as.numeric(par4)
par5 <- as.numeric(par5)
if (par6 == 'White Noise') par6 <- 'white' else par6 <- 'ma'
par7 <- as.numeric(par7)
if (par8 != '') par8 <- as.numeric(par8)
ox <- x
if (par8 == '') {
if (par2 == 0) {
x <- log(x)
} else {
x <- (x ^ par2 - 1) / par2
}
} else {
x <- log(x,base=par8)
}
if (par3 > 0) x <- diff(x,lag=1,difference=par3)
if (par4 > 0) x <- diff(x,lag=par5,difference=par4)
bitmap(file='picts.png')
op <- par(mfrow=c(2,1))
plot(ox,type='l',main='Original Time Series',xlab='time',ylab='value')
if (par8=='') {
mytitle <- paste('Working Time Series (lambda=',par2,', d=',par3,', D=',par4,')',sep='')
mysub <- paste('(lambda=',par2,', d=',par3,', D=',par4,', CI=', par7, ', CI type=',par6,')',sep='')
} else {
mytitle <- paste('Working Time Series (base=',par8,', d=',par3,', D=',par4,')',sep='')
mysub <- paste('(base=',par8,', d=',par3,', D=',par4,', CI=', par7, ', CI type=',par6,')',sep='')
}
plot(x,type='l', main=mytitle,xlab='time',ylab='value')
par(op)
dev.off()
bitmap(file='pic1.png')
racf <- acf(x, par1, main='Autocorrelation', xlab='time lag', ylab='ACF', ci.type=par6, ci=par7, sub=mysub)
dev.off()
bitmap(file='pic2.png')
rpacf <- pacf(x,par1,main='Partial Autocorrelation',xlab='lags',ylab='PACF',sub=mysub)
dev.off()
(myacf <- c(racf$acf))
(mypacf <- c(rpacf$acf))
lengthx <- length(x)
sqrtn <- sqrt(lengthx)
load(file='createtable')
a<-table.start()
a<-table.row.start(a)
a<-table.element(a,'Autocorrelation Function',4,TRUE)
a<-table.row.end(a)
a<-table.row.start(a)
a<-table.element(a,'Time lag k',header=TRUE)
a<-table.element(a,hyperlink('basics.htm','ACF(k)','click here for more information about the Autocorrelation Function'),header=TRUE)
a<-table.element(a,'T-STAT',header=TRUE)
a<-table.element(a,'P-value',header=TRUE)
a<-table.row.end(a)
for (i in 2:(par1+1)) {
a<-table.row.start(a)
a<-table.element(a,i-1,header=TRUE)
a<-table.element(a,round(myacf[i],6))
mytstat <- myacf[i]*sqrtn
a<-table.element(a,round(mytstat,4))
a<-table.element(a,round(1-pt(abs(mytstat),lengthx),6))
a<-table.row.end(a)
}
a<-table.end(a)
table.save(a,file='mytable.tab')
a<-table.start()
a<-table.row.start(a)
a<-table.element(a,'Partial Autocorrelation Function',4,TRUE)
a<-table.row.end(a)
a<-table.row.start(a)
a<-table.element(a,'Time lag k',header=TRUE)
a<-table.element(a,hyperlink('basics.htm','PACF(k)','click here for more information about the Partial Autocorrelation Function'),header=TRUE)
a<-table.element(a,'T-STAT',header=TRUE)
a<-table.element(a,'P-value',header=TRUE)
a<-table.row.end(a)
for (i in 1:par1) {
a<-table.row.start(a)
a<-table.element(a,i,header=TRUE)
a<-table.element(a,round(mypacf[i],6))
mytstat <- mypacf[i]*sqrtn
a<-table.element(a,round(mytstat,4))
a<-table.element(a,round(1-pt(abs(mytstat),lengthx),6))
a<-table.row.end(a)
}
a<-table.end(a)
table.save(a,file='mytable1.tab')