Free Statistics

of Irreproducible Research!

Author's title

Author*Unverified author*
R Software Modulerwasp_histogram.wasp
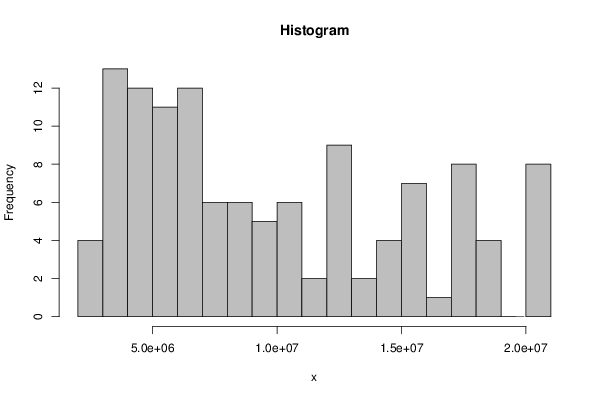
Title produced by softwareHistogram
Date of computationThu, 18 Jul 2013 09:10:22 -0400
Cite this page as followsStatistical Computations at FreeStatistics.org, Office for Research Development and Education, URL https://freestatistics.org/blog/index.php?v=date/2013/Jul/18/t1374153103kz4mqcsilayr0ji.htm/, Retrieved Tue, 30 Apr 2024 01:06:05 +0000
Statistical Computations at FreeStatistics.org, Office for Research Development and Education, URL https://freestatistics.org/blog/index.php?pk=210797, Retrieved Tue, 30 Apr 2024 01:06:05 +0000
QR Codes:

Original text written by user:
IsPrivate?No (this computation is public)
User-defined keywordskofi asare kevin
Estimated Impact205
Family? (F = Feedback message, R = changed R code, M = changed R Module, P = changed Parameters, D = changed Data)
-       [Histogram] [Tijdreeks 1 - Stap 5] [2013-07-18 13:10:22] [4d26c4233714d8e4ecf99606d744931b] [Current]
- R       [Histogram] [] [2013-08-14 06:01:24] [b6e284768173daa602d243042729bd3c]
Feedback Forum

Post a new message
Dataseries X:
3207324
3178086
3148485
3087246
3693267
3661164
3207324
2905563
2934699
2934699
2967168
3025542
3207324
3148485
3239325
3388641
4238049
4238049
4056732
3874950
4024266
4205949
4238049
4328892
4601499
4419732
4419732
4692342
5448042
5509281
5357202
4993734
5266260
5266260
5295495
5448042
5568120
5629359
5629359
5811042
6508356
6689670
6718809
6264966
6508356
6417513
6235746
6628434
6718809
6566727
6598830
6809748
7597920
7990056
7990056
7808739
8080980
7808739
7656276
8233527
8323902
8110134
8654901
8868684
9504309
9926133
9867774
9835290
10078677
10049076
9686076
10230759
10412541
10230759
10986462
11349927
12196086
12529950
12439476
12257691
12409872
12591555
11985168
12468612
12773337
12650394
13438098
13710240
14861511
15072414
14800254
14952351
15043194
15134034
14556783
15101568
15403311
15101568
15980562
16252821
17433111
17614893
17673267
17977893
17977893
18097971
17553189
17825814
18007131
17673267
18642738
18824436
20034063
20247849
20549592
20822217
20851353
20883456
20338689
20883456


Summary of computational transaction
Raw Inputview raw input (R code)
Raw Outputview raw output of R engine
Computing time2 seconds
R Server'Sir Maurice George Kendall' @ kendall.wessa.net

\begin{tabular}{lllllllll}
\hline
Summary of computational transaction \tabularnewline
Raw Input & view raw input (R code)  \tabularnewline
Raw Output & view raw output of R engine  \tabularnewline
Computing time & 2 seconds \tabularnewline
R Server & 'Sir Maurice George Kendall' @ kendall.wessa.net \tabularnewline
\hline
\end{tabular}
%Source: https://freestatistics.org/blog/index.php?pk=210797&T=0

[TABLE]
[ROW][C]Summary of computational transaction[/C][/ROW]
[ROW][C]Raw Input[/C][C]view raw input (R code) [/C][/ROW]
[ROW][C]Raw Output[/C][C]view raw output of R engine [/C][/ROW]
[ROW][C]Computing time[/C][C]2 seconds[/C][/ROW]
[ROW][C]R Server[/C][C]'Sir Maurice George Kendall' @ kendall.wessa.net[/C][/ROW]
[/TABLE]
Source: https://freestatistics.org/blog/index.php?pk=210797&T=0

Globally Unique Identifier (entire table): ba.freestatistics.org/blog/index.php?pk=210797&T=0

As an alternative you can also use a QR Code:  

The GUIDs for individual cells are displayed in the table below:

Summary of computational transaction
Raw Inputview raw input (R code)
Raw Outputview raw output of R engine
Computing time2 seconds
R Server'Sir Maurice George Kendall' @ kendall.wessa.net


Frequency Table (Histogram)
BinsMidpointAbs. FrequencyRel. FrequencyCumul. Rel. Freq.Density
[2e+06,3e+06[250000040.0333330.0333330
[3e+06,4e+06[3500000130.1083330.1416670
[4e+06,5e+06[4500000120.10.2416670
[5e+06,6e+06[5500000110.0916670.3333330
[6e+06,7e+06[6500000120.10.4333330
[7e+06,8e+06[750000060.050.4833330
[8e+06,9e+06[850000060.050.5333330
[9e+06,1e+07[950000050.0416670.5750
[1e+07,1.1e+07[1050000060.050.6250
[1.1e+07,1.2e+07[1150000020.0166670.6416670
[1.2e+07,1.3e+07[1250000090.0750.7166670
[1.3e+07,1.4e+07[1350000020.0166670.7333330
[1.4e+07,1.5e+07[1450000040.0333330.7666670
[1.5e+07,1.6e+07[1550000070.0583330.8250
[1.6e+07,1.7e+07[1650000010.0083330.8333330
[1.7e+07,1.8e+07[1750000080.0666670.90
[1.8e+07,1.9e+07[1850000040.0333330.9333330
[1.9e+07,2e+07[19500000000.9333330
[2e+07,2.1e+07]2050000080.06666710

\begin{tabular}{lllllllll}
\hline
Frequency Table (Histogram) \tabularnewline
Bins & Midpoint & Abs. Frequency & Rel. Frequency & Cumul. Rel. Freq. & Density \tabularnewline
[2e+06,3e+06[ & 2500000 & 4 & 0.033333 & 0.033333 & 0 \tabularnewline
[3e+06,4e+06[ & 3500000 & 13 & 0.108333 & 0.141667 & 0 \tabularnewline
[4e+06,5e+06[ & 4500000 & 12 & 0.1 & 0.241667 & 0 \tabularnewline
[5e+06,6e+06[ & 5500000 & 11 & 0.091667 & 0.333333 & 0 \tabularnewline
[6e+06,7e+06[ & 6500000 & 12 & 0.1 & 0.433333 & 0 \tabularnewline
[7e+06,8e+06[ & 7500000 & 6 & 0.05 & 0.483333 & 0 \tabularnewline
[8e+06,9e+06[ & 8500000 & 6 & 0.05 & 0.533333 & 0 \tabularnewline
[9e+06,1e+07[ & 9500000 & 5 & 0.041667 & 0.575 & 0 \tabularnewline
[1e+07,1.1e+07[ & 10500000 & 6 & 0.05 & 0.625 & 0 \tabularnewline
[1.1e+07,1.2e+07[ & 11500000 & 2 & 0.016667 & 0.641667 & 0 \tabularnewline
[1.2e+07,1.3e+07[ & 12500000 & 9 & 0.075 & 0.716667 & 0 \tabularnewline
[1.3e+07,1.4e+07[ & 13500000 & 2 & 0.016667 & 0.733333 & 0 \tabularnewline
[1.4e+07,1.5e+07[ & 14500000 & 4 & 0.033333 & 0.766667 & 0 \tabularnewline
[1.5e+07,1.6e+07[ & 15500000 & 7 & 0.058333 & 0.825 & 0 \tabularnewline
[1.6e+07,1.7e+07[ & 16500000 & 1 & 0.008333 & 0.833333 & 0 \tabularnewline
[1.7e+07,1.8e+07[ & 17500000 & 8 & 0.066667 & 0.9 & 0 \tabularnewline
[1.8e+07,1.9e+07[ & 18500000 & 4 & 0.033333 & 0.933333 & 0 \tabularnewline
[1.9e+07,2e+07[ & 19500000 & 0 & 0 & 0.933333 & 0 \tabularnewline
[2e+07,2.1e+07] & 20500000 & 8 & 0.066667 & 1 & 0 \tabularnewline
\hline
\end{tabular}
%Source: https://freestatistics.org/blog/index.php?pk=210797&T=1

[TABLE]
[ROW][C]Frequency Table (Histogram)[/C][/ROW]
[ROW][C]Bins[/C][C]Midpoint[/C][C]Abs. Frequency[/C][C]Rel. Frequency[/C][C]Cumul. Rel. Freq.[/C][C]Density[/C][/ROW]
[ROW][C][2e+06,3e+06[[/C][C]2500000[/C][C]4[/C][C]0.033333[/C][C]0.033333[/C][C]0[/C][/ROW]
[ROW][C][3e+06,4e+06[[/C][C]3500000[/C][C]13[/C][C]0.108333[/C][C]0.141667[/C][C]0[/C][/ROW]
[ROW][C][4e+06,5e+06[[/C][C]4500000[/C][C]12[/C][C]0.1[/C][C]0.241667[/C][C]0[/C][/ROW]
[ROW][C][5e+06,6e+06[[/C][C]5500000[/C][C]11[/C][C]0.091667[/C][C]0.333333[/C][C]0[/C][/ROW]
[ROW][C][6e+06,7e+06[[/C][C]6500000[/C][C]12[/C][C]0.1[/C][C]0.433333[/C][C]0[/C][/ROW]
[ROW][C][7e+06,8e+06[[/C][C]7500000[/C][C]6[/C][C]0.05[/C][C]0.483333[/C][C]0[/C][/ROW]
[ROW][C][8e+06,9e+06[[/C][C]8500000[/C][C]6[/C][C]0.05[/C][C]0.533333[/C][C]0[/C][/ROW]
[ROW][C][9e+06,1e+07[[/C][C]9500000[/C][C]5[/C][C]0.041667[/C][C]0.575[/C][C]0[/C][/ROW]
[ROW][C][1e+07,1.1e+07[[/C][C]10500000[/C][C]6[/C][C]0.05[/C][C]0.625[/C][C]0[/C][/ROW]
[ROW][C][1.1e+07,1.2e+07[[/C][C]11500000[/C][C]2[/C][C]0.016667[/C][C]0.641667[/C][C]0[/C][/ROW]
[ROW][C][1.2e+07,1.3e+07[[/C][C]12500000[/C][C]9[/C][C]0.075[/C][C]0.716667[/C][C]0[/C][/ROW]
[ROW][C][1.3e+07,1.4e+07[[/C][C]13500000[/C][C]2[/C][C]0.016667[/C][C]0.733333[/C][C]0[/C][/ROW]
[ROW][C][1.4e+07,1.5e+07[[/C][C]14500000[/C][C]4[/C][C]0.033333[/C][C]0.766667[/C][C]0[/C][/ROW]
[ROW][C][1.5e+07,1.6e+07[[/C][C]15500000[/C][C]7[/C][C]0.058333[/C][C]0.825[/C][C]0[/C][/ROW]
[ROW][C][1.6e+07,1.7e+07[[/C][C]16500000[/C][C]1[/C][C]0.008333[/C][C]0.833333[/C][C]0[/C][/ROW]
[ROW][C][1.7e+07,1.8e+07[[/C][C]17500000[/C][C]8[/C][C]0.066667[/C][C]0.9[/C][C]0[/C][/ROW]
[ROW][C][1.8e+07,1.9e+07[[/C][C]18500000[/C][C]4[/C][C]0.033333[/C][C]0.933333[/C][C]0[/C][/ROW]
[ROW][C][1.9e+07,2e+07[[/C][C]19500000[/C][C]0[/C][C]0[/C][C]0.933333[/C][C]0[/C][/ROW]
[ROW][C][2e+07,2.1e+07][/C][C]20500000[/C][C]8[/C][C]0.066667[/C][C]1[/C][C]0[/C][/ROW]
[/TABLE]
Source: https://freestatistics.org/blog/index.php?pk=210797&T=1

Globally Unique Identifier (entire table): ba.freestatistics.org/blog/index.php?pk=210797&T=1

As an alternative you can also use a QR Code:  

The GUIDs for individual cells are displayed in the table below:

Frequency Table (Histogram)
BinsMidpointAbs. FrequencyRel. FrequencyCumul. Rel. Freq.Density
[2e+06,3e+06[250000040.0333330.0333330
[3e+06,4e+06[3500000130.1083330.1416670
[4e+06,5e+06[4500000120.10.2416670
[5e+06,6e+06[5500000110.0916670.3333330
[6e+06,7e+06[6500000120.10.4333330
[7e+06,8e+06[750000060.050.4833330
[8e+06,9e+06[850000060.050.5333330
[9e+06,1e+07[950000050.0416670.5750
[1e+07,1.1e+07[1050000060.050.6250
[1.1e+07,1.2e+07[1150000020.0166670.6416670
[1.2e+07,1.3e+07[1250000090.0750.7166670
[1.3e+07,1.4e+07[1350000020.0166670.7333330
[1.4e+07,1.5e+07[1450000040.0333330.7666670
[1.5e+07,1.6e+07[1550000070.0583330.8250
[1.6e+07,1.7e+07[1650000010.0083330.8333330
[1.7e+07,1.8e+07[1750000080.0666670.90
[1.8e+07,1.9e+07[1850000040.0333330.9333330
[1.9e+07,2e+07[19500000000.9333330
[2e+07,2.1e+07]2050000080.06666710


Parameters (Session):
par1 = 24 ; par2 = grey ; par3 = FALSE ; par4 = Unknown ;
Parameters (R input):
par1 = 24 ; par2 = grey ; par3 = FALSE ; par4 = Unknown ;
R code (references can be found in the software module):
par4 <- 'Unknown'
par3 <- 'FALSE'
par2 <- 'grey'
par1 <- '12'
par1 <- as.numeric(par1)
if (par3 == 'TRUE') par3 <- TRUE
if (par3 == 'FALSE') par3 <- FALSE
if (par4 == 'Unknown') par1 <- as.numeric(par1)
if (par4 == 'Interval/Ratio') par1 <- as.numeric(par1)
if (par4 == '3-point Likert') par1 <- c(1:3 - 0.5, 3.5)
if (par4 == '4-point Likert') par1 <- c(1:4 - 0.5, 4.5)
if (par4 == '5-point Likert') par1 <- c(1:5 - 0.5, 5.5)
if (par4 == '6-point Likert') par1 <- c(1:6 - 0.5, 6.5)
if (par4 == '7-point Likert') par1 <- c(1:7 - 0.5, 7.5)
if (par4 == '8-point Likert') par1 <- c(1:8 - 0.5, 8.5)
if (par4 == '9-point Likert') par1 <- c(1:9 - 0.5, 9.5)
if (par4 == '10-point Likert') par1 <- c(1:10 - 0.5, 10.5)
bitmap(file='test1.png')
if(is.numeric(x[1])) {
if (is.na(par1)) {
myhist<-hist(x,col=par2,main=main,xlab=xlab,right=par3)
} else {
if (par1 < 0) par1 <- 3
if (par1 > 50) par1 <- 50
myhist<-hist(x,breaks=par1,col=par2,main=main,xlab=xlab,right=par3)
}
} else {
plot(mytab <- table(x),col=par2,main='Frequency Plot',xlab=xlab,ylab='Absolute Frequency')
}
dev.off()
if(is.numeric(x[1])) {
myhist
n <- length(x)
load(file='createtable')
a<-table.start()
a<-table.row.start(a)
a<-table.element(a,hyperlink('histogram.htm','Frequency Table (Histogram)',''),6,TRUE)
a<-table.row.end(a)
a<-table.row.start(a)
a<-table.element(a,'Bins',header=TRUE)
a<-table.element(a,'Midpoint',header=TRUE)
a<-table.element(a,'Abs. Frequency',header=TRUE)
a<-table.element(a,'Rel. Frequency',header=TRUE)
a<-table.element(a,'Cumul. Rel. Freq.',header=TRUE)
a<-table.element(a,'Density',header=TRUE)
a<-table.row.end(a)
crf <- 0
if (par3 == FALSE) mybracket <- '[' else mybracket <- ']'
mynumrows <- (length(myhist$breaks)-1)
for (i in 1:mynumrows) {
a<-table.row.start(a)
if (i == 1)
dum <- paste('[',myhist$breaks[i],sep='')
else
dum <- paste(mybracket,myhist$breaks[i],sep='')
dum <- paste(dum,myhist$breaks[i+1],sep=',')
if (i==mynumrows)
dum <- paste(dum,']',sep='')
else
dum <- paste(dum,mybracket,sep='')
a<-table.element(a,dum,header=TRUE)
a<-table.element(a,myhist$mids[i])
a<-table.element(a,myhist$counts[i])
rf <- myhist$counts[i]/n
crf <- crf + rf
a<-table.element(a,round(rf,6))
a<-table.element(a,round(crf,6))
a<-table.element(a,round(myhist$density[i],6))
a<-table.row.end(a)
}
a<-table.end(a)
table.save(a,file='mytable.tab')
} else {
mytab
reltab <- mytab / sum(mytab)
n <- length(mytab)
load(file='createtable')
a<-table.start()
a<-table.row.start(a)
a<-table.element(a,'Frequency Table (Categorical Data)',3,TRUE)
a<-table.row.end(a)
a<-table.row.start(a)
a<-table.element(a,'Category',header=TRUE)
a<-table.element(a,'Abs. Frequency',header=TRUE)
a<-table.element(a,'Rel. Frequency',header=TRUE)
a<-table.row.end(a)
for (i in 1:n) {
a<-table.row.start(a)
a<-table.element(a,labels(mytab)$x[i],header=TRUE)
a<-table.element(a,mytab[i])
a<-table.element(a,round(reltab[i],4))
a<-table.row.end(a)
}
a<-table.end(a)
table.save(a,file='mytable1.tab')
}