Free Statistics

of Irreproducible Research!

Author's title

Author*Unverified author*
R Software Modulerwasp_autocorrelation.wasp
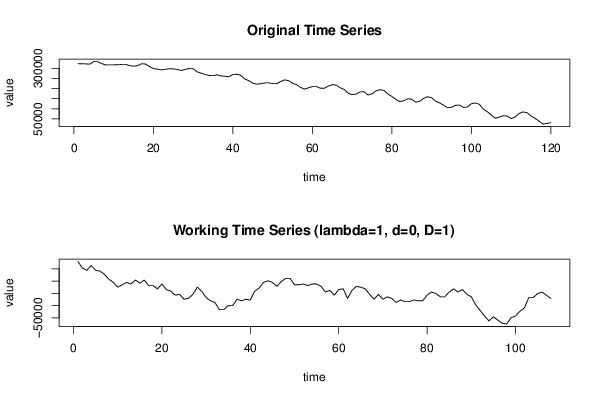
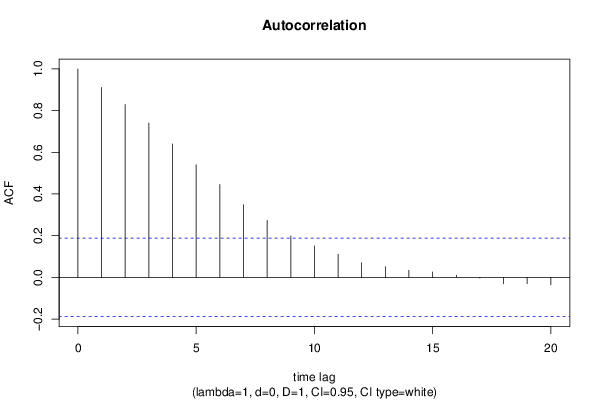
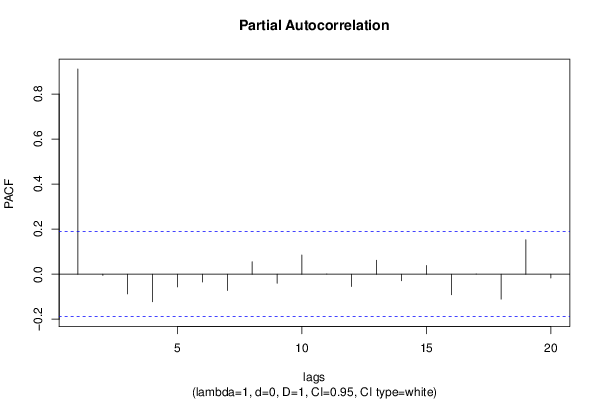
Title produced by software(Partial) Autocorrelation Function
Date of computationFri, 26 Jul 2013 05:29:50 -0400
Cite this page as followsStatistical Computations at FreeStatistics.org, Office for Research Development and Education, URL https://freestatistics.org/blog/index.php?v=date/2013/Jul/26/t13748310075jcfxsdxr4jadvt.htm/, Retrieved Mon, 29 Apr 2024 03:42:19 +0000
Statistical Computations at FreeStatistics.org, Office for Research Development and Education, URL https://freestatistics.org/blog/index.php?pk=210826, Retrieved Mon, 29 Apr 2024 03:42:19 +0000
QR Codes:

Original text written by user:
IsPrivate?No (this computation is public)
User-defined keywordsAlexandra De Schutter
Estimated Impact149
Family? (F = Feedback message, R = changed R code, M = changed R Module, P = changed Parameters, D = changed Data)
-       [(Partial) Autocorrelation Function] [omzet Oregon Scie...] [2013-07-26 09:29:50] [a5e81fc5b84eaf53b9dc73271fe36a59] [Current]
Feedback Forum

Post a new message
Dataseries X:
323898
323268
322574
321304
334352
333712
323898
317374
318014
318014
318646
319980
319980
314086
311490
314086
323268
321934
309526
299020
297054
293126
295784
299020
297748
295090
289900
295090
299712
298380
283312
276788
270264
265010
264380
268300
263046
261082
259118
270264
271536
265010
247340
239490
227082
221820
224416
228344
228344
225118
224416
234930
243420
239490
226380
219864
206122
197634
204158
210682
210682
202194
201562
212638
219864
217260
204158
195670
177304
170150
172744
183892
184522
168184
174078
188452
194976
191046
173384
160968
146594
135448
140008
149820
147226
132852
137412
151786
159642
155082
137412
129564
117786
105368
107332
117146
118416
106638
108604
125004
128924
122346
98150
85742
69342
53004
58258
65412
64150
51670
58888
76560
84408
80488
64782
52372
39262
24186
26854
31414


Summary of computational transaction
Raw Inputview raw input (R code)
Raw Outputview raw output of R engine
Computing time4 seconds
R Server'Gertrude Mary Cox' @ cox.wessa.net

\begin{tabular}{lllllllll}
\hline
Summary of computational transaction \tabularnewline
Raw Input & view raw input (R code)  \tabularnewline
Raw Output & view raw output of R engine  \tabularnewline
Computing time & 4 seconds \tabularnewline
R Server & 'Gertrude Mary Cox' @ cox.wessa.net \tabularnewline
\hline
\end{tabular}
%Source: https://freestatistics.org/blog/index.php?pk=210826&T=0

[TABLE]
[ROW][C]Summary of computational transaction[/C][/ROW]
[ROW][C]Raw Input[/C][C]view raw input (R code) [/C][/ROW]
[ROW][C]Raw Output[/C][C]view raw output of R engine [/C][/ROW]
[ROW][C]Computing time[/C][C]4 seconds[/C][/ROW]
[ROW][C]R Server[/C][C]'Gertrude Mary Cox' @ cox.wessa.net[/C][/ROW]
[/TABLE]
Source: https://freestatistics.org/blog/index.php?pk=210826&T=0

Globally Unique Identifier (entire table): ba.freestatistics.org/blog/index.php?pk=210826&T=0

As an alternative you can also use a QR Code:  

The GUIDs for individual cells are displayed in the table below:

Summary of computational transaction
Raw Inputview raw input (R code)
Raw Outputview raw output of R engine
Computing time4 seconds
R Server'Gertrude Mary Cox' @ cox.wessa.net


Autocorrelation Function
Time lag kACF(k)T-STATP-value
10.9113149.47060
20.8295718.62120
30.7403327.69380
40.6397036.6480
50.5406225.61830
60.4454924.62975e-06
70.3483063.61970.000225
80.2726422.83340.002749
90.1988922.06690.020565
100.1503971.5630.060492
110.1106111.14950.126444
120.0707080.73480.23202
130.0515610.53580.296588
140.0336520.34970.363615
150.0259830.270.393829
160.0101090.10510.458265
17-0.003245-0.03370.486579
18-0.031128-0.32350.373476
19-0.030046-0.31220.377727
20-0.035636-0.37030.355925

\begin{tabular}{lllllllll}
\hline
Autocorrelation Function \tabularnewline
Time lag k & ACF(k) & T-STAT & P-value \tabularnewline
1 & 0.911314 & 9.4706 & 0 \tabularnewline
2 & 0.829571 & 8.6212 & 0 \tabularnewline
3 & 0.740332 & 7.6938 & 0 \tabularnewline
4 & 0.639703 & 6.648 & 0 \tabularnewline
5 & 0.540622 & 5.6183 & 0 \tabularnewline
6 & 0.445492 & 4.6297 & 5e-06 \tabularnewline
7 & 0.348306 & 3.6197 & 0.000225 \tabularnewline
8 & 0.272642 & 2.8334 & 0.002749 \tabularnewline
9 & 0.198892 & 2.0669 & 0.020565 \tabularnewline
10 & 0.150397 & 1.563 & 0.060492 \tabularnewline
11 & 0.110611 & 1.1495 & 0.126444 \tabularnewline
12 & 0.070708 & 0.7348 & 0.23202 \tabularnewline
13 & 0.051561 & 0.5358 & 0.296588 \tabularnewline
14 & 0.033652 & 0.3497 & 0.363615 \tabularnewline
15 & 0.025983 & 0.27 & 0.393829 \tabularnewline
16 & 0.010109 & 0.1051 & 0.458265 \tabularnewline
17 & -0.003245 & -0.0337 & 0.486579 \tabularnewline
18 & -0.031128 & -0.3235 & 0.373476 \tabularnewline
19 & -0.030046 & -0.3122 & 0.377727 \tabularnewline
20 & -0.035636 & -0.3703 & 0.355925 \tabularnewline
\hline
\end{tabular}
%Source: https://freestatistics.org/blog/index.php?pk=210826&T=1

[TABLE]
[ROW][C]Autocorrelation Function[/C][/ROW]
[ROW][C]Time lag k[/C][C]ACF(k)[/C][C]T-STAT[/C][C]P-value[/C][/ROW]
[ROW][C]1[/C][C]0.911314[/C][C]9.4706[/C][C]0[/C][/ROW]
[ROW][C]2[/C][C]0.829571[/C][C]8.6212[/C][C]0[/C][/ROW]
[ROW][C]3[/C][C]0.740332[/C][C]7.6938[/C][C]0[/C][/ROW]
[ROW][C]4[/C][C]0.639703[/C][C]6.648[/C][C]0[/C][/ROW]
[ROW][C]5[/C][C]0.540622[/C][C]5.6183[/C][C]0[/C][/ROW]
[ROW][C]6[/C][C]0.445492[/C][C]4.6297[/C][C]5e-06[/C][/ROW]
[ROW][C]7[/C][C]0.348306[/C][C]3.6197[/C][C]0.000225[/C][/ROW]
[ROW][C]8[/C][C]0.272642[/C][C]2.8334[/C][C]0.002749[/C][/ROW]
[ROW][C]9[/C][C]0.198892[/C][C]2.0669[/C][C]0.020565[/C][/ROW]
[ROW][C]10[/C][C]0.150397[/C][C]1.563[/C][C]0.060492[/C][/ROW]
[ROW][C]11[/C][C]0.110611[/C][C]1.1495[/C][C]0.126444[/C][/ROW]
[ROW][C]12[/C][C]0.070708[/C][C]0.7348[/C][C]0.23202[/C][/ROW]
[ROW][C]13[/C][C]0.051561[/C][C]0.5358[/C][C]0.296588[/C][/ROW]
[ROW][C]14[/C][C]0.033652[/C][C]0.3497[/C][C]0.363615[/C][/ROW]
[ROW][C]15[/C][C]0.025983[/C][C]0.27[/C][C]0.393829[/C][/ROW]
[ROW][C]16[/C][C]0.010109[/C][C]0.1051[/C][C]0.458265[/C][/ROW]
[ROW][C]17[/C][C]-0.003245[/C][C]-0.0337[/C][C]0.486579[/C][/ROW]
[ROW][C]18[/C][C]-0.031128[/C][C]-0.3235[/C][C]0.373476[/C][/ROW]
[ROW][C]19[/C][C]-0.030046[/C][C]-0.3122[/C][C]0.377727[/C][/ROW]
[ROW][C]20[/C][C]-0.035636[/C][C]-0.3703[/C][C]0.355925[/C][/ROW]
[/TABLE]
Source: https://freestatistics.org/blog/index.php?pk=210826&T=1

Globally Unique Identifier (entire table): ba.freestatistics.org/blog/index.php?pk=210826&T=1

As an alternative you can also use a QR Code:  

The GUIDs for individual cells are displayed in the table below:

Autocorrelation Function
Time lag kACF(k)T-STATP-value
10.9113149.47060
20.8295718.62120
30.7403327.69380
40.6397036.6480
50.5406225.61830
60.4454924.62975e-06
70.3483063.61970.000225
80.2726422.83340.002749
90.1988922.06690.020565
100.1503971.5630.060492
110.1106111.14950.126444
120.0707080.73480.23202
130.0515610.53580.296588
140.0336520.34970.363615
150.0259830.270.393829
160.0101090.10510.458265
17-0.003245-0.03370.486579
18-0.031128-0.32350.373476
19-0.030046-0.31220.377727
20-0.035636-0.37030.355925


Partial Autocorrelation Function
Time lag kPACF(k)T-STATP-value
10.9113149.47060
2-0.005435-0.05650.477532
3-0.087452-0.90880.182733
4-0.122201-1.26990.103416
5-0.056489-0.5870.279198
6-0.034963-0.36330.35853
7-0.072257-0.75090.227166
80.0553550.57530.283155
9-0.040535-0.42130.337205
100.0848550.88180.18991
11-7.6e-05-8e-040.499684
12-0.054381-0.56510.286574
130.061610.64030.261678
14-0.028939-0.30070.382094
150.0387450.40270.344001
16-0.091653-0.95250.171489
17-0.000303-0.00310.498747
18-0.110987-1.15340.125643
190.1533011.59310.057025
20-0.016859-0.17520.430624

\begin{tabular}{lllllllll}
\hline
Partial Autocorrelation Function \tabularnewline
Time lag k & PACF(k) & T-STAT & P-value \tabularnewline
1 & 0.911314 & 9.4706 & 0 \tabularnewline
2 & -0.005435 & -0.0565 & 0.477532 \tabularnewline
3 & -0.087452 & -0.9088 & 0.182733 \tabularnewline
4 & -0.122201 & -1.2699 & 0.103416 \tabularnewline
5 & -0.056489 & -0.587 & 0.279198 \tabularnewline
6 & -0.034963 & -0.3633 & 0.35853 \tabularnewline
7 & -0.072257 & -0.7509 & 0.227166 \tabularnewline
8 & 0.055355 & 0.5753 & 0.283155 \tabularnewline
9 & -0.040535 & -0.4213 & 0.337205 \tabularnewline
10 & 0.084855 & 0.8818 & 0.18991 \tabularnewline
11 & -7.6e-05 & -8e-04 & 0.499684 \tabularnewline
12 & -0.054381 & -0.5651 & 0.286574 \tabularnewline
13 & 0.06161 & 0.6403 & 0.261678 \tabularnewline
14 & -0.028939 & -0.3007 & 0.382094 \tabularnewline
15 & 0.038745 & 0.4027 & 0.344001 \tabularnewline
16 & -0.091653 & -0.9525 & 0.171489 \tabularnewline
17 & -0.000303 & -0.0031 & 0.498747 \tabularnewline
18 & -0.110987 & -1.1534 & 0.125643 \tabularnewline
19 & 0.153301 & 1.5931 & 0.057025 \tabularnewline
20 & -0.016859 & -0.1752 & 0.430624 \tabularnewline
\hline
\end{tabular}
%Source: https://freestatistics.org/blog/index.php?pk=210826&T=2

[TABLE]
[ROW][C]Partial Autocorrelation Function[/C][/ROW]
[ROW][C]Time lag k[/C][C]PACF(k)[/C][C]T-STAT[/C][C]P-value[/C][/ROW]
[ROW][C]1[/C][C]0.911314[/C][C]9.4706[/C][C]0[/C][/ROW]
[ROW][C]2[/C][C]-0.005435[/C][C]-0.0565[/C][C]0.477532[/C][/ROW]
[ROW][C]3[/C][C]-0.087452[/C][C]-0.9088[/C][C]0.182733[/C][/ROW]
[ROW][C]4[/C][C]-0.122201[/C][C]-1.2699[/C][C]0.103416[/C][/ROW]
[ROW][C]5[/C][C]-0.056489[/C][C]-0.587[/C][C]0.279198[/C][/ROW]
[ROW][C]6[/C][C]-0.034963[/C][C]-0.3633[/C][C]0.35853[/C][/ROW]
[ROW][C]7[/C][C]-0.072257[/C][C]-0.7509[/C][C]0.227166[/C][/ROW]
[ROW][C]8[/C][C]0.055355[/C][C]0.5753[/C][C]0.283155[/C][/ROW]
[ROW][C]9[/C][C]-0.040535[/C][C]-0.4213[/C][C]0.337205[/C][/ROW]
[ROW][C]10[/C][C]0.084855[/C][C]0.8818[/C][C]0.18991[/C][/ROW]
[ROW][C]11[/C][C]-7.6e-05[/C][C]-8e-04[/C][C]0.499684[/C][/ROW]
[ROW][C]12[/C][C]-0.054381[/C][C]-0.5651[/C][C]0.286574[/C][/ROW]
[ROW][C]13[/C][C]0.06161[/C][C]0.6403[/C][C]0.261678[/C][/ROW]
[ROW][C]14[/C][C]-0.028939[/C][C]-0.3007[/C][C]0.382094[/C][/ROW]
[ROW][C]15[/C][C]0.038745[/C][C]0.4027[/C][C]0.344001[/C][/ROW]
[ROW][C]16[/C][C]-0.091653[/C][C]-0.9525[/C][C]0.171489[/C][/ROW]
[ROW][C]17[/C][C]-0.000303[/C][C]-0.0031[/C][C]0.498747[/C][/ROW]
[ROW][C]18[/C][C]-0.110987[/C][C]-1.1534[/C][C]0.125643[/C][/ROW]
[ROW][C]19[/C][C]0.153301[/C][C]1.5931[/C][C]0.057025[/C][/ROW]
[ROW][C]20[/C][C]-0.016859[/C][C]-0.1752[/C][C]0.430624[/C][/ROW]
[/TABLE]
Source: https://freestatistics.org/blog/index.php?pk=210826&T=2

Globally Unique Identifier (entire table): ba.freestatistics.org/blog/index.php?pk=210826&T=2

As an alternative you can also use a QR Code:  

The GUIDs for individual cells are displayed in the table below:

Partial Autocorrelation Function
Time lag kPACF(k)T-STATP-value
10.9113149.47060
2-0.005435-0.05650.477532
3-0.087452-0.90880.182733
4-0.122201-1.26990.103416
5-0.056489-0.5870.279198
6-0.034963-0.36330.35853
7-0.072257-0.75090.227166
80.0553550.57530.283155
9-0.040535-0.42130.337205
100.0848550.88180.18991
11-7.6e-05-8e-040.499684
12-0.054381-0.56510.286574
130.061610.64030.261678
14-0.028939-0.30070.382094
150.0387450.40270.344001
16-0.091653-0.95250.171489
17-0.000303-0.00310.498747
18-0.110987-1.15340.125643
190.1533011.59310.057025
20-0.016859-0.17520.430624


Parameters (Session):
par1 = Default ; par2 = 1 ; par3 = 0 ; par4 = 1 ; par5 = 12 ; par6 = White Noise ; par7 = 0.95 ;
Parameters (R input):
par1 = Default ; par2 = 1 ; par3 = 0 ; par4 = 1 ; par5 = 12 ; par6 = White Noise ; par7 = 0.95 ; par8 = ;
R code (references can be found in the software module):
if (par1 == 'Default') {
par1 = 10*log10(length(x))
} else {
par1 <- as.numeric(par1)
}
par2 <- as.numeric(par2)
par3 <- as.numeric(par3)
par4 <- as.numeric(par4)
par5 <- as.numeric(par5)
if (par6 == 'White Noise') par6 <- 'white' else par6 <- 'ma'
par7 <- as.numeric(par7)
if (par8 != '') par8 <- as.numeric(par8)
ox <- x
if (par8 == '') {
if (par2 == 0) {
x <- log(x)
} else {
x <- (x ^ par2 - 1) / par2
}
} else {
x <- log(x,base=par8)
}
if (par3 > 0) x <- diff(x,lag=1,difference=par3)
if (par4 > 0) x <- diff(x,lag=par5,difference=par4)
bitmap(file='picts.png')
op <- par(mfrow=c(2,1))
plot(ox,type='l',main='Original Time Series',xlab='time',ylab='value')
if (par8=='') {
mytitle <- paste('Working Time Series (lambda=',par2,', d=',par3,', D=',par4,')',sep='')
mysub <- paste('(lambda=',par2,', d=',par3,', D=',par4,', CI=', par7, ', CI type=',par6,')',sep='')
} else {
mytitle <- paste('Working Time Series (base=',par8,', d=',par3,', D=',par4,')',sep='')
mysub <- paste('(base=',par8,', d=',par3,', D=',par4,', CI=', par7, ', CI type=',par6,')',sep='')
}
plot(x,type='l', main=mytitle,xlab='time',ylab='value')
par(op)
dev.off()
bitmap(file='pic1.png')
racf <- acf(x, par1, main='Autocorrelation', xlab='time lag', ylab='ACF', ci.type=par6, ci=par7, sub=mysub)
dev.off()
bitmap(file='pic2.png')
rpacf <- pacf(x,par1,main='Partial Autocorrelation',xlab='lags',ylab='PACF',sub=mysub)
dev.off()
(myacf <- c(racf$acf))
(mypacf <- c(rpacf$acf))
lengthx <- length(x)
sqrtn <- sqrt(lengthx)
load(file='createtable')
a<-table.start()
a<-table.row.start(a)
a<-table.element(a,'Autocorrelation Function',4,TRUE)
a<-table.row.end(a)
a<-table.row.start(a)
a<-table.element(a,'Time lag k',header=TRUE)
a<-table.element(a,hyperlink('basics.htm','ACF(k)','click here for more information about the Autocorrelation Function'),header=TRUE)
a<-table.element(a,'T-STAT',header=TRUE)
a<-table.element(a,'P-value',header=TRUE)
a<-table.row.end(a)
for (i in 2:(par1+1)) {
a<-table.row.start(a)
a<-table.element(a,i-1,header=TRUE)
a<-table.element(a,round(myacf[i],6))
mytstat <- myacf[i]*sqrtn
a<-table.element(a,round(mytstat,4))
a<-table.element(a,round(1-pt(abs(mytstat),lengthx),6))
a<-table.row.end(a)
}
a<-table.end(a)
table.save(a,file='mytable.tab')
a<-table.start()
a<-table.row.start(a)
a<-table.element(a,'Partial Autocorrelation Function',4,TRUE)
a<-table.row.end(a)
a<-table.row.start(a)
a<-table.element(a,'Time lag k',header=TRUE)
a<-table.element(a,hyperlink('basics.htm','PACF(k)','click here for more information about the Partial Autocorrelation Function'),header=TRUE)
a<-table.element(a,'T-STAT',header=TRUE)
a<-table.element(a,'P-value',header=TRUE)
a<-table.row.end(a)
for (i in 1:par1) {
a<-table.row.start(a)
a<-table.element(a,i,header=TRUE)
a<-table.element(a,round(mypacf[i],6))
mytstat <- mypacf[i]*sqrtn
a<-table.element(a,round(mytstat,4))
a<-table.element(a,round(1-pt(abs(mytstat),lengthx),6))
a<-table.row.end(a)
}
a<-table.end(a)
table.save(a,file='mytable1.tab')