Free Statistics

of Irreproducible Research!

Author's title

Author*Unverified author*
R Software Modulerwasp_autocorrelation.wasp
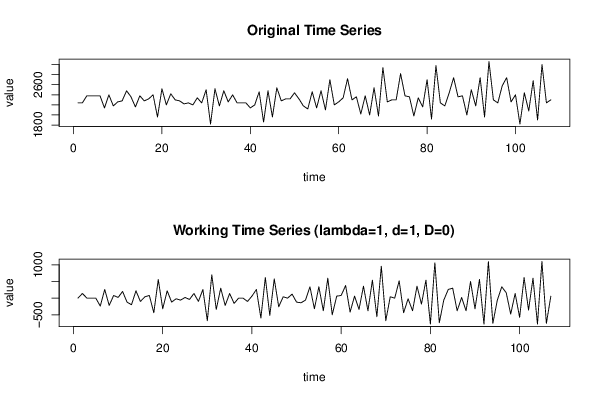
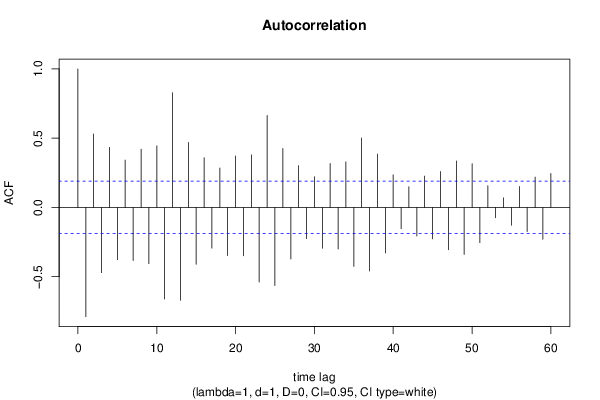
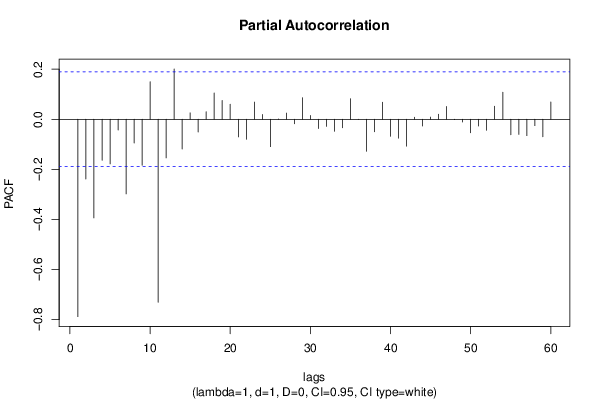
Title produced by software(Partial) Autocorrelation Function
Date of computationFri, 26 Jul 2013 11:51:47 -0400
Cite this page as followsStatistical Computations at FreeStatistics.org, Office for Research Development and Education, URL https://freestatistics.org/blog/index.php?v=date/2013/Jul/26/t1374853950rbf5favgjzqlqxe.htm/, Retrieved Sun, 28 Apr 2024 18:54:00 +0000
Statistical Computations at FreeStatistics.org, Office for Research Development and Education, URL https://freestatistics.org/blog/index.php?pk=210851, Retrieved Sun, 28 Apr 2024 18:54:00 +0000
QR Codes:

Original text written by user:
IsPrivate?No (this computation is public)
User-defined keywordsJeroen Biesemans
Estimated Impact175
Family? (F = Feedback message, R = changed R code, M = changed R Module, P = changed Parameters, D = changed Data)
-       [(Partial) Autocorrelation Function] [Tijdreeks B stap 18] [2013-07-26 15:51:47] [09688f513f3d2798cb35a3603f8bd204] [Current]
Feedback Forum

Post a new message
Dataseries X:
2240
2240
2380
2380
2380
2380
2140
2400
2180
2260
2280
2480
2360
2160
2380
2280
2320
2400
1960
2520
2200
2420
2300
2280
2220
2240
2200
2340
2240
2500
1820
2520
2180
2480
2260
2400
2240
2240
2240
2140
2200
2460
1860
2480
1960
2540
2280
2320
2320
2440
2320
2180
2120
2460
2140
2480
2100
2700
2200
2260
2340
2720
2300
2360
2020
2380
2000
2540
1980
2940
2260
2300
2300
2820
2380
2360
1980
2340
2160
2700
1920
2980
2240
2180
2440
2740
2360
2380
2000
2500
2180
2740
1960
3060
2300
2240
2580
2740
2260
2400
1820
2440
2080
2680
1900
3000
2240
2300


Summary of computational transaction
Raw Inputview raw input (R code)
Raw Outputview raw output of R engine
Computing time4 seconds
R Server'Herman Ole Andreas Wold' @ wold.wessa.net

\begin{tabular}{lllllllll}
\hline
Summary of computational transaction \tabularnewline
Raw Input & view raw input (R code)  \tabularnewline
Raw Output & view raw output of R engine  \tabularnewline
Computing time & 4 seconds \tabularnewline
R Server & 'Herman Ole Andreas Wold' @ wold.wessa.net \tabularnewline
\hline
\end{tabular}
%Source: https://freestatistics.org/blog/index.php?pk=210851&T=0

[TABLE]
[ROW][C]Summary of computational transaction[/C][/ROW]
[ROW][C]Raw Input[/C][C]view raw input (R code) [/C][/ROW]
[ROW][C]Raw Output[/C][C]view raw output of R engine [/C][/ROW]
[ROW][C]Computing time[/C][C]4 seconds[/C][/ROW]
[ROW][C]R Server[/C][C]'Herman Ole Andreas Wold' @ wold.wessa.net[/C][/ROW]
[/TABLE]
Source: https://freestatistics.org/blog/index.php?pk=210851&T=0

Globally Unique Identifier (entire table): ba.freestatistics.org/blog/index.php?pk=210851&T=0

As an alternative you can also use a QR Code:  

The GUIDs for individual cells are displayed in the table below:

Summary of computational transaction
Raw Inputview raw input (R code)
Raw Outputview raw output of R engine
Computing time4 seconds
R Server'Herman Ole Andreas Wold' @ wold.wessa.net


Autocorrelation Function
Time lag kACF(k)T-STATP-value
1-0.78815-8.15270
20.5306975.48960
3-0.470562-4.86752e-06
40.4338864.48829e-06
5-0.376435-3.89398.6e-05
60.3420543.53820.000299
7-0.382511-3.95676.8e-05
80.4202784.34741.6e-05
9-0.405686-4.19642.8e-05
100.4446534.59956e-06
11-0.661403-6.84160
120.8282328.56730
13-0.670048-6.9310
140.4686424.84772e-06
15-0.409675-4.23772.4e-05
160.3587353.71080.000165
17-0.293529-3.03630.001504
180.2846172.94410.001987
19-0.346241-3.58150.000258
200.3716863.84480.000103
21-0.348663-3.60660.000237
220.3796343.9277.6e-05
23-0.538633-5.57170
240.6641326.86980
25-0.562903-5.82270
260.4263894.41061.2e-05
27-0.371701-3.84490.000103
280.3019063.12290.001152
29-0.225108-2.32850.010882
300.2217262.29360.011885
31-0.294014-3.04130.001481
320.3177613.28690.000685
33-0.299295-3.09590.001252
340.3294683.4080.000462
35-0.425335-4.39971.3e-05
360.5020955.19370
37-0.458709-4.74493e-06
380.3853673.98636.1e-05
39-0.328212-3.39510.000482
400.2353852.43480.008276
41-0.152667-1.57920.058621
420.149741.54890.062177
43-0.205947-2.13030.017718
440.2264172.34210.010514
45-0.226488-2.34280.010494
460.2600872.69040.004141
47-0.304889-3.15380.001046
480.3360873.47650.000368
49-0.338617-3.50270.000337
500.3153473.2620.000743
51-0.253649-2.62380.004983
520.1572051.62610.05343
53-0.073741-0.76280.223637
540.0693310.71720.237417
55-0.128224-1.32640.093773
560.1510641.56260.060547
57-0.173612-1.79590.03767
580.2191762.26720.012695
59-0.229034-2.36910.009811
600.2454362.53880.006281

\begin{tabular}{lllllllll}
\hline
Autocorrelation Function \tabularnewline
Time lag k & ACF(k) & T-STAT & P-value \tabularnewline
1 & -0.78815 & -8.1527 & 0 \tabularnewline
2 & 0.530697 & 5.4896 & 0 \tabularnewline
3 & -0.470562 & -4.8675 & 2e-06 \tabularnewline
4 & 0.433886 & 4.4882 & 9e-06 \tabularnewline
5 & -0.376435 & -3.8939 & 8.6e-05 \tabularnewline
6 & 0.342054 & 3.5382 & 0.000299 \tabularnewline
7 & -0.382511 & -3.9567 & 6.8e-05 \tabularnewline
8 & 0.420278 & 4.3474 & 1.6e-05 \tabularnewline
9 & -0.405686 & -4.1964 & 2.8e-05 \tabularnewline
10 & 0.444653 & 4.5995 & 6e-06 \tabularnewline
11 & -0.661403 & -6.8416 & 0 \tabularnewline
12 & 0.828232 & 8.5673 & 0 \tabularnewline
13 & -0.670048 & -6.931 & 0 \tabularnewline
14 & 0.468642 & 4.8477 & 2e-06 \tabularnewline
15 & -0.409675 & -4.2377 & 2.4e-05 \tabularnewline
16 & 0.358735 & 3.7108 & 0.000165 \tabularnewline
17 & -0.293529 & -3.0363 & 0.001504 \tabularnewline
18 & 0.284617 & 2.9441 & 0.001987 \tabularnewline
19 & -0.346241 & -3.5815 & 0.000258 \tabularnewline
20 & 0.371686 & 3.8448 & 0.000103 \tabularnewline
21 & -0.348663 & -3.6066 & 0.000237 \tabularnewline
22 & 0.379634 & 3.927 & 7.6e-05 \tabularnewline
23 & -0.538633 & -5.5717 & 0 \tabularnewline
24 & 0.664132 & 6.8698 & 0 \tabularnewline
25 & -0.562903 & -5.8227 & 0 \tabularnewline
26 & 0.426389 & 4.4106 & 1.2e-05 \tabularnewline
27 & -0.371701 & -3.8449 & 0.000103 \tabularnewline
28 & 0.301906 & 3.1229 & 0.001152 \tabularnewline
29 & -0.225108 & -2.3285 & 0.010882 \tabularnewline
30 & 0.221726 & 2.2936 & 0.011885 \tabularnewline
31 & -0.294014 & -3.0413 & 0.001481 \tabularnewline
32 & 0.317761 & 3.2869 & 0.000685 \tabularnewline
33 & -0.299295 & -3.0959 & 0.001252 \tabularnewline
34 & 0.329468 & 3.408 & 0.000462 \tabularnewline
35 & -0.425335 & -4.3997 & 1.3e-05 \tabularnewline
36 & 0.502095 & 5.1937 & 0 \tabularnewline
37 & -0.458709 & -4.7449 & 3e-06 \tabularnewline
38 & 0.385367 & 3.9863 & 6.1e-05 \tabularnewline
39 & -0.328212 & -3.3951 & 0.000482 \tabularnewline
40 & 0.235385 & 2.4348 & 0.008276 \tabularnewline
41 & -0.152667 & -1.5792 & 0.058621 \tabularnewline
42 & 0.14974 & 1.5489 & 0.062177 \tabularnewline
43 & -0.205947 & -2.1303 & 0.017718 \tabularnewline
44 & 0.226417 & 2.3421 & 0.010514 \tabularnewline
45 & -0.226488 & -2.3428 & 0.010494 \tabularnewline
46 & 0.260087 & 2.6904 & 0.004141 \tabularnewline
47 & -0.304889 & -3.1538 & 0.001046 \tabularnewline
48 & 0.336087 & 3.4765 & 0.000368 \tabularnewline
49 & -0.338617 & -3.5027 & 0.000337 \tabularnewline
50 & 0.315347 & 3.262 & 0.000743 \tabularnewline
51 & -0.253649 & -2.6238 & 0.004983 \tabularnewline
52 & 0.157205 & 1.6261 & 0.05343 \tabularnewline
53 & -0.073741 & -0.7628 & 0.223637 \tabularnewline
54 & 0.069331 & 0.7172 & 0.237417 \tabularnewline
55 & -0.128224 & -1.3264 & 0.093773 \tabularnewline
56 & 0.151064 & 1.5626 & 0.060547 \tabularnewline
57 & -0.173612 & -1.7959 & 0.03767 \tabularnewline
58 & 0.219176 & 2.2672 & 0.012695 \tabularnewline
59 & -0.229034 & -2.3691 & 0.009811 \tabularnewline
60 & 0.245436 & 2.5388 & 0.006281 \tabularnewline
\hline
\end{tabular}
%Source: https://freestatistics.org/blog/index.php?pk=210851&T=1

[TABLE]
[ROW][C]Autocorrelation Function[/C][/ROW]
[ROW][C]Time lag k[/C][C]ACF(k)[/C][C]T-STAT[/C][C]P-value[/C][/ROW]
[ROW][C]1[/C][C]-0.78815[/C][C]-8.1527[/C][C]0[/C][/ROW]
[ROW][C]2[/C][C]0.530697[/C][C]5.4896[/C][C]0[/C][/ROW]
[ROW][C]3[/C][C]-0.470562[/C][C]-4.8675[/C][C]2e-06[/C][/ROW]
[ROW][C]4[/C][C]0.433886[/C][C]4.4882[/C][C]9e-06[/C][/ROW]
[ROW][C]5[/C][C]-0.376435[/C][C]-3.8939[/C][C]8.6e-05[/C][/ROW]
[ROW][C]6[/C][C]0.342054[/C][C]3.5382[/C][C]0.000299[/C][/ROW]
[ROW][C]7[/C][C]-0.382511[/C][C]-3.9567[/C][C]6.8e-05[/C][/ROW]
[ROW][C]8[/C][C]0.420278[/C][C]4.3474[/C][C]1.6e-05[/C][/ROW]
[ROW][C]9[/C][C]-0.405686[/C][C]-4.1964[/C][C]2.8e-05[/C][/ROW]
[ROW][C]10[/C][C]0.444653[/C][C]4.5995[/C][C]6e-06[/C][/ROW]
[ROW][C]11[/C][C]-0.661403[/C][C]-6.8416[/C][C]0[/C][/ROW]
[ROW][C]12[/C][C]0.828232[/C][C]8.5673[/C][C]0[/C][/ROW]
[ROW][C]13[/C][C]-0.670048[/C][C]-6.931[/C][C]0[/C][/ROW]
[ROW][C]14[/C][C]0.468642[/C][C]4.8477[/C][C]2e-06[/C][/ROW]
[ROW][C]15[/C][C]-0.409675[/C][C]-4.2377[/C][C]2.4e-05[/C][/ROW]
[ROW][C]16[/C][C]0.358735[/C][C]3.7108[/C][C]0.000165[/C][/ROW]
[ROW][C]17[/C][C]-0.293529[/C][C]-3.0363[/C][C]0.001504[/C][/ROW]
[ROW][C]18[/C][C]0.284617[/C][C]2.9441[/C][C]0.001987[/C][/ROW]
[ROW][C]19[/C][C]-0.346241[/C][C]-3.5815[/C][C]0.000258[/C][/ROW]
[ROW][C]20[/C][C]0.371686[/C][C]3.8448[/C][C]0.000103[/C][/ROW]
[ROW][C]21[/C][C]-0.348663[/C][C]-3.6066[/C][C]0.000237[/C][/ROW]
[ROW][C]22[/C][C]0.379634[/C][C]3.927[/C][C]7.6e-05[/C][/ROW]
[ROW][C]23[/C][C]-0.538633[/C][C]-5.5717[/C][C]0[/C][/ROW]
[ROW][C]24[/C][C]0.664132[/C][C]6.8698[/C][C]0[/C][/ROW]
[ROW][C]25[/C][C]-0.562903[/C][C]-5.8227[/C][C]0[/C][/ROW]
[ROW][C]26[/C][C]0.426389[/C][C]4.4106[/C][C]1.2e-05[/C][/ROW]
[ROW][C]27[/C][C]-0.371701[/C][C]-3.8449[/C][C]0.000103[/C][/ROW]
[ROW][C]28[/C][C]0.301906[/C][C]3.1229[/C][C]0.001152[/C][/ROW]
[ROW][C]29[/C][C]-0.225108[/C][C]-2.3285[/C][C]0.010882[/C][/ROW]
[ROW][C]30[/C][C]0.221726[/C][C]2.2936[/C][C]0.011885[/C][/ROW]
[ROW][C]31[/C][C]-0.294014[/C][C]-3.0413[/C][C]0.001481[/C][/ROW]
[ROW][C]32[/C][C]0.317761[/C][C]3.2869[/C][C]0.000685[/C][/ROW]
[ROW][C]33[/C][C]-0.299295[/C][C]-3.0959[/C][C]0.001252[/C][/ROW]
[ROW][C]34[/C][C]0.329468[/C][C]3.408[/C][C]0.000462[/C][/ROW]
[ROW][C]35[/C][C]-0.425335[/C][C]-4.3997[/C][C]1.3e-05[/C][/ROW]
[ROW][C]36[/C][C]0.502095[/C][C]5.1937[/C][C]0[/C][/ROW]
[ROW][C]37[/C][C]-0.458709[/C][C]-4.7449[/C][C]3e-06[/C][/ROW]
[ROW][C]38[/C][C]0.385367[/C][C]3.9863[/C][C]6.1e-05[/C][/ROW]
[ROW][C]39[/C][C]-0.328212[/C][C]-3.3951[/C][C]0.000482[/C][/ROW]
[ROW][C]40[/C][C]0.235385[/C][C]2.4348[/C][C]0.008276[/C][/ROW]
[ROW][C]41[/C][C]-0.152667[/C][C]-1.5792[/C][C]0.058621[/C][/ROW]
[ROW][C]42[/C][C]0.14974[/C][C]1.5489[/C][C]0.062177[/C][/ROW]
[ROW][C]43[/C][C]-0.205947[/C][C]-2.1303[/C][C]0.017718[/C][/ROW]
[ROW][C]44[/C][C]0.226417[/C][C]2.3421[/C][C]0.010514[/C][/ROW]
[ROW][C]45[/C][C]-0.226488[/C][C]-2.3428[/C][C]0.010494[/C][/ROW]
[ROW][C]46[/C][C]0.260087[/C][C]2.6904[/C][C]0.004141[/C][/ROW]
[ROW][C]47[/C][C]-0.304889[/C][C]-3.1538[/C][C]0.001046[/C][/ROW]
[ROW][C]48[/C][C]0.336087[/C][C]3.4765[/C][C]0.000368[/C][/ROW]
[ROW][C]49[/C][C]-0.338617[/C][C]-3.5027[/C][C]0.000337[/C][/ROW]
[ROW][C]50[/C][C]0.315347[/C][C]3.262[/C][C]0.000743[/C][/ROW]
[ROW][C]51[/C][C]-0.253649[/C][C]-2.6238[/C][C]0.004983[/C][/ROW]
[ROW][C]52[/C][C]0.157205[/C][C]1.6261[/C][C]0.05343[/C][/ROW]
[ROW][C]53[/C][C]-0.073741[/C][C]-0.7628[/C][C]0.223637[/C][/ROW]
[ROW][C]54[/C][C]0.069331[/C][C]0.7172[/C][C]0.237417[/C][/ROW]
[ROW][C]55[/C][C]-0.128224[/C][C]-1.3264[/C][C]0.093773[/C][/ROW]
[ROW][C]56[/C][C]0.151064[/C][C]1.5626[/C][C]0.060547[/C][/ROW]
[ROW][C]57[/C][C]-0.173612[/C][C]-1.7959[/C][C]0.03767[/C][/ROW]
[ROW][C]58[/C][C]0.219176[/C][C]2.2672[/C][C]0.012695[/C][/ROW]
[ROW][C]59[/C][C]-0.229034[/C][C]-2.3691[/C][C]0.009811[/C][/ROW]
[ROW][C]60[/C][C]0.245436[/C][C]2.5388[/C][C]0.006281[/C][/ROW]
[/TABLE]
Source: https://freestatistics.org/blog/index.php?pk=210851&T=1

Globally Unique Identifier (entire table): ba.freestatistics.org/blog/index.php?pk=210851&T=1

As an alternative you can also use a QR Code:  

The GUIDs for individual cells are displayed in the table below:

Autocorrelation Function
Time lag kACF(k)T-STATP-value
1-0.78815-8.15270
20.5306975.48960
3-0.470562-4.86752e-06
40.4338864.48829e-06
5-0.376435-3.89398.6e-05
60.3420543.53820.000299
7-0.382511-3.95676.8e-05
80.4202784.34741.6e-05
9-0.405686-4.19642.8e-05
100.4446534.59956e-06
11-0.661403-6.84160
120.8282328.56730
13-0.670048-6.9310
140.4686424.84772e-06
15-0.409675-4.23772.4e-05
160.3587353.71080.000165
17-0.293529-3.03630.001504
180.2846172.94410.001987
19-0.346241-3.58150.000258
200.3716863.84480.000103
21-0.348663-3.60660.000237
220.3796343.9277.6e-05
23-0.538633-5.57170
240.6641326.86980
25-0.562903-5.82270
260.4263894.41061.2e-05
27-0.371701-3.84490.000103
280.3019063.12290.001152
29-0.225108-2.32850.010882
300.2217262.29360.011885
31-0.294014-3.04130.001481
320.3177613.28690.000685
33-0.299295-3.09590.001252
340.3294683.4080.000462
35-0.425335-4.39971.3e-05
360.5020955.19370
37-0.458709-4.74493e-06
380.3853673.98636.1e-05
39-0.328212-3.39510.000482
400.2353852.43480.008276
41-0.152667-1.57920.058621
420.149741.54890.062177
43-0.205947-2.13030.017718
440.2264172.34210.010514
45-0.226488-2.34280.010494
460.2600872.69040.004141
47-0.304889-3.15380.001046
480.3360873.47650.000368
49-0.338617-3.50270.000337
500.3153473.2620.000743
51-0.253649-2.62380.004983
520.1572051.62610.05343
53-0.073741-0.76280.223637
540.0693310.71720.237417
55-0.128224-1.32640.093773
560.1510641.56260.060547
57-0.173612-1.79590.03767
580.2191762.26720.012695
59-0.229034-2.36910.009811
600.2454362.53880.006281


Partial Autocorrelation Function
Time lag kPACF(k)T-STATP-value
1-0.78815-8.15270
2-0.238857-2.47080.007531
3-0.393727-4.07274.5e-05
4-0.163543-1.69170.046806
5-0.178205-1.84340.034022
6-0.043126-0.44610.328215
7-0.29791-3.08160.001309
8-0.094552-0.97810.165128
9-0.183402-1.89710.030253
100.1499071.55070.061969
11-0.730997-7.56150
12-0.154207-1.59510.056816
130.2009082.07820.020041
14-0.118727-1.22810.111049
150.0256260.26510.395729
16-0.051221-0.52980.298664
170.0302070.31250.377648
180.1045961.0820.140853
190.0748640.77440.220201
200.0601470.62220.267577
21-0.070506-0.72930.233701
22-0.080021-0.82770.204829
230.06850.70860.240067
240.0190370.19690.42213
25-0.109399-1.13160.130159
260.0009590.00990.496051
270.0246470.25490.399626
28-0.017933-0.18550.426592
290.0857880.88740.188429
300.0148070.15320.439276
31-0.036983-0.38260.351404
32-0.02838-0.29360.384828
33-0.047991-0.49640.310307
34-0.0341-0.35270.362493
350.0820320.84860.199013
36-0.000202-0.00210.499168
37-0.127653-1.32050.09475
38-0.050215-0.51940.302268
390.0678990.70230.241994
40-0.068184-0.70530.241079
41-0.075356-0.77950.218705
42-0.107409-1.1110.13452
430.0077920.08060.467956
44-0.027158-0.28090.389654
450.0087130.09010.464176
460.0203620.21060.416792
470.0507090.52450.300494
48-0.001477-0.01530.493921
49-0.011134-0.11520.454263
50-0.054072-0.55930.288554
51-0.026869-0.27790.390799
52-0.044036-0.45550.324832
530.0519060.53690.29622
540.1077041.11410.133866
55-0.06208-0.64220.261072
56-0.060311-0.62390.267022
57-0.065506-0.67760.249744
58-0.025559-0.26440.395994
59-0.069608-0.720.236539
600.0689110.71280.238753

\begin{tabular}{lllllllll}
\hline
Partial Autocorrelation Function \tabularnewline
Time lag k & PACF(k) & T-STAT & P-value \tabularnewline
1 & -0.78815 & -8.1527 & 0 \tabularnewline
2 & -0.238857 & -2.4708 & 0.007531 \tabularnewline
3 & -0.393727 & -4.0727 & 4.5e-05 \tabularnewline
4 & -0.163543 & -1.6917 & 0.046806 \tabularnewline
5 & -0.178205 & -1.8434 & 0.034022 \tabularnewline
6 & -0.043126 & -0.4461 & 0.328215 \tabularnewline
7 & -0.29791 & -3.0816 & 0.001309 \tabularnewline
8 & -0.094552 & -0.9781 & 0.165128 \tabularnewline
9 & -0.183402 & -1.8971 & 0.030253 \tabularnewline
10 & 0.149907 & 1.5507 & 0.061969 \tabularnewline
11 & -0.730997 & -7.5615 & 0 \tabularnewline
12 & -0.154207 & -1.5951 & 0.056816 \tabularnewline
13 & 0.200908 & 2.0782 & 0.020041 \tabularnewline
14 & -0.118727 & -1.2281 & 0.111049 \tabularnewline
15 & 0.025626 & 0.2651 & 0.395729 \tabularnewline
16 & -0.051221 & -0.5298 & 0.298664 \tabularnewline
17 & 0.030207 & 0.3125 & 0.377648 \tabularnewline
18 & 0.104596 & 1.082 & 0.140853 \tabularnewline
19 & 0.074864 & 0.7744 & 0.220201 \tabularnewline
20 & 0.060147 & 0.6222 & 0.267577 \tabularnewline
21 & -0.070506 & -0.7293 & 0.233701 \tabularnewline
22 & -0.080021 & -0.8277 & 0.204829 \tabularnewline
23 & 0.0685 & 0.7086 & 0.240067 \tabularnewline
24 & 0.019037 & 0.1969 & 0.42213 \tabularnewline
25 & -0.109399 & -1.1316 & 0.130159 \tabularnewline
26 & 0.000959 & 0.0099 & 0.496051 \tabularnewline
27 & 0.024647 & 0.2549 & 0.399626 \tabularnewline
28 & -0.017933 & -0.1855 & 0.426592 \tabularnewline
29 & 0.085788 & 0.8874 & 0.188429 \tabularnewline
30 & 0.014807 & 0.1532 & 0.439276 \tabularnewline
31 & -0.036983 & -0.3826 & 0.351404 \tabularnewline
32 & -0.02838 & -0.2936 & 0.384828 \tabularnewline
33 & -0.047991 & -0.4964 & 0.310307 \tabularnewline
34 & -0.0341 & -0.3527 & 0.362493 \tabularnewline
35 & 0.082032 & 0.8486 & 0.199013 \tabularnewline
36 & -0.000202 & -0.0021 & 0.499168 \tabularnewline
37 & -0.127653 & -1.3205 & 0.09475 \tabularnewline
38 & -0.050215 & -0.5194 & 0.302268 \tabularnewline
39 & 0.067899 & 0.7023 & 0.241994 \tabularnewline
40 & -0.068184 & -0.7053 & 0.241079 \tabularnewline
41 & -0.075356 & -0.7795 & 0.218705 \tabularnewline
42 & -0.107409 & -1.111 & 0.13452 \tabularnewline
43 & 0.007792 & 0.0806 & 0.467956 \tabularnewline
44 & -0.027158 & -0.2809 & 0.389654 \tabularnewline
45 & 0.008713 & 0.0901 & 0.464176 \tabularnewline
46 & 0.020362 & 0.2106 & 0.416792 \tabularnewline
47 & 0.050709 & 0.5245 & 0.300494 \tabularnewline
48 & -0.001477 & -0.0153 & 0.493921 \tabularnewline
49 & -0.011134 & -0.1152 & 0.454263 \tabularnewline
50 & -0.054072 & -0.5593 & 0.288554 \tabularnewline
51 & -0.026869 & -0.2779 & 0.390799 \tabularnewline
52 & -0.044036 & -0.4555 & 0.324832 \tabularnewline
53 & 0.051906 & 0.5369 & 0.29622 \tabularnewline
54 & 0.107704 & 1.1141 & 0.133866 \tabularnewline
55 & -0.06208 & -0.6422 & 0.261072 \tabularnewline
56 & -0.060311 & -0.6239 & 0.267022 \tabularnewline
57 & -0.065506 & -0.6776 & 0.249744 \tabularnewline
58 & -0.025559 & -0.2644 & 0.395994 \tabularnewline
59 & -0.069608 & -0.72 & 0.236539 \tabularnewline
60 & 0.068911 & 0.7128 & 0.238753 \tabularnewline
\hline
\end{tabular}
%Source: https://freestatistics.org/blog/index.php?pk=210851&T=2

[TABLE]
[ROW][C]Partial Autocorrelation Function[/C][/ROW]
[ROW][C]Time lag k[/C][C]PACF(k)[/C][C]T-STAT[/C][C]P-value[/C][/ROW]
[ROW][C]1[/C][C]-0.78815[/C][C]-8.1527[/C][C]0[/C][/ROW]
[ROW][C]2[/C][C]-0.238857[/C][C]-2.4708[/C][C]0.007531[/C][/ROW]
[ROW][C]3[/C][C]-0.393727[/C][C]-4.0727[/C][C]4.5e-05[/C][/ROW]
[ROW][C]4[/C][C]-0.163543[/C][C]-1.6917[/C][C]0.046806[/C][/ROW]
[ROW][C]5[/C][C]-0.178205[/C][C]-1.8434[/C][C]0.034022[/C][/ROW]
[ROW][C]6[/C][C]-0.043126[/C][C]-0.4461[/C][C]0.328215[/C][/ROW]
[ROW][C]7[/C][C]-0.29791[/C][C]-3.0816[/C][C]0.001309[/C][/ROW]
[ROW][C]8[/C][C]-0.094552[/C][C]-0.9781[/C][C]0.165128[/C][/ROW]
[ROW][C]9[/C][C]-0.183402[/C][C]-1.8971[/C][C]0.030253[/C][/ROW]
[ROW][C]10[/C][C]0.149907[/C][C]1.5507[/C][C]0.061969[/C][/ROW]
[ROW][C]11[/C][C]-0.730997[/C][C]-7.5615[/C][C]0[/C][/ROW]
[ROW][C]12[/C][C]-0.154207[/C][C]-1.5951[/C][C]0.056816[/C][/ROW]
[ROW][C]13[/C][C]0.200908[/C][C]2.0782[/C][C]0.020041[/C][/ROW]
[ROW][C]14[/C][C]-0.118727[/C][C]-1.2281[/C][C]0.111049[/C][/ROW]
[ROW][C]15[/C][C]0.025626[/C][C]0.2651[/C][C]0.395729[/C][/ROW]
[ROW][C]16[/C][C]-0.051221[/C][C]-0.5298[/C][C]0.298664[/C][/ROW]
[ROW][C]17[/C][C]0.030207[/C][C]0.3125[/C][C]0.377648[/C][/ROW]
[ROW][C]18[/C][C]0.104596[/C][C]1.082[/C][C]0.140853[/C][/ROW]
[ROW][C]19[/C][C]0.074864[/C][C]0.7744[/C][C]0.220201[/C][/ROW]
[ROW][C]20[/C][C]0.060147[/C][C]0.6222[/C][C]0.267577[/C][/ROW]
[ROW][C]21[/C][C]-0.070506[/C][C]-0.7293[/C][C]0.233701[/C][/ROW]
[ROW][C]22[/C][C]-0.080021[/C][C]-0.8277[/C][C]0.204829[/C][/ROW]
[ROW][C]23[/C][C]0.0685[/C][C]0.7086[/C][C]0.240067[/C][/ROW]
[ROW][C]24[/C][C]0.019037[/C][C]0.1969[/C][C]0.42213[/C][/ROW]
[ROW][C]25[/C][C]-0.109399[/C][C]-1.1316[/C][C]0.130159[/C][/ROW]
[ROW][C]26[/C][C]0.000959[/C][C]0.0099[/C][C]0.496051[/C][/ROW]
[ROW][C]27[/C][C]0.024647[/C][C]0.2549[/C][C]0.399626[/C][/ROW]
[ROW][C]28[/C][C]-0.017933[/C][C]-0.1855[/C][C]0.426592[/C][/ROW]
[ROW][C]29[/C][C]0.085788[/C][C]0.8874[/C][C]0.188429[/C][/ROW]
[ROW][C]30[/C][C]0.014807[/C][C]0.1532[/C][C]0.439276[/C][/ROW]
[ROW][C]31[/C][C]-0.036983[/C][C]-0.3826[/C][C]0.351404[/C][/ROW]
[ROW][C]32[/C][C]-0.02838[/C][C]-0.2936[/C][C]0.384828[/C][/ROW]
[ROW][C]33[/C][C]-0.047991[/C][C]-0.4964[/C][C]0.310307[/C][/ROW]
[ROW][C]34[/C][C]-0.0341[/C][C]-0.3527[/C][C]0.362493[/C][/ROW]
[ROW][C]35[/C][C]0.082032[/C][C]0.8486[/C][C]0.199013[/C][/ROW]
[ROW][C]36[/C][C]-0.000202[/C][C]-0.0021[/C][C]0.499168[/C][/ROW]
[ROW][C]37[/C][C]-0.127653[/C][C]-1.3205[/C][C]0.09475[/C][/ROW]
[ROW][C]38[/C][C]-0.050215[/C][C]-0.5194[/C][C]0.302268[/C][/ROW]
[ROW][C]39[/C][C]0.067899[/C][C]0.7023[/C][C]0.241994[/C][/ROW]
[ROW][C]40[/C][C]-0.068184[/C][C]-0.7053[/C][C]0.241079[/C][/ROW]
[ROW][C]41[/C][C]-0.075356[/C][C]-0.7795[/C][C]0.218705[/C][/ROW]
[ROW][C]42[/C][C]-0.107409[/C][C]-1.111[/C][C]0.13452[/C][/ROW]
[ROW][C]43[/C][C]0.007792[/C][C]0.0806[/C][C]0.467956[/C][/ROW]
[ROW][C]44[/C][C]-0.027158[/C][C]-0.2809[/C][C]0.389654[/C][/ROW]
[ROW][C]45[/C][C]0.008713[/C][C]0.0901[/C][C]0.464176[/C][/ROW]
[ROW][C]46[/C][C]0.020362[/C][C]0.2106[/C][C]0.416792[/C][/ROW]
[ROW][C]47[/C][C]0.050709[/C][C]0.5245[/C][C]0.300494[/C][/ROW]
[ROW][C]48[/C][C]-0.001477[/C][C]-0.0153[/C][C]0.493921[/C][/ROW]
[ROW][C]49[/C][C]-0.011134[/C][C]-0.1152[/C][C]0.454263[/C][/ROW]
[ROW][C]50[/C][C]-0.054072[/C][C]-0.5593[/C][C]0.288554[/C][/ROW]
[ROW][C]51[/C][C]-0.026869[/C][C]-0.2779[/C][C]0.390799[/C][/ROW]
[ROW][C]52[/C][C]-0.044036[/C][C]-0.4555[/C][C]0.324832[/C][/ROW]
[ROW][C]53[/C][C]0.051906[/C][C]0.5369[/C][C]0.29622[/C][/ROW]
[ROW][C]54[/C][C]0.107704[/C][C]1.1141[/C][C]0.133866[/C][/ROW]
[ROW][C]55[/C][C]-0.06208[/C][C]-0.6422[/C][C]0.261072[/C][/ROW]
[ROW][C]56[/C][C]-0.060311[/C][C]-0.6239[/C][C]0.267022[/C][/ROW]
[ROW][C]57[/C][C]-0.065506[/C][C]-0.6776[/C][C]0.249744[/C][/ROW]
[ROW][C]58[/C][C]-0.025559[/C][C]-0.2644[/C][C]0.395994[/C][/ROW]
[ROW][C]59[/C][C]-0.069608[/C][C]-0.72[/C][C]0.236539[/C][/ROW]
[ROW][C]60[/C][C]0.068911[/C][C]0.7128[/C][C]0.238753[/C][/ROW]
[/TABLE]
Source: https://freestatistics.org/blog/index.php?pk=210851&T=2

Globally Unique Identifier (entire table): ba.freestatistics.org/blog/index.php?pk=210851&T=2

As an alternative you can also use a QR Code:  

The GUIDs for individual cells are displayed in the table below:

Partial Autocorrelation Function
Time lag kPACF(k)T-STATP-value
1-0.78815-8.15270
2-0.238857-2.47080.007531
3-0.393727-4.07274.5e-05
4-0.163543-1.69170.046806
5-0.178205-1.84340.034022
6-0.043126-0.44610.328215
7-0.29791-3.08160.001309
8-0.094552-0.97810.165128
9-0.183402-1.89710.030253
100.1499071.55070.061969
11-0.730997-7.56150
12-0.154207-1.59510.056816
130.2009082.07820.020041
14-0.118727-1.22810.111049
150.0256260.26510.395729
16-0.051221-0.52980.298664
170.0302070.31250.377648
180.1045961.0820.140853
190.0748640.77440.220201
200.0601470.62220.267577
21-0.070506-0.72930.233701
22-0.080021-0.82770.204829
230.06850.70860.240067
240.0190370.19690.42213
25-0.109399-1.13160.130159
260.0009590.00990.496051
270.0246470.25490.399626
28-0.017933-0.18550.426592
290.0857880.88740.188429
300.0148070.15320.439276
31-0.036983-0.38260.351404
32-0.02838-0.29360.384828
33-0.047991-0.49640.310307
34-0.0341-0.35270.362493
350.0820320.84860.199013
36-0.000202-0.00210.499168
37-0.127653-1.32050.09475
38-0.050215-0.51940.302268
390.0678990.70230.241994
40-0.068184-0.70530.241079
41-0.075356-0.77950.218705
42-0.107409-1.1110.13452
430.0077920.08060.467956
44-0.027158-0.28090.389654
450.0087130.09010.464176
460.0203620.21060.416792
470.0507090.52450.300494
48-0.001477-0.01530.493921
49-0.011134-0.11520.454263
50-0.054072-0.55930.288554
51-0.026869-0.27790.390799
52-0.044036-0.45550.324832
530.0519060.53690.29622
540.1077041.11410.133866
55-0.06208-0.64220.261072
56-0.060311-0.62390.267022
57-0.065506-0.67760.249744
58-0.025559-0.26440.395994
59-0.069608-0.720.236539
600.0689110.71280.238753


Parameters (Session):
par1 = 60 ; par2 = 1 ; par3 = 1 ; par4 = 0 ; par5 = 12 ; par6 = White Noise ; par7 = 0.95 ;
Parameters (R input):
par1 = 60 ; par2 = 1 ; par3 = 1 ; par4 = 0 ; par5 = 12 ; par6 = White Noise ; par7 = 0.95 ; par8 = ;
R code (references can be found in the software module):
par8 <- ''
par7 <- '0.95'
par6 <- 'White Noise'
par5 <- '12'
par4 <- '0'
par3 <- '0'
par2 <- '1'
par1 <- '60'
if (par1 == 'Default') {
par1 = 10*log10(length(x))
} else {
par1 <- as.numeric(par1)
}
par2 <- as.numeric(par2)
par3 <- as.numeric(par3)
par4 <- as.numeric(par4)
par5 <- as.numeric(par5)
if (par6 == 'White Noise') par6 <- 'white' else par6 <- 'ma'
par7 <- as.numeric(par7)
if (par8 != '') par8 <- as.numeric(par8)
ox <- x
if (par8 == '') {
if (par2 == 0) {
x <- log(x)
} else {
x <- (x ^ par2 - 1) / par2
}
} else {
x <- log(x,base=par8)
}
if (par3 > 0) x <- diff(x,lag=1,difference=par3)
if (par4 > 0) x <- diff(x,lag=par5,difference=par4)
bitmap(file='picts.png')
op <- par(mfrow=c(2,1))
plot(ox,type='l',main='Original Time Series',xlab='time',ylab='value')
if (par8=='') {
mytitle <- paste('Working Time Series (lambda=',par2,', d=',par3,', D=',par4,')',sep='')
mysub <- paste('(lambda=',par2,', d=',par3,', D=',par4,', CI=', par7, ', CI type=',par6,')',sep='')
} else {
mytitle <- paste('Working Time Series (base=',par8,', d=',par3,', D=',par4,')',sep='')
mysub <- paste('(base=',par8,', d=',par3,', D=',par4,', CI=', par7, ', CI type=',par6,')',sep='')
}
plot(x,type='l', main=mytitle,xlab='time',ylab='value')
par(op)
dev.off()
bitmap(file='pic1.png')
racf <- acf(x, par1, main='Autocorrelation', xlab='time lag', ylab='ACF', ci.type=par6, ci=par7, sub=mysub)
dev.off()
bitmap(file='pic2.png')
rpacf <- pacf(x,par1,main='Partial Autocorrelation',xlab='lags',ylab='PACF',sub=mysub)
dev.off()
(myacf <- c(racf$acf))
(mypacf <- c(rpacf$acf))
lengthx <- length(x)
sqrtn <- sqrt(lengthx)
load(file='createtable')
a<-table.start()
a<-table.row.start(a)
a<-table.element(a,'Autocorrelation Function',4,TRUE)
a<-table.row.end(a)
a<-table.row.start(a)
a<-table.element(a,'Time lag k',header=TRUE)
a<-table.element(a,hyperlink('basics.htm','ACF(k)','click here for more information about the Autocorrelation Function'),header=TRUE)
a<-table.element(a,'T-STAT',header=TRUE)
a<-table.element(a,'P-value',header=TRUE)
a<-table.row.end(a)
for (i in 2:(par1+1)) {
a<-table.row.start(a)
a<-table.element(a,i-1,header=TRUE)
a<-table.element(a,round(myacf[i],6))
mytstat <- myacf[i]*sqrtn
a<-table.element(a,round(mytstat,4))
a<-table.element(a,round(1-pt(abs(mytstat),lengthx),6))
a<-table.row.end(a)
}
a<-table.end(a)
table.save(a,file='mytable.tab')
a<-table.start()
a<-table.row.start(a)
a<-table.element(a,'Partial Autocorrelation Function',4,TRUE)
a<-table.row.end(a)
a<-table.row.start(a)
a<-table.element(a,'Time lag k',header=TRUE)
a<-table.element(a,hyperlink('basics.htm','PACF(k)','click here for more information about the Partial Autocorrelation Function'),header=TRUE)
a<-table.element(a,'T-STAT',header=TRUE)
a<-table.element(a,'P-value',header=TRUE)
a<-table.row.end(a)
for (i in 1:par1) {
a<-table.row.start(a)
a<-table.element(a,i,header=TRUE)
a<-table.element(a,round(mypacf[i],6))
mytstat <- mypacf[i]*sqrtn
a<-table.element(a,round(mytstat,4))
a<-table.element(a,round(1-pt(abs(mytstat),lengthx),6))
a<-table.row.end(a)
}
a<-table.end(a)
table.save(a,file='mytable1.tab')