Free Statistics

of Irreproducible Research!

Author's title

Author*Unverified author*
R Software Modulerwasp_smp.wasp
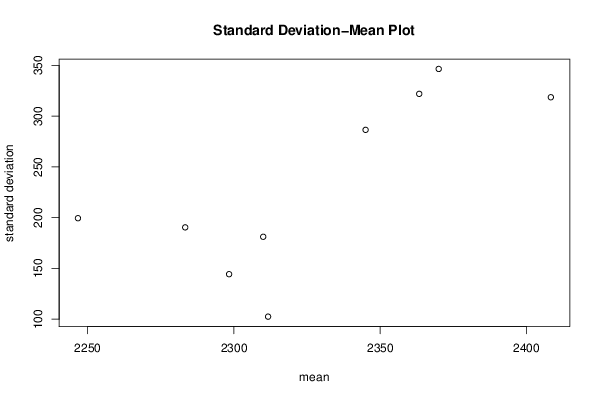
Title produced by softwareStandard Deviation-Mean Plot
Date of computationFri, 26 Jul 2013 12:09:10 -0400
Cite this page as followsStatistical Computations at FreeStatistics.org, Office for Research Development and Education, URL https://freestatistics.org/blog/index.php?v=date/2013/Jul/26/t1374855016614hrhybxv8tiso.htm/, Retrieved Sun, 28 Apr 2024 19:47:58 +0000
Statistical Computations at FreeStatistics.org, Office for Research Development and Education, URL https://freestatistics.org/blog/index.php?pk=210853, Retrieved Sun, 28 Apr 2024 19:47:58 +0000
QR Codes:

Original text written by user:
IsPrivate?No (this computation is public)
User-defined keywordsJeroen Biesemans
Estimated Impact158
Family? (F = Feedback message, R = changed R code, M = changed R Module, P = changed Parameters, D = changed Data)
-       [Standard Deviation-Mean Plot] [Tijdreeks B stap 21] [2013-07-26 16:09:10] [09688f513f3d2798cb35a3603f8bd204] [Current]
Feedback Forum

Post a new message
Dataseries X:
2240
2240
2380
2380
2380
2380
2140
2400
2180
2260
2280
2480
2360
2160
2380
2280
2320
2400
1960
2520
2200
2420
2300
2280
2220
2240
2200
2340
2240
2500
1820
2520
2180
2480
2260
2400
2240
2240
2240
2140
2200
2460
1860
2480
1960
2540
2280
2320
2320
2440
2320
2180
2120
2460
2140
2480
2100
2700
2200
2260
2340
2720
2300
2360
2020
2380
2000
2540
1980
2940
2260
2300
2300
2820
2380
2360
1980
2340
2160
2700
1920
2980
2240
2180
2440
2740
2360
2380
2000
2500
2180
2740
1960
3060
2300
2240
2580
2740
2260
2400
1820
2440
2080
2680
1900
3000
2240
2300


Summary of computational transaction
Raw Inputview raw input (R code)
Raw Outputview raw output of R engine
Computing time3 seconds
R Server'Sir Maurice George Kendall' @ kendall.wessa.net

\begin{tabular}{lllllllll}
\hline
Summary of computational transaction \tabularnewline
Raw Input & view raw input (R code)  \tabularnewline
Raw Output & view raw output of R engine  \tabularnewline
Computing time & 3 seconds \tabularnewline
R Server & 'Sir Maurice George Kendall' @ kendall.wessa.net \tabularnewline
\hline
\end{tabular}
%Source: https://freestatistics.org/blog/index.php?pk=210853&T=0

[TABLE]
[ROW][C]Summary of computational transaction[/C][/ROW]
[ROW][C]Raw Input[/C][C]view raw input (R code) [/C][/ROW]
[ROW][C]Raw Output[/C][C]view raw output of R engine [/C][/ROW]
[ROW][C]Computing time[/C][C]3 seconds[/C][/ROW]
[ROW][C]R Server[/C][C]'Sir Maurice George Kendall' @ kendall.wessa.net[/C][/ROW]
[/TABLE]
Source: https://freestatistics.org/blog/index.php?pk=210853&T=0

Globally Unique Identifier (entire table): ba.freestatistics.org/blog/index.php?pk=210853&T=0

As an alternative you can also use a QR Code:  

The GUIDs for individual cells are displayed in the table below:

Summary of computational transaction
Raw Inputview raw input (R code)
Raw Outputview raw output of R engine
Computing time3 seconds
R Server'Sir Maurice George Kendall' @ kendall.wessa.net


Standard Deviation-Mean Plot
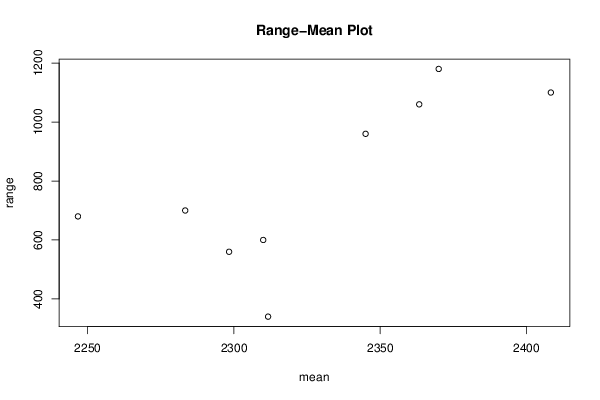
SectionMeanStandard DeviationRange
12311.66666666667102.499076122961340
22298.33333333333144.337567297406560
32283.33333333333190.469913316481700
42246.66666666667199.514562390971680
52310181.208067249677600
62345286.562701372984960
72363.33333333333322.0201386512491060
82408.33333333333318.6857481291031100
92370346.5675849081831180

\begin{tabular}{lllllllll}
\hline
Standard Deviation-Mean Plot \tabularnewline
Section & Mean & Standard Deviation & Range \tabularnewline
1 & 2311.66666666667 & 102.499076122961 & 340 \tabularnewline
2 & 2298.33333333333 & 144.337567297406 & 560 \tabularnewline
3 & 2283.33333333333 & 190.469913316481 & 700 \tabularnewline
4 & 2246.66666666667 & 199.514562390971 & 680 \tabularnewline
5 & 2310 & 181.208067249677 & 600 \tabularnewline
6 & 2345 & 286.562701372984 & 960 \tabularnewline
7 & 2363.33333333333 & 322.020138651249 & 1060 \tabularnewline
8 & 2408.33333333333 & 318.685748129103 & 1100 \tabularnewline
9 & 2370 & 346.567584908183 & 1180 \tabularnewline
\hline
\end{tabular}
%Source: https://freestatistics.org/blog/index.php?pk=210853&T=1

[TABLE]
[ROW][C]Standard Deviation-Mean Plot[/C][/ROW]
[ROW][C]Section[/C][C]Mean[/C][C]Standard Deviation[/C][C]Range[/C][/ROW]
[ROW][C]1[/C][C]2311.66666666667[/C][C]102.499076122961[/C][C]340[/C][/ROW]
[ROW][C]2[/C][C]2298.33333333333[/C][C]144.337567297406[/C][C]560[/C][/ROW]
[ROW][C]3[/C][C]2283.33333333333[/C][C]190.469913316481[/C][C]700[/C][/ROW]
[ROW][C]4[/C][C]2246.66666666667[/C][C]199.514562390971[/C][C]680[/C][/ROW]
[ROW][C]5[/C][C]2310[/C][C]181.208067249677[/C][C]600[/C][/ROW]
[ROW][C]6[/C][C]2345[/C][C]286.562701372984[/C][C]960[/C][/ROW]
[ROW][C]7[/C][C]2363.33333333333[/C][C]322.020138651249[/C][C]1060[/C][/ROW]
[ROW][C]8[/C][C]2408.33333333333[/C][C]318.685748129103[/C][C]1100[/C][/ROW]
[ROW][C]9[/C][C]2370[/C][C]346.567584908183[/C][C]1180[/C][/ROW]
[/TABLE]
Source: https://freestatistics.org/blog/index.php?pk=210853&T=1

Globally Unique Identifier (entire table): ba.freestatistics.org/blog/index.php?pk=210853&T=1

As an alternative you can also use a QR Code:  

The GUIDs for individual cells are displayed in the table below:

Standard Deviation-Mean Plot
SectionMeanStandard DeviationRange
12311.66666666667102.499076122961340
22298.33333333333144.337567297406560
32283.33333333333190.469913316481700
42246.66666666667199.514562390971680
52310181.208067249677600
62345286.562701372984960
72363.33333333333322.0201386512491060
82408.33333333333318.6857481291031100
92370346.5675849081831180


Regression: S.E.(k) = alpha + beta * Mean(k)
alpha-2822.8591286001
beta1.31337036380385
S.D.0.444216829639617
T-STAT2.95659749062042
p-value0.0212072422683434

\begin{tabular}{lllllllll}
\hline
Regression: S.E.(k) = alpha + beta * Mean(k) \tabularnewline
alpha & -2822.8591286001 \tabularnewline
beta & 1.31337036380385 \tabularnewline
S.D. & 0.444216829639617 \tabularnewline
T-STAT & 2.95659749062042 \tabularnewline
p-value & 0.0212072422683434 \tabularnewline
\hline
\end{tabular}
%Source: https://freestatistics.org/blog/index.php?pk=210853&T=2

[TABLE]
[ROW][C]Regression: S.E.(k) = alpha + beta * Mean(k)[/C][/ROW]
[ROW][C]alpha[/C][C]-2822.8591286001[/C][/ROW]
[ROW][C]beta[/C][C]1.31337036380385[/C][/ROW]
[ROW][C]S.D.[/C][C]0.444216829639617[/C][/ROW]
[ROW][C]T-STAT[/C][C]2.95659749062042[/C][/ROW]
[ROW][C]p-value[/C][C]0.0212072422683434[/C][/ROW]
[/TABLE]
Source: https://freestatistics.org/blog/index.php?pk=210853&T=2

Globally Unique Identifier (entire table): ba.freestatistics.org/blog/index.php?pk=210853&T=2

As an alternative you can also use a QR Code:  

The GUIDs for individual cells are displayed in the table below:

Regression: S.E.(k) = alpha + beta * Mean(k)
alpha-2822.8591286001
beta1.31337036380385
S.D.0.444216829639617
T-STAT2.95659749062042
p-value0.0212072422683434


Regression: ln S.E.(k) = alpha + beta * ln Mean(k)
alpha-93.7779479546656
beta12.7911514151915
S.D.5.54467117946547
T-STAT2.30692695764596
p-value0.054432679137569
Lambda-11.7911514151915

\begin{tabular}{lllllllll}
\hline
Regression: ln S.E.(k) = alpha + beta * ln Mean(k) \tabularnewline
alpha & -93.7779479546656 \tabularnewline
beta & 12.7911514151915 \tabularnewline
S.D. & 5.54467117946547 \tabularnewline
T-STAT & 2.30692695764596 \tabularnewline
p-value & 0.054432679137569 \tabularnewline
Lambda & -11.7911514151915 \tabularnewline
\hline
\end{tabular}
%Source: https://freestatistics.org/blog/index.php?pk=210853&T=3

[TABLE]
[ROW][C]Regression: ln S.E.(k) = alpha + beta * ln Mean(k)[/C][/ROW]
[ROW][C]alpha[/C][C]-93.7779479546656[/C][/ROW]
[ROW][C]beta[/C][C]12.7911514151915[/C][/ROW]
[ROW][C]S.D.[/C][C]5.54467117946547[/C][/ROW]
[ROW][C]T-STAT[/C][C]2.30692695764596[/C][/ROW]
[ROW][C]p-value[/C][C]0.054432679137569[/C][/ROW]
[ROW][C]Lambda[/C][C]-11.7911514151915[/C][/ROW]
[/TABLE]
Source: https://freestatistics.org/blog/index.php?pk=210853&T=3

Globally Unique Identifier (entire table): ba.freestatistics.org/blog/index.php?pk=210853&T=3

As an alternative you can also use a QR Code:  

The GUIDs for individual cells are displayed in the table below:

Regression: ln S.E.(k) = alpha + beta * ln Mean(k)
alpha-93.7779479546656
beta12.7911514151915
S.D.5.54467117946547
T-STAT2.30692695764596
p-value0.054432679137569
Lambda-11.7911514151915


Parameters (Session):
par1 = 12 ;
Parameters (R input):
par1 = 12 ;
R code (references can be found in the software module):
par1 <- as.numeric(par1)
(n <- length(x))
(np <- floor(n / par1))
arr <- array(NA,dim=c(par1,np))
j <- 0
k <- 1
for (i in 1:(np*par1))
{
j = j + 1
arr[j,k] <- x[i]
if (j == par1) {
j = 0
k=k+1
}
}
arr
arr.mean <- array(NA,dim=np)
arr.sd <- array(NA,dim=np)
arr.range <- array(NA,dim=np)
for (j in 1:np)
{
arr.mean[j] <- mean(arr[,j],na.rm=TRUE)
arr.sd[j] <- sd(arr[,j],na.rm=TRUE)
arr.range[j] <- max(arr[,j],na.rm=TRUE) - min(arr[,j],na.rm=TRUE)
}
arr.mean
arr.sd
arr.range
(lm1 <- lm(arr.sd~arr.mean))
(lnlm1 <- lm(log(arr.sd)~log(arr.mean)))
(lm2 <- lm(arr.range~arr.mean))
bitmap(file='test1.png')
plot(arr.mean,arr.sd,main='Standard Deviation-Mean Plot',xlab='mean',ylab='standard deviation')
dev.off()
bitmap(file='test2.png')
plot(arr.mean,arr.range,main='Range-Mean Plot',xlab='mean',ylab='range')
dev.off()
load(file='createtable')
a<-table.start()
a<-table.row.start(a)
a<-table.element(a,'Standard Deviation-Mean Plot',4,TRUE)
a<-table.row.end(a)
a<-table.row.start(a)
a<-table.element(a,'Section',header=TRUE)
a<-table.element(a,'Mean',header=TRUE)
a<-table.element(a,'Standard Deviation',header=TRUE)
a<-table.element(a,'Range',header=TRUE)
a<-table.row.end(a)
for (j in 1:np) {
a<-table.row.start(a)
a<-table.element(a,j,header=TRUE)
a<-table.element(a,arr.mean[j])
a<-table.element(a,arr.sd[j] )
a<-table.element(a,arr.range[j] )
a<-table.row.end(a)
}
a<-table.end(a)
table.save(a,file='mytable.tab')
a<-table.start()
a<-table.row.start(a)
a<-table.element(a,'Regression: S.E.(k) = alpha + beta * Mean(k)',2,TRUE)
a<-table.row.end(a)
a<-table.row.start(a)
a<-table.element(a,'alpha',header=TRUE)
a<-table.element(a,lm1$coefficients[[1]])
a<-table.row.end(a)
a<-table.row.start(a)
a<-table.element(a,'beta',header=TRUE)
a<-table.element(a,lm1$coefficients[[2]])
a<-table.row.end(a)
a<-table.row.start(a)
a<-table.element(a,'S.D.',header=TRUE)
a<-table.element(a,summary(lm1)$coefficients[2,2])
a<-table.row.end(a)
a<-table.row.start(a)
a<-table.element(a,'T-STAT',header=TRUE)
a<-table.element(a,summary(lm1)$coefficients[2,3])
a<-table.row.end(a)
a<-table.row.start(a)
a<-table.element(a,'p-value',header=TRUE)
a<-table.element(a,summary(lm1)$coefficients[2,4])
a<-table.row.end(a)
a<-table.end(a)
table.save(a,file='mytable1.tab')
a<-table.start()
a<-table.row.start(a)
a<-table.element(a,'Regression: ln S.E.(k) = alpha + beta * ln Mean(k)',2,TRUE)
a<-table.row.end(a)
a<-table.row.start(a)
a<-table.element(a,'alpha',header=TRUE)
a<-table.element(a,lnlm1$coefficients[[1]])
a<-table.row.end(a)
a<-table.row.start(a)
a<-table.element(a,'beta',header=TRUE)
a<-table.element(a,lnlm1$coefficients[[2]])
a<-table.row.end(a)
a<-table.row.start(a)
a<-table.element(a,'S.D.',header=TRUE)
a<-table.element(a,summary(lnlm1)$coefficients[2,2])
a<-table.row.end(a)
a<-table.row.start(a)
a<-table.element(a,'T-STAT',header=TRUE)
a<-table.element(a,summary(lnlm1)$coefficients[2,3])
a<-table.row.end(a)
a<-table.row.start(a)
a<-table.element(a,'p-value',header=TRUE)
a<-table.element(a,summary(lnlm1)$coefficients[2,4])
a<-table.row.end(a)
a<-table.row.start(a)
a<-table.element(a,'Lambda',header=TRUE)
a<-table.element(a,1-lnlm1$coefficients[[2]])
a<-table.row.end(a)
a<-table.end(a)
table.save(a,file='mytable2.tab')