Free Statistics

of Irreproducible Research!

Author's title

Author*Unverified author*
R Software Modulerwasp_autocorrelation.wasp
Title produced by software(Partial) Autocorrelation Function
Date of computationTue, 07 May 2013 14:48:42 -0400
Cite this page as followsStatistical Computations at FreeStatistics.org, Office for Research Development and Education, URL https://freestatistics.org/blog/index.php?v=date/2013/May/07/t1367952580n5485jeb5vz3b0i.htm/, Retrieved Thu, 02 May 2024 08:24:12 +0000
Statistical Computations at FreeStatistics.org, Office for Research Development and Education, URL https://freestatistics.org/blog/index.php?pk=208763, Retrieved Thu, 02 May 2024 08:24:12 +0000
QR Codes:

Original text written by user:
IsPrivate?No (this computation is public)
User-defined keywords
Estimated Impact157
Family? (F = Feedback message, R = changed R code, M = changed R Module, P = changed Parameters, D = changed Data)
-       [(Partial) Autocorrelation Function] [] [2013-05-07 18:48:42] [09688f513f3d2798cb35a3603f8bd204] [Current]
Feedback Forum

Post a new message
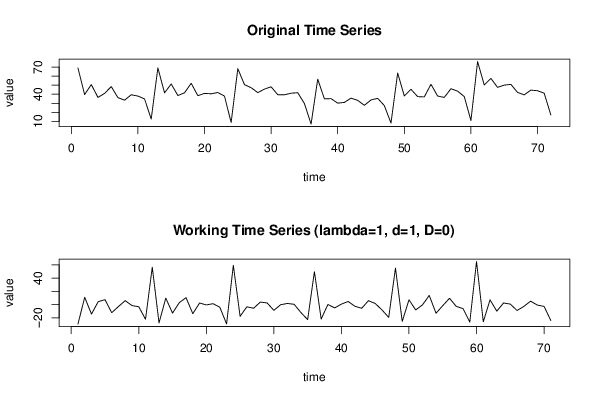
Dataseries X:
68.906
39.556
50.669
36.432
40.891
48.428
36.222
33.425
39.401
37.967
34.801
12.657
69.116
41.519
51.321
38.529
41.547
52.073
38.401
40.898
40.439
41.888
37.898
8.771
68.184
50.530
47.221
41.756
45.633
48.138
39.486
39.341
41.117
41.629
29.722
7.054
56.676
34.870
35.117
30.169
30.936
35.699
33.228
27.733
33.666
35.429
27.438
8.170
63.410
38.040
45.389
37.353
37.024
50.957
37.994
36.454
46.080
43.373
37.395
10.963
76.058
50.179
57.452
47.568
50.050
50.856
41.992
39.284
44.521
43.832
41.153
17.100


Summary of computational transaction
Raw Inputview raw input (R code)
Raw Outputview raw output of R engine
Computing time4 seconds
R Server'Gertrude Mary Cox' @ cox.wessa.net

\begin{tabular}{lllllllll}
\hline
Summary of computational transaction \tabularnewline
Raw Input & view raw input (R code)  \tabularnewline
Raw Output & view raw output of R engine  \tabularnewline
Computing time & 4 seconds \tabularnewline
R Server & 'Gertrude Mary Cox' @ cox.wessa.net \tabularnewline
\hline
\end{tabular}
%Source: https://freestatistics.org/blog/index.php?pk=208763&T=0

[TABLE]
[ROW][C]Summary of computational transaction[/C][/ROW]
[ROW][C]Raw Input[/C][C]view raw input (R code) [/C][/ROW]
[ROW][C]Raw Output[/C][C]view raw output of R engine [/C][/ROW]
[ROW][C]Computing time[/C][C]4 seconds[/C][/ROW]
[ROW][C]R Server[/C][C]'Gertrude Mary Cox' @ cox.wessa.net[/C][/ROW]
[/TABLE]
Source: https://freestatistics.org/blog/index.php?pk=208763&T=0

Globally Unique Identifier (entire table): ba.freestatistics.org/blog/index.php?pk=208763&T=0

As an alternative you can also use a QR Code:  

The GUIDs for individual cells are displayed in the table below:

Summary of computational transaction
Raw Inputview raw input (R code)
Raw Outputview raw output of R engine
Computing time4 seconds
R Server'Gertrude Mary Cox' @ cox.wessa.net


Autocorrelation Function
Time lag kACF(k)T-STATP-value
1-0.561793-4.73385e-06
20.104220.87820.191406
3-0.074129-0.62460.26711
40.0759220.63970.262202
50.122241.030.153249
6-0.252028-2.12360.018594
70.1098830.92590.17882
80.1009040.85020.199028
9-0.097619-0.82260.206758
100.1284081.0820.14146
11-0.538659-4.53881.1e-05
120.7593896.39870
13-0.409459-3.45020.000473
140.0606410.5110.30548
15-0.04338-0.36550.357902
160.043440.3660.357716
170.0984720.82970.204732
18-0.19534-1.6460.052096
190.0603080.50820.306456
200.1097890.92510.179024
21-0.095292-0.80290.212343
220.1016210.85630.197364
23-0.395631-3.33360.000682
240.5458784.59979e-06
25-0.303483-2.55720.006345
260.0556370.46880.320321
27-0.046126-0.38870.349343
280.0391960.33030.371083
290.0834480.70310.242132
30-0.161286-1.3590.089221
310.0568960.47940.31656
320.0827940.69760.243842
33-0.072737-0.61290.270952
340.1031250.86890.193902
35-0.322902-2.72080.004092
360.4330663.64910.000249
37-0.232656-1.96040.026937
380.0578960.48780.313582
39-0.032324-0.27240.393064
400.0201420.16970.432858
410.0625020.52670.300038
42-0.12475-1.05120.148375
430.0523450.44110.330251
440.0546480.46050.323293
45-0.070764-0.59630.276447
460.1119850.94360.174287
47-0.269073-2.26730.013211
480.2758372.32420.011489

\begin{tabular}{lllllllll}
\hline
Autocorrelation Function \tabularnewline
Time lag k & ACF(k) & T-STAT & P-value \tabularnewline
1 & -0.561793 & -4.7338 & 5e-06 \tabularnewline
2 & 0.10422 & 0.8782 & 0.191406 \tabularnewline
3 & -0.074129 & -0.6246 & 0.26711 \tabularnewline
4 & 0.075922 & 0.6397 & 0.262202 \tabularnewline
5 & 0.12224 & 1.03 & 0.153249 \tabularnewline
6 & -0.252028 & -2.1236 & 0.018594 \tabularnewline
7 & 0.109883 & 0.9259 & 0.17882 \tabularnewline
8 & 0.100904 & 0.8502 & 0.199028 \tabularnewline
9 & -0.097619 & -0.8226 & 0.206758 \tabularnewline
10 & 0.128408 & 1.082 & 0.14146 \tabularnewline
11 & -0.538659 & -4.5388 & 1.1e-05 \tabularnewline
12 & 0.759389 & 6.3987 & 0 \tabularnewline
13 & -0.409459 & -3.4502 & 0.000473 \tabularnewline
14 & 0.060641 & 0.511 & 0.30548 \tabularnewline
15 & -0.04338 & -0.3655 & 0.357902 \tabularnewline
16 & 0.04344 & 0.366 & 0.357716 \tabularnewline
17 & 0.098472 & 0.8297 & 0.204732 \tabularnewline
18 & -0.19534 & -1.646 & 0.052096 \tabularnewline
19 & 0.060308 & 0.5082 & 0.306456 \tabularnewline
20 & 0.109789 & 0.9251 & 0.179024 \tabularnewline
21 & -0.095292 & -0.8029 & 0.212343 \tabularnewline
22 & 0.101621 & 0.8563 & 0.197364 \tabularnewline
23 & -0.395631 & -3.3336 & 0.000682 \tabularnewline
24 & 0.545878 & 4.5997 & 9e-06 \tabularnewline
25 & -0.303483 & -2.5572 & 0.006345 \tabularnewline
26 & 0.055637 & 0.4688 & 0.320321 \tabularnewline
27 & -0.046126 & -0.3887 & 0.349343 \tabularnewline
28 & 0.039196 & 0.3303 & 0.371083 \tabularnewline
29 & 0.083448 & 0.7031 & 0.242132 \tabularnewline
30 & -0.161286 & -1.359 & 0.089221 \tabularnewline
31 & 0.056896 & 0.4794 & 0.31656 \tabularnewline
32 & 0.082794 & 0.6976 & 0.243842 \tabularnewline
33 & -0.072737 & -0.6129 & 0.270952 \tabularnewline
34 & 0.103125 & 0.8689 & 0.193902 \tabularnewline
35 & -0.322902 & -2.7208 & 0.004092 \tabularnewline
36 & 0.433066 & 3.6491 & 0.000249 \tabularnewline
37 & -0.232656 & -1.9604 & 0.026937 \tabularnewline
38 & 0.057896 & 0.4878 & 0.313582 \tabularnewline
39 & -0.032324 & -0.2724 & 0.393064 \tabularnewline
40 & 0.020142 & 0.1697 & 0.432858 \tabularnewline
41 & 0.062502 & 0.5267 & 0.300038 \tabularnewline
42 & -0.12475 & -1.0512 & 0.148375 \tabularnewline
43 & 0.052345 & 0.4411 & 0.330251 \tabularnewline
44 & 0.054648 & 0.4605 & 0.323293 \tabularnewline
45 & -0.070764 & -0.5963 & 0.276447 \tabularnewline
46 & 0.111985 & 0.9436 & 0.174287 \tabularnewline
47 & -0.269073 & -2.2673 & 0.013211 \tabularnewline
48 & 0.275837 & 2.3242 & 0.011489 \tabularnewline
\hline
\end{tabular}
%Source: https://freestatistics.org/blog/index.php?pk=208763&T=1

[TABLE]
[ROW][C]Autocorrelation Function[/C][/ROW]
[ROW][C]Time lag k[/C][C]ACF(k)[/C][C]T-STAT[/C][C]P-value[/C][/ROW]
[ROW][C]1[/C][C]-0.561793[/C][C]-4.7338[/C][C]5e-06[/C][/ROW]
[ROW][C]2[/C][C]0.10422[/C][C]0.8782[/C][C]0.191406[/C][/ROW]
[ROW][C]3[/C][C]-0.074129[/C][C]-0.6246[/C][C]0.26711[/C][/ROW]
[ROW][C]4[/C][C]0.075922[/C][C]0.6397[/C][C]0.262202[/C][/ROW]
[ROW][C]5[/C][C]0.12224[/C][C]1.03[/C][C]0.153249[/C][/ROW]
[ROW][C]6[/C][C]-0.252028[/C][C]-2.1236[/C][C]0.018594[/C][/ROW]
[ROW][C]7[/C][C]0.109883[/C][C]0.9259[/C][C]0.17882[/C][/ROW]
[ROW][C]8[/C][C]0.100904[/C][C]0.8502[/C][C]0.199028[/C][/ROW]
[ROW][C]9[/C][C]-0.097619[/C][C]-0.8226[/C][C]0.206758[/C][/ROW]
[ROW][C]10[/C][C]0.128408[/C][C]1.082[/C][C]0.14146[/C][/ROW]
[ROW][C]11[/C][C]-0.538659[/C][C]-4.5388[/C][C]1.1e-05[/C][/ROW]
[ROW][C]12[/C][C]0.759389[/C][C]6.3987[/C][C]0[/C][/ROW]
[ROW][C]13[/C][C]-0.409459[/C][C]-3.4502[/C][C]0.000473[/C][/ROW]
[ROW][C]14[/C][C]0.060641[/C][C]0.511[/C][C]0.30548[/C][/ROW]
[ROW][C]15[/C][C]-0.04338[/C][C]-0.3655[/C][C]0.357902[/C][/ROW]
[ROW][C]16[/C][C]0.04344[/C][C]0.366[/C][C]0.357716[/C][/ROW]
[ROW][C]17[/C][C]0.098472[/C][C]0.8297[/C][C]0.204732[/C][/ROW]
[ROW][C]18[/C][C]-0.19534[/C][C]-1.646[/C][C]0.052096[/C][/ROW]
[ROW][C]19[/C][C]0.060308[/C][C]0.5082[/C][C]0.306456[/C][/ROW]
[ROW][C]20[/C][C]0.109789[/C][C]0.9251[/C][C]0.179024[/C][/ROW]
[ROW][C]21[/C][C]-0.095292[/C][C]-0.8029[/C][C]0.212343[/C][/ROW]
[ROW][C]22[/C][C]0.101621[/C][C]0.8563[/C][C]0.197364[/C][/ROW]
[ROW][C]23[/C][C]-0.395631[/C][C]-3.3336[/C][C]0.000682[/C][/ROW]
[ROW][C]24[/C][C]0.545878[/C][C]4.5997[/C][C]9e-06[/C][/ROW]
[ROW][C]25[/C][C]-0.303483[/C][C]-2.5572[/C][C]0.006345[/C][/ROW]
[ROW][C]26[/C][C]0.055637[/C][C]0.4688[/C][C]0.320321[/C][/ROW]
[ROW][C]27[/C][C]-0.046126[/C][C]-0.3887[/C][C]0.349343[/C][/ROW]
[ROW][C]28[/C][C]0.039196[/C][C]0.3303[/C][C]0.371083[/C][/ROW]
[ROW][C]29[/C][C]0.083448[/C][C]0.7031[/C][C]0.242132[/C][/ROW]
[ROW][C]30[/C][C]-0.161286[/C][C]-1.359[/C][C]0.089221[/C][/ROW]
[ROW][C]31[/C][C]0.056896[/C][C]0.4794[/C][C]0.31656[/C][/ROW]
[ROW][C]32[/C][C]0.082794[/C][C]0.6976[/C][C]0.243842[/C][/ROW]
[ROW][C]33[/C][C]-0.072737[/C][C]-0.6129[/C][C]0.270952[/C][/ROW]
[ROW][C]34[/C][C]0.103125[/C][C]0.8689[/C][C]0.193902[/C][/ROW]
[ROW][C]35[/C][C]-0.322902[/C][C]-2.7208[/C][C]0.004092[/C][/ROW]
[ROW][C]36[/C][C]0.433066[/C][C]3.6491[/C][C]0.000249[/C][/ROW]
[ROW][C]37[/C][C]-0.232656[/C][C]-1.9604[/C][C]0.026937[/C][/ROW]
[ROW][C]38[/C][C]0.057896[/C][C]0.4878[/C][C]0.313582[/C][/ROW]
[ROW][C]39[/C][C]-0.032324[/C][C]-0.2724[/C][C]0.393064[/C][/ROW]
[ROW][C]40[/C][C]0.020142[/C][C]0.1697[/C][C]0.432858[/C][/ROW]
[ROW][C]41[/C][C]0.062502[/C][C]0.5267[/C][C]0.300038[/C][/ROW]
[ROW][C]42[/C][C]-0.12475[/C][C]-1.0512[/C][C]0.148375[/C][/ROW]
[ROW][C]43[/C][C]0.052345[/C][C]0.4411[/C][C]0.330251[/C][/ROW]
[ROW][C]44[/C][C]0.054648[/C][C]0.4605[/C][C]0.323293[/C][/ROW]
[ROW][C]45[/C][C]-0.070764[/C][C]-0.5963[/C][C]0.276447[/C][/ROW]
[ROW][C]46[/C][C]0.111985[/C][C]0.9436[/C][C]0.174287[/C][/ROW]
[ROW][C]47[/C][C]-0.269073[/C][C]-2.2673[/C][C]0.013211[/C][/ROW]
[ROW][C]48[/C][C]0.275837[/C][C]2.3242[/C][C]0.011489[/C][/ROW]
[/TABLE]
Source: https://freestatistics.org/blog/index.php?pk=208763&T=1

Globally Unique Identifier (entire table): ba.freestatistics.org/blog/index.php?pk=208763&T=1

As an alternative you can also use a QR Code:  

The GUIDs for individual cells are displayed in the table below:

Autocorrelation Function
Time lag kACF(k)T-STATP-value
1-0.561793-4.73385e-06
20.104220.87820.191406
3-0.074129-0.62460.26711
40.0759220.63970.262202
50.122241.030.153249
6-0.252028-2.12360.018594
70.1098830.92590.17882
80.1009040.85020.199028
9-0.097619-0.82260.206758
100.1284081.0820.14146
11-0.538659-4.53881.1e-05
120.7593896.39870
13-0.409459-3.45020.000473
140.0606410.5110.30548
15-0.04338-0.36550.357902
160.043440.3660.357716
170.0984720.82970.204732
18-0.19534-1.6460.052096
190.0603080.50820.306456
200.1097890.92510.179024
21-0.095292-0.80290.212343
220.1016210.85630.197364
23-0.395631-3.33360.000682
240.5458784.59979e-06
25-0.303483-2.55720.006345
260.0556370.46880.320321
27-0.046126-0.38870.349343
280.0391960.33030.371083
290.0834480.70310.242132
30-0.161286-1.3590.089221
310.0568960.47940.31656
320.0827940.69760.243842
33-0.072737-0.61290.270952
340.1031250.86890.193902
35-0.322902-2.72080.004092
360.4330663.64910.000249
37-0.232656-1.96040.026937
380.0578960.48780.313582
39-0.032324-0.27240.393064
400.0201420.16970.432858
410.0625020.52670.300038
42-0.12475-1.05120.148375
430.0523450.44110.330251
440.0546480.46050.323293
45-0.070764-0.59630.276447
460.1119850.94360.174287
47-0.269073-2.26730.013211
480.2758372.32420.011489


Partial Autocorrelation Function
Time lag kPACF(k)T-STATP-value
1-0.561793-4.73385e-06
2-0.308876-2.60260.005627
3-0.27624-2.32760.011393
4-0.151683-1.27810.102688
50.1799981.51670.066893
6-0.058682-0.49450.311252
7-0.110719-0.93290.177007
80.1269361.06960.144216
90.0375670.31650.376259
100.2195461.84990.034243
11-0.60553-5.10231e-06
120.2505442.11110.019142
130.0952350.80250.212481
14-0.01059-0.08920.464575
150.0086680.0730.47099
160.0042140.03550.485889
17-0.109267-0.92070.180162
180.0246520.20770.41802
190.004010.03380.48657
20-0.038084-0.32090.374615
21-0.011132-0.09380.462766
22-0.200345-1.68810.047887
230.0285830.24080.405186
240.0175320.14770.441489
25-0.064807-0.54610.293365
260.0270650.22810.410129
27-0.048032-0.40470.343447
28-0.078312-0.65990.255736
290.03990.33620.368855
30-0.0387-0.32610.372656
310.0200410.16890.433189
32-0.011358-0.09570.462014
33-0.091045-0.76720.222766
340.0816910.68830.246741
35-0.028508-0.24020.405428
360.0121640.10250.459326
370.0877510.73940.23105
380.0060330.05080.4798
390.0485770.40930.341769
400.0678050.57130.284788
41-0.094638-0.79740.213929
420.0131920.11120.455902
430.0009080.00770.496957
44-0.075989-0.64030.262022
450.020840.17560.430554
46-0.029694-0.25020.401577
470.0067430.05680.477427
48-0.138932-1.17070.122825

\begin{tabular}{lllllllll}
\hline
Partial Autocorrelation Function \tabularnewline
Time lag k & PACF(k) & T-STAT & P-value \tabularnewline
1 & -0.561793 & -4.7338 & 5e-06 \tabularnewline
2 & -0.308876 & -2.6026 & 0.005627 \tabularnewline
3 & -0.27624 & -2.3276 & 0.011393 \tabularnewline
4 & -0.151683 & -1.2781 & 0.102688 \tabularnewline
5 & 0.179998 & 1.5167 & 0.066893 \tabularnewline
6 & -0.058682 & -0.4945 & 0.311252 \tabularnewline
7 & -0.110719 & -0.9329 & 0.177007 \tabularnewline
8 & 0.126936 & 1.0696 & 0.144216 \tabularnewline
9 & 0.037567 & 0.3165 & 0.376259 \tabularnewline
10 & 0.219546 & 1.8499 & 0.034243 \tabularnewline
11 & -0.60553 & -5.1023 & 1e-06 \tabularnewline
12 & 0.250544 & 2.1111 & 0.019142 \tabularnewline
13 & 0.095235 & 0.8025 & 0.212481 \tabularnewline
14 & -0.01059 & -0.0892 & 0.464575 \tabularnewline
15 & 0.008668 & 0.073 & 0.47099 \tabularnewline
16 & 0.004214 & 0.0355 & 0.485889 \tabularnewline
17 & -0.109267 & -0.9207 & 0.180162 \tabularnewline
18 & 0.024652 & 0.2077 & 0.41802 \tabularnewline
19 & 0.00401 & 0.0338 & 0.48657 \tabularnewline
20 & -0.038084 & -0.3209 & 0.374615 \tabularnewline
21 & -0.011132 & -0.0938 & 0.462766 \tabularnewline
22 & -0.200345 & -1.6881 & 0.047887 \tabularnewline
23 & 0.028583 & 0.2408 & 0.405186 \tabularnewline
24 & 0.017532 & 0.1477 & 0.441489 \tabularnewline
25 & -0.064807 & -0.5461 & 0.293365 \tabularnewline
26 & 0.027065 & 0.2281 & 0.410129 \tabularnewline
27 & -0.048032 & -0.4047 & 0.343447 \tabularnewline
28 & -0.078312 & -0.6599 & 0.255736 \tabularnewline
29 & 0.0399 & 0.3362 & 0.368855 \tabularnewline
30 & -0.0387 & -0.3261 & 0.372656 \tabularnewline
31 & 0.020041 & 0.1689 & 0.433189 \tabularnewline
32 & -0.011358 & -0.0957 & 0.462014 \tabularnewline
33 & -0.091045 & -0.7672 & 0.222766 \tabularnewline
34 & 0.081691 & 0.6883 & 0.246741 \tabularnewline
35 & -0.028508 & -0.2402 & 0.405428 \tabularnewline
36 & 0.012164 & 0.1025 & 0.459326 \tabularnewline
37 & 0.087751 & 0.7394 & 0.23105 \tabularnewline
38 & 0.006033 & 0.0508 & 0.4798 \tabularnewline
39 & 0.048577 & 0.4093 & 0.341769 \tabularnewline
40 & 0.067805 & 0.5713 & 0.284788 \tabularnewline
41 & -0.094638 & -0.7974 & 0.213929 \tabularnewline
42 & 0.013192 & 0.1112 & 0.455902 \tabularnewline
43 & 0.000908 & 0.0077 & 0.496957 \tabularnewline
44 & -0.075989 & -0.6403 & 0.262022 \tabularnewline
45 & 0.02084 & 0.1756 & 0.430554 \tabularnewline
46 & -0.029694 & -0.2502 & 0.401577 \tabularnewline
47 & 0.006743 & 0.0568 & 0.477427 \tabularnewline
48 & -0.138932 & -1.1707 & 0.122825 \tabularnewline
\hline
\end{tabular}
%Source: https://freestatistics.org/blog/index.php?pk=208763&T=2

[TABLE]
[ROW][C]Partial Autocorrelation Function[/C][/ROW]
[ROW][C]Time lag k[/C][C]PACF(k)[/C][C]T-STAT[/C][C]P-value[/C][/ROW]
[ROW][C]1[/C][C]-0.561793[/C][C]-4.7338[/C][C]5e-06[/C][/ROW]
[ROW][C]2[/C][C]-0.308876[/C][C]-2.6026[/C][C]0.005627[/C][/ROW]
[ROW][C]3[/C][C]-0.27624[/C][C]-2.3276[/C][C]0.011393[/C][/ROW]
[ROW][C]4[/C][C]-0.151683[/C][C]-1.2781[/C][C]0.102688[/C][/ROW]
[ROW][C]5[/C][C]0.179998[/C][C]1.5167[/C][C]0.066893[/C][/ROW]
[ROW][C]6[/C][C]-0.058682[/C][C]-0.4945[/C][C]0.311252[/C][/ROW]
[ROW][C]7[/C][C]-0.110719[/C][C]-0.9329[/C][C]0.177007[/C][/ROW]
[ROW][C]8[/C][C]0.126936[/C][C]1.0696[/C][C]0.144216[/C][/ROW]
[ROW][C]9[/C][C]0.037567[/C][C]0.3165[/C][C]0.376259[/C][/ROW]
[ROW][C]10[/C][C]0.219546[/C][C]1.8499[/C][C]0.034243[/C][/ROW]
[ROW][C]11[/C][C]-0.60553[/C][C]-5.1023[/C][C]1e-06[/C][/ROW]
[ROW][C]12[/C][C]0.250544[/C][C]2.1111[/C][C]0.019142[/C][/ROW]
[ROW][C]13[/C][C]0.095235[/C][C]0.8025[/C][C]0.212481[/C][/ROW]
[ROW][C]14[/C][C]-0.01059[/C][C]-0.0892[/C][C]0.464575[/C][/ROW]
[ROW][C]15[/C][C]0.008668[/C][C]0.073[/C][C]0.47099[/C][/ROW]
[ROW][C]16[/C][C]0.004214[/C][C]0.0355[/C][C]0.485889[/C][/ROW]
[ROW][C]17[/C][C]-0.109267[/C][C]-0.9207[/C][C]0.180162[/C][/ROW]
[ROW][C]18[/C][C]0.024652[/C][C]0.2077[/C][C]0.41802[/C][/ROW]
[ROW][C]19[/C][C]0.00401[/C][C]0.0338[/C][C]0.48657[/C][/ROW]
[ROW][C]20[/C][C]-0.038084[/C][C]-0.3209[/C][C]0.374615[/C][/ROW]
[ROW][C]21[/C][C]-0.011132[/C][C]-0.0938[/C][C]0.462766[/C][/ROW]
[ROW][C]22[/C][C]-0.200345[/C][C]-1.6881[/C][C]0.047887[/C][/ROW]
[ROW][C]23[/C][C]0.028583[/C][C]0.2408[/C][C]0.405186[/C][/ROW]
[ROW][C]24[/C][C]0.017532[/C][C]0.1477[/C][C]0.441489[/C][/ROW]
[ROW][C]25[/C][C]-0.064807[/C][C]-0.5461[/C][C]0.293365[/C][/ROW]
[ROW][C]26[/C][C]0.027065[/C][C]0.2281[/C][C]0.410129[/C][/ROW]
[ROW][C]27[/C][C]-0.048032[/C][C]-0.4047[/C][C]0.343447[/C][/ROW]
[ROW][C]28[/C][C]-0.078312[/C][C]-0.6599[/C][C]0.255736[/C][/ROW]
[ROW][C]29[/C][C]0.0399[/C][C]0.3362[/C][C]0.368855[/C][/ROW]
[ROW][C]30[/C][C]-0.0387[/C][C]-0.3261[/C][C]0.372656[/C][/ROW]
[ROW][C]31[/C][C]0.020041[/C][C]0.1689[/C][C]0.433189[/C][/ROW]
[ROW][C]32[/C][C]-0.011358[/C][C]-0.0957[/C][C]0.462014[/C][/ROW]
[ROW][C]33[/C][C]-0.091045[/C][C]-0.7672[/C][C]0.222766[/C][/ROW]
[ROW][C]34[/C][C]0.081691[/C][C]0.6883[/C][C]0.246741[/C][/ROW]
[ROW][C]35[/C][C]-0.028508[/C][C]-0.2402[/C][C]0.405428[/C][/ROW]
[ROW][C]36[/C][C]0.012164[/C][C]0.1025[/C][C]0.459326[/C][/ROW]
[ROW][C]37[/C][C]0.087751[/C][C]0.7394[/C][C]0.23105[/C][/ROW]
[ROW][C]38[/C][C]0.006033[/C][C]0.0508[/C][C]0.4798[/C][/ROW]
[ROW][C]39[/C][C]0.048577[/C][C]0.4093[/C][C]0.341769[/C][/ROW]
[ROW][C]40[/C][C]0.067805[/C][C]0.5713[/C][C]0.284788[/C][/ROW]
[ROW][C]41[/C][C]-0.094638[/C][C]-0.7974[/C][C]0.213929[/C][/ROW]
[ROW][C]42[/C][C]0.013192[/C][C]0.1112[/C][C]0.455902[/C][/ROW]
[ROW][C]43[/C][C]0.000908[/C][C]0.0077[/C][C]0.496957[/C][/ROW]
[ROW][C]44[/C][C]-0.075989[/C][C]-0.6403[/C][C]0.262022[/C][/ROW]
[ROW][C]45[/C][C]0.02084[/C][C]0.1756[/C][C]0.430554[/C][/ROW]
[ROW][C]46[/C][C]-0.029694[/C][C]-0.2502[/C][C]0.401577[/C][/ROW]
[ROW][C]47[/C][C]0.006743[/C][C]0.0568[/C][C]0.477427[/C][/ROW]
[ROW][C]48[/C][C]-0.138932[/C][C]-1.1707[/C][C]0.122825[/C][/ROW]
[/TABLE]
Source: https://freestatistics.org/blog/index.php?pk=208763&T=2

Globally Unique Identifier (entire table): ba.freestatistics.org/blog/index.php?pk=208763&T=2

As an alternative you can also use a QR Code:  

The GUIDs for individual cells are displayed in the table below:

Partial Autocorrelation Function
Time lag kPACF(k)T-STATP-value
1-0.561793-4.73385e-06
2-0.308876-2.60260.005627
3-0.27624-2.32760.011393
4-0.151683-1.27810.102688
50.1799981.51670.066893
6-0.058682-0.49450.311252
7-0.110719-0.93290.177007
80.1269361.06960.144216
90.0375670.31650.376259
100.2195461.84990.034243
11-0.60553-5.10231e-06
120.2505442.11110.019142
130.0952350.80250.212481
14-0.01059-0.08920.464575
150.0086680.0730.47099
160.0042140.03550.485889
17-0.109267-0.92070.180162
180.0246520.20770.41802
190.004010.03380.48657
20-0.038084-0.32090.374615
21-0.011132-0.09380.462766
22-0.200345-1.68810.047887
230.0285830.24080.405186
240.0175320.14770.441489
25-0.064807-0.54610.293365
260.0270650.22810.410129
27-0.048032-0.40470.343447
28-0.078312-0.65990.255736
290.03990.33620.368855
30-0.0387-0.32610.372656
310.0200410.16890.433189
32-0.011358-0.09570.462014
33-0.091045-0.76720.222766
340.0816910.68830.246741
35-0.028508-0.24020.405428
360.0121640.10250.459326
370.0877510.73940.23105
380.0060330.05080.4798
390.0485770.40930.341769
400.0678050.57130.284788
41-0.094638-0.79740.213929
420.0131920.11120.455902
430.0009080.00770.496957
44-0.075989-0.64030.262022
450.020840.17560.430554
46-0.029694-0.25020.401577
470.0067430.05680.477427
48-0.138932-1.17070.122825


Parameters (Session):
par1 = 48 ; par2 = 1 ; par3 = 1 ; par4 = 0 ; par5 = 12 ; par6 = White Noise ; par7 = 0.95 ;
Parameters (R input):
par1 = 48 ; par2 = 1 ; par3 = 1 ; par4 = 0 ; par5 = 12 ; par6 = White Noise ; par7 = 0.95 ; par8 = ;
R code (references can be found in the software module):
par8 <- ''
par7 <- '0.95'
par6 <- 'White Noise'
par5 <- '12'
par4 <- '0'
par3 <- '0'
par2 <- '1'
par1 <- '48'
if (par1 == 'Default') {
par1 = 10*log10(length(x))
} else {
par1 <- as.numeric(par1)
}
par2 <- as.numeric(par2)
par3 <- as.numeric(par3)
par4 <- as.numeric(par4)
par5 <- as.numeric(par5)
if (par6 == 'White Noise') par6 <- 'white' else par6 <- 'ma'
par7 <- as.numeric(par7)
if (par8 != '') par8 <- as.numeric(par8)
ox <- x
if (par8 == '') {
if (par2 == 0) {
x <- log(x)
} else {
x <- (x ^ par2 - 1) / par2
}
} else {
x <- log(x,base=par8)
}
if (par3 > 0) x <- diff(x,lag=1,difference=par3)
if (par4 > 0) x <- diff(x,lag=par5,difference=par4)
bitmap(file='picts.png')
op <- par(mfrow=c(2,1))
plot(ox,type='l',main='Original Time Series',xlab='time',ylab='value')
if (par8=='') {
mytitle <- paste('Working Time Series (lambda=',par2,', d=',par3,', D=',par4,')',sep='')
mysub <- paste('(lambda=',par2,', d=',par3,', D=',par4,', CI=', par7, ', CI type=',par6,')',sep='')
} else {
mytitle <- paste('Working Time Series (base=',par8,', d=',par3,', D=',par4,')',sep='')
mysub <- paste('(base=',par8,', d=',par3,', D=',par4,', CI=', par7, ', CI type=',par6,')',sep='')
}
plot(x,type='l', main=mytitle,xlab='time',ylab='value')
par(op)
dev.off()
bitmap(file='pic1.png')
racf <- acf(x, par1, main='Autocorrelation', xlab='time lag', ylab='ACF', ci.type=par6, ci=par7, sub=mysub)
dev.off()
bitmap(file='pic2.png')
rpacf <- pacf(x,par1,main='Partial Autocorrelation',xlab='lags',ylab='PACF',sub=mysub)
dev.off()
(myacf <- c(racf$acf))
(mypacf <- c(rpacf$acf))
lengthx <- length(x)
sqrtn <- sqrt(lengthx)
load(file='createtable')
a<-table.start()
a<-table.row.start(a)
a<-table.element(a,'Autocorrelation Function',4,TRUE)
a<-table.row.end(a)
a<-table.row.start(a)
a<-table.element(a,'Time lag k',header=TRUE)
a<-table.element(a,hyperlink('basics.htm','ACF(k)','click here for more information about the Autocorrelation Function'),header=TRUE)
a<-table.element(a,'T-STAT',header=TRUE)
a<-table.element(a,'P-value',header=TRUE)
a<-table.row.end(a)
for (i in 2:(par1+1)) {
a<-table.row.start(a)
a<-table.element(a,i-1,header=TRUE)
a<-table.element(a,round(myacf[i],6))
mytstat <- myacf[i]*sqrtn
a<-table.element(a,round(mytstat,4))
a<-table.element(a,round(1-pt(abs(mytstat),lengthx),6))
a<-table.row.end(a)
}
a<-table.end(a)
table.save(a,file='mytable.tab')
a<-table.start()
a<-table.row.start(a)
a<-table.element(a,'Partial Autocorrelation Function',4,TRUE)
a<-table.row.end(a)
a<-table.row.start(a)
a<-table.element(a,'Time lag k',header=TRUE)
a<-table.element(a,hyperlink('basics.htm','PACF(k)','click here for more information about the Partial Autocorrelation Function'),header=TRUE)
a<-table.element(a,'T-STAT',header=TRUE)
a<-table.element(a,'P-value',header=TRUE)
a<-table.row.end(a)
for (i in 1:par1) {
a<-table.row.start(a)
a<-table.element(a,i,header=TRUE)
a<-table.element(a,round(mypacf[i],6))
mytstat <- mypacf[i]*sqrtn
a<-table.element(a,round(mytstat,4))
a<-table.element(a,round(1-pt(abs(mytstat),lengthx),6))
a<-table.row.end(a)
}
a<-table.end(a)
table.save(a,file='mytable1.tab')