Free Statistics
of Irreproducible Research!
Description of Statistical Computation | ||||||||||||||||||||||||||||||
|---|---|---|---|---|---|---|---|---|---|---|---|---|---|---|---|---|---|---|---|---|---|---|---|---|---|---|---|---|---|---|
| Author's title | ||||||||||||||||||||||||||||||
| Author | *The author of this computation has been verified* | |||||||||||||||||||||||||||||
| R Software Module | rwasp_Distributional Plots.wasp | |||||||||||||||||||||||||||||
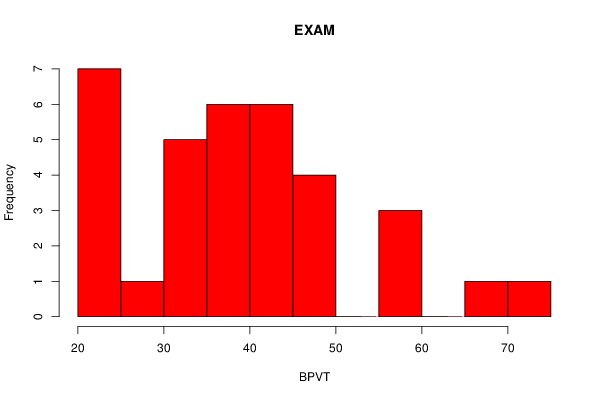
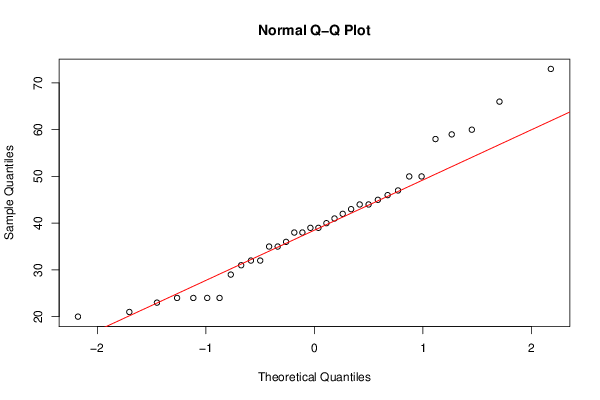
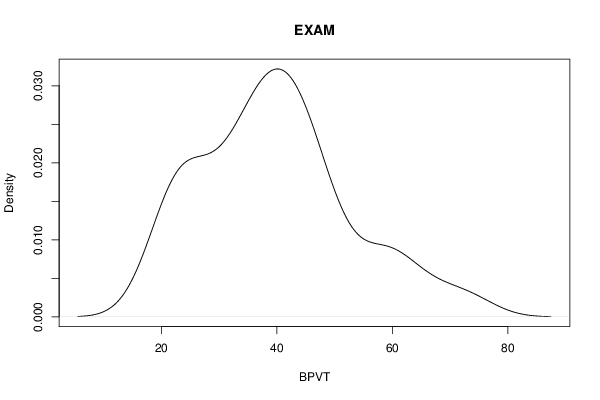
| Title produced by software | Histogram, QQplot and Density | |||||||||||||||||||||||||||||
| Date of computation | Tue, 21 May 2013 15:58:30 -0400 | |||||||||||||||||||||||||||||
| Cite this page as follows | Statistical Computations at FreeStatistics.org, Office for Research Development and Education, URL https://freestatistics.org/blog/index.php?v=date/2013/May/21/t1369166341z8njvc2fw4mo580.htm/, Retrieved Thu, 02 May 2024 12:28:59 +0000 | |||||||||||||||||||||||||||||
| Statistical Computations at FreeStatistics.org, Office for Research Development and Education, URL https://freestatistics.org/blog/index.php?pk=209286, Retrieved Thu, 02 May 2024 12:28:59 +0000 | ||||||||||||||||||||||||||||||
| QR Codes: | ||||||||||||||||||||||||||||||
|
| ||||||||||||||||||||||||||||||
| Original text written by user: | ||||||||||||||||||||||||||||||
| IsPrivate? | No (this computation is public) | |||||||||||||||||||||||||||||
| User-defined keywords | ||||||||||||||||||||||||||||||
| Estimated Impact | 77 | |||||||||||||||||||||||||||||
Tree of Dependent Computations | ||||||||||||||||||||||||||||||
| Family? (F = Feedback message, R = changed R code, M = changed R Module, P = changed Parameters, D = changed Data) | ||||||||||||||||||||||||||||||
| - [Simple Linear Regression] [RAD BPVT Regression] [2013-05-18 11:35:15] [98fd0e87c3eb04e0cc2efde01dbafab6] - RMPD [Histogram, QQplot and Density] [] [2013-05-21 19:58:30] [0b0dba78d6906383d09f0ee03b825a5b] [Current] | ||||||||||||||||||||||||||||||
| Feedback Forum | ||||||||||||||||||||||||||||||
Post a new message | ||||||||||||||||||||||||||||||
Dataset | ||||||||||||||||||||||||||||||
| Dataseries X: | ||||||||||||||||||||||||||||||
29 21 50 23 35 36 47 32 38 44 46 42 39 20 73 38 43 50 32 24 24 59 41 24 58 44 66 40 24 31 45 60 35 39 | ||||||||||||||||||||||||||||||
Tables (Output of Computation) | ||||||||||||||||||||||||||||||
| ||||||||||||||||||||||||||||||
Figures (Output of Computation) | ||||||||||||||||||||||||||||||
Input Parameters & R Code | ||||||||||||||||||||||||||||||
| Parameters (Session): | ||||||||||||||||||||||||||||||
| par1 = less ; par2 = 1 ; par3 = 2 ; par4 = T-Test ; par5 = unpaired ; par6 = 0.0 ; par7 = 0.95 ; par8 = TRUE ; | ||||||||||||||||||||||||||||||
| Parameters (R input): | ||||||||||||||||||||||||||||||
| par1 = 10 ; | ||||||||||||||||||||||||||||||
| R code (references can be found in the software module): | ||||||||||||||||||||||||||||||
x <- x[!is.na(x)] | ||||||||||||||||||||||||||||||