Free Statistics
of Irreproducible Research!
Description of Statistical Computation | |||||||||||||||||||||||||
|---|---|---|---|---|---|---|---|---|---|---|---|---|---|---|---|---|---|---|---|---|---|---|---|---|---|
| Author's title | |||||||||||||||||||||||||
| Author | *Unverified author* | ||||||||||||||||||||||||
| R Software Module | rwasp_sdplot.wasp | ||||||||||||||||||||||||
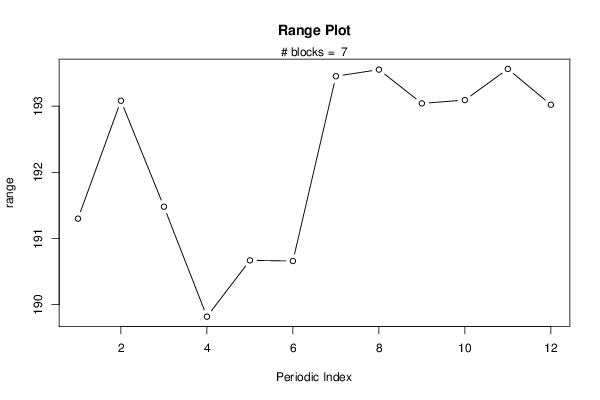
| Title produced by software | Standard Deviation Plot | ||||||||||||||||||||||||
| Date of computation | Sat, 25 May 2013 14:25:11 -0400 | ||||||||||||||||||||||||
| Cite this page as follows | Statistical Computations at FreeStatistics.org, Office for Research Development and Education, URL https://freestatistics.org/blog/index.php?v=date/2013/May/25/t1369506347fsysvgya0tjlb2g.htm/, Retrieved Thu, 02 May 2024 22:18:17 +0000 | ||||||||||||||||||||||||
| Statistical Computations at FreeStatistics.org, Office for Research Development and Education, URL https://freestatistics.org/blog/index.php?pk=210548, Retrieved Thu, 02 May 2024 22:18:17 +0000 | |||||||||||||||||||||||||
| QR Codes: | |||||||||||||||||||||||||
|
| |||||||||||||||||||||||||
| Original text written by user: | |||||||||||||||||||||||||
| IsPrivate? | No (this computation is public) | ||||||||||||||||||||||||
| User-defined keywords | |||||||||||||||||||||||||
| Estimated Impact | 67 | ||||||||||||||||||||||||
Tree of Dependent Computations | |||||||||||||||||||||||||
| Family? (F = Feedback message, R = changed R code, M = changed R Module, P = changed Parameters, D = changed Data) | |||||||||||||||||||||||||
| - [Standard Deviation Plot] [] [2013-05-25 18:25:11] [bda1405f45fc71f9cfac8f9f3e5dea22] [Current] | |||||||||||||||||||||||||
| Feedback Forum | |||||||||||||||||||||||||
Post a new message | |||||||||||||||||||||||||
Dataset | |||||||||||||||||||||||||
| Dataseries X: | |||||||||||||||||||||||||
120,6 119,9 119,48 117,45 118,37 117,07 114,98 112,59 111,7 112,04 110,79 110,79 109,82 109,11 109,84 109,31 108,29 107,42 106,71 105,11 104,43 105,11 104,43 105,55 106,12 105,78 105,33 104,63 104,62 105,57 107,5 107,52 107,76 106,74 106,21 105,77 105,27 104,35 103,52 102,28 100,93 101,04 99,95 99,55 99,56 99,01 98,64 98,98 100,8 100,32 100,72 280,8 280,4 280,4 280,3 281 280,9 279,7 283,1 290,6 291,6 291,7 291,8 291,7 291,5 291,7 293,4 293,1 292,6 292,1 292,2 292 292,1 293,4 292,2 292,1 291,6 290,9 290,9 290,8 290,5 290 290,2 290,1 | |||||||||||||||||||||||||
Tables (Output of Computation) | |||||||||||||||||||||||||
| |||||||||||||||||||||||||
Figures (Output of Computation) | |||||||||||||||||||||||||
Input Parameters & R Code | |||||||||||||||||||||||||
| Parameters (Session): | |||||||||||||||||||||||||
| par1 = 12 ; | |||||||||||||||||||||||||
| Parameters (R input): | |||||||||||||||||||||||||
| par1 = 12 ; | |||||||||||||||||||||||||
| R code (references can be found in the software module): | |||||||||||||||||||||||||
par1 <- as.numeric(par1) | |||||||||||||||||||||||||