Free Statistics

of Irreproducible Research!

Author's title

Author*Unverified author*
R Software Modulerwasp_twosampletests_mean.wasp
Title produced by softwarePaired and Unpaired Two Samples Tests about the Mean
Date of computationFri, 01 Nov 2013 17:30:20 -0400
Cite this page as followsStatistical Computations at FreeStatistics.org, Office for Research Development and Education, URL https://freestatistics.org/blog/index.php?v=date/2013/Nov/01/t1383342068r7c0ttqgczmygfd.htm/, Retrieved Mon, 29 Apr 2024 06:41:23 +0000
Statistical Computations at FreeStatistics.org, Office for Research Development and Education, URL https://freestatistics.org/blog/index.php?pk=221720, Retrieved Mon, 29 Apr 2024 06:41:23 +0000
QR Codes:

Original text written by user:
IsPrivate?No (this computation is public)
User-defined keywords
Estimated Impact55
Family? (F = Feedback message, R = changed R code, M = changed R Module, P = changed Parameters, D = changed Data)
-       [Paired and Unpaired Two Samples Tests about the Mean] [] [2013-11-01 21:30:20] [c258f27d31bac7c29f24436bc73a0b21] [Current]
Feedback Forum

Post a new message
Dataseries X:
58987856,120	44942851,780
22200509,400	51114646,772
50632268,368	2777207,566
17509460,320	37995371,498
18875537,457	17637213,595
16238483,496	77208823,856
37083270,836	22878477,938
58957430,634	13209990,380
17615360,627	27546948,302
15338592,208	10497804,428
57924863,630	37013819,338
48981537,260
45935987,523
21533386,919
22285123,234
64824345,086
21168774,205
52386211,904
43979764,583
42301947,814
38066037,224
26493078,291
44237870,722


Summary of computational transaction
Raw Inputview raw input (R code)
Raw Outputview raw output of R engine
Computing time4 seconds
R Server'Gertrude Mary Cox' @ cox.wessa.net

\begin{tabular}{lllllllll}
\hline
Summary of computational transaction \tabularnewline
Raw Input & view raw input (R code)  \tabularnewline
Raw Output & view raw output of R engine  \tabularnewline
Computing time & 4 seconds \tabularnewline
R Server & 'Gertrude Mary Cox' @ cox.wessa.net \tabularnewline
\hline
\end{tabular}
%Source: https://freestatistics.org/blog/index.php?pk=221720&T=0

[TABLE]
[ROW][C]Summary of computational transaction[/C][/ROW]
[ROW][C]Raw Input[/C][C]view raw input (R code) [/C][/ROW]
[ROW][C]Raw Output[/C][C]view raw output of R engine [/C][/ROW]
[ROW][C]Computing time[/C][C]4 seconds[/C][/ROW]
[ROW][C]R Server[/C][C]'Gertrude Mary Cox' @ cox.wessa.net[/C][/ROW]
[/TABLE]
Source: https://freestatistics.org/blog/index.php?pk=221720&T=0

Globally Unique Identifier (entire table): ba.freestatistics.org/blog/index.php?pk=221720&T=0

As an alternative you can also use a QR Code:  

The GUIDs for individual cells are displayed in the table below:

Summary of computational transaction
Raw Inputview raw input (R code)
Raw Outputview raw output of R engine
Computing time4 seconds
R Server'Gertrude Mary Cox' @ cox.wessa.net


Two Sample t-test (unpaired)
Mean of Sample 135318619.8056957
Mean of Sample 234355340.3483043
t-stat0.170319673610057
df44
p-value0.865539498760314
H0 value0
Alternativetwo.sided
CI Level0.95
CI[-10435064.2712312,12361623.1860138]
F-test to compare two variances
F-stat0.819036776364361
df22
p-value0.643724210919736
H0 value1
Alternativetwo.sided
CI Level0.95
CI[0.347361334015416,1.93119145784819]

\begin{tabular}{lllllllll}
\hline
Two Sample t-test (unpaired) \tabularnewline
Mean of Sample 1 & 35318619.8056957 \tabularnewline
Mean of Sample 2 & 34355340.3483043 \tabularnewline
t-stat & 0.170319673610057 \tabularnewline
df & 44 \tabularnewline
p-value & 0.865539498760314 \tabularnewline
H0 value & 0 \tabularnewline
Alternative & two.sided \tabularnewline
CI Level & 0.95 \tabularnewline
CI & [-10435064.2712312,12361623.1860138] \tabularnewline
F-test to compare two variances \tabularnewline
F-stat & 0.819036776364361 \tabularnewline
df & 22 \tabularnewline
p-value & 0.643724210919736 \tabularnewline
H0 value & 1 \tabularnewline
Alternative & two.sided \tabularnewline
CI Level & 0.95 \tabularnewline
CI & [0.347361334015416,1.93119145784819] \tabularnewline
\hline
\end{tabular}
%Source: https://freestatistics.org/blog/index.php?pk=221720&T=1

[TABLE]
[ROW][C]Two Sample t-test (unpaired)[/C][/ROW]
[ROW][C]Mean of Sample 1[/C][C]35318619.8056957[/C][/ROW]
[ROW][C]Mean of Sample 2[/C][C]34355340.3483043[/C][/ROW]
[ROW][C]t-stat[/C][C]0.170319673610057[/C][/ROW]
[ROW][C]df[/C][C]44[/C][/ROW]
[ROW][C]p-value[/C][C]0.865539498760314[/C][/ROW]
[ROW][C]H0 value[/C][C]0[/C][/ROW]
[ROW][C]Alternative[/C][C]two.sided[/C][/ROW]
[ROW][C]CI Level[/C][C]0.95[/C][/ROW]
[ROW][C]CI[/C][C][-10435064.2712312,12361623.1860138][/C][/ROW]
[ROW][C]F-test to compare two variances[/C][/ROW]
[ROW][C]F-stat[/C][C]0.819036776364361[/C][/ROW]
[ROW][C]df[/C][C]22[/C][/ROW]
[ROW][C]p-value[/C][C]0.643724210919736[/C][/ROW]
[ROW][C]H0 value[/C][C]1[/C][/ROW]
[ROW][C]Alternative[/C][C]two.sided[/C][/ROW]
[ROW][C]CI Level[/C][C]0.95[/C][/ROW]
[ROW][C]CI[/C][C][0.347361334015416,1.93119145784819][/C][/ROW]
[/TABLE]
Source: https://freestatistics.org/blog/index.php?pk=221720&T=1

Globally Unique Identifier (entire table): ba.freestatistics.org/blog/index.php?pk=221720&T=1

As an alternative you can also use a QR Code:  

The GUIDs for individual cells are displayed in the table below:

Two Sample t-test (unpaired)
Mean of Sample 135318619.8056957
Mean of Sample 234355340.3483043
t-stat0.170319673610057
df44
p-value0.865539498760314
H0 value0
Alternativetwo.sided
CI Level0.95
CI[-10435064.2712312,12361623.1860138]
F-test to compare two variances
F-stat0.819036776364361
df22
p-value0.643724210919736
H0 value1
Alternativetwo.sided
CI Level0.95
CI[0.347361334015416,1.93119145784819]


Welch Two Sample t-test (unpaired)
Mean of Sample 135318619.8056957
Mean of Sample 234355340.3483043
t-stat0.170319673610057
df43.5688053724156
p-value0.865547201902419
H0 value0
Alternativetwo.sided
CI Level0.95
CI[-10438251.3179994,12364810.232782]

\begin{tabular}{lllllllll}
\hline
Welch Two Sample t-test (unpaired) \tabularnewline
Mean of Sample 1 & 35318619.8056957 \tabularnewline
Mean of Sample 2 & 34355340.3483043 \tabularnewline
t-stat & 0.170319673610057 \tabularnewline
df & 43.5688053724156 \tabularnewline
p-value & 0.865547201902419 \tabularnewline
H0 value & 0 \tabularnewline
Alternative & two.sided \tabularnewline
CI Level & 0.95 \tabularnewline
CI & [-10438251.3179994,12364810.232782] \tabularnewline
\hline
\end{tabular}
%Source: https://freestatistics.org/blog/index.php?pk=221720&T=2

[TABLE]
[ROW][C]Welch Two Sample t-test (unpaired)[/C][/ROW]
[ROW][C]Mean of Sample 1[/C][C]35318619.8056957[/C][/ROW]
[ROW][C]Mean of Sample 2[/C][C]34355340.3483043[/C][/ROW]
[ROW][C]t-stat[/C][C]0.170319673610057[/C][/ROW]
[ROW][C]df[/C][C]43.5688053724156[/C][/ROW]
[ROW][C]p-value[/C][C]0.865547201902419[/C][/ROW]
[ROW][C]H0 value[/C][C]0[/C][/ROW]
[ROW][C]Alternative[/C][C]two.sided[/C][/ROW]
[ROW][C]CI Level[/C][C]0.95[/C][/ROW]
[ROW][C]CI[/C][C][-10438251.3179994,12364810.232782][/C][/ROW]
[/TABLE]
Source: https://freestatistics.org/blog/index.php?pk=221720&T=2

Globally Unique Identifier (entire table): ba.freestatistics.org/blog/index.php?pk=221720&T=2

As an alternative you can also use a QR Code:  

The GUIDs for individual cells are displayed in the table below:

Welch Two Sample t-test (unpaired)
Mean of Sample 135318619.8056957
Mean of Sample 234355340.3483043
t-stat0.170319673610057
df43.5688053724156
p-value0.865547201902419
H0 value0
Alternativetwo.sided
CI Level0.95
CI[-10438251.3179994,12364810.232782]


Wicoxon rank sum test with continuity correction (unpaired)
W274
p-value0.843204810118705
H0 value0
Alternativetwo.sided
Kolmogorov-Smirnov Test to compare Distributions of two Samples
KS Statistic0.217391304347826
p-value0.648725634664022
Kolmogorov-Smirnov Test to compare Distributional Shape of two Samples
KS Statistic0.217391304347826
p-value0.648725634664022

\begin{tabular}{lllllllll}
\hline
Wicoxon rank sum test with continuity correction (unpaired) \tabularnewline
W & 274 \tabularnewline
p-value & 0.843204810118705 \tabularnewline
H0 value & 0 \tabularnewline
Alternative & two.sided \tabularnewline
Kolmogorov-Smirnov Test to compare Distributions of two Samples \tabularnewline
KS Statistic & 0.217391304347826 \tabularnewline
p-value & 0.648725634664022 \tabularnewline
Kolmogorov-Smirnov Test to compare Distributional Shape of two Samples \tabularnewline
KS Statistic & 0.217391304347826 \tabularnewline
p-value & 0.648725634664022 \tabularnewline
\hline
\end{tabular}
%Source: https://freestatistics.org/blog/index.php?pk=221720&T=3

[TABLE]
[ROW][C]Wicoxon rank sum test with continuity correction (unpaired)[/C][/ROW]
[ROW][C]W[/C][C]274[/C][/ROW]
[ROW][C]p-value[/C][C]0.843204810118705[/C][/ROW]
[ROW][C]H0 value[/C][C]0[/C][/ROW]
[ROW][C]Alternative[/C][C]two.sided[/C][/ROW]
[ROW][C]Kolmogorov-Smirnov Test to compare Distributions of two Samples[/C][/ROW]
[ROW][C]KS Statistic[/C][C]0.217391304347826[/C][/ROW]
[ROW][C]p-value[/C][C]0.648725634664022[/C][/ROW]
[ROW][C]Kolmogorov-Smirnov Test to compare Distributional Shape of two Samples[/C][/ROW]
[ROW][C]KS Statistic[/C][C]0.217391304347826[/C][/ROW]
[ROW][C]p-value[/C][C]0.648725634664022[/C][/ROW]
[/TABLE]
Source: https://freestatistics.org/blog/index.php?pk=221720&T=3

Globally Unique Identifier (entire table): ba.freestatistics.org/blog/index.php?pk=221720&T=3

As an alternative you can also use a QR Code:  

The GUIDs for individual cells are displayed in the table below:

Wicoxon rank sum test with continuity correction (unpaired)
W274
p-value0.843204810118705
H0 value0
Alternativetwo.sided
Kolmogorov-Smirnov Test to compare Distributions of two Samples
KS Statistic0.217391304347826
p-value0.648725634664022
Kolmogorov-Smirnov Test to compare Distributional Shape of two Samples
KS Statistic0.217391304347826
p-value0.648725634664022


Parameters (Session):
par1 = two.sided ; par2 = 1 ; par3 = 2 ; par4 = Wilcoxon-Mann_Whitney ; par5 = unpaired ; par6 = 0.0 ; par7 = 0.95 ; par8 = TRUE ;
Parameters (R input):
par1 = 1 ; par2 = 2 ; par3 = 0.95 ; par4 = two.sided ; par5 = unpaired ; par6 = 0.0 ;
R code (references can be found in the software module):
par1 <- as.numeric(par1) #column number of first sample
par2 <- as.numeric(par2) #column number of second sample
par3 <- as.numeric(par3) #confidence (= 1 - alpha)
if (par5 == 'unpaired') paired <- FALSE else paired <- TRUE
par6 <- as.numeric(par6) #H0
z <- t(y)
if (par1 == par2) stop('Please, select two different column numbers')
if (par1 < 1) stop('Please, select a column number greater than zero for the first sample')
if (par2 < 1) stop('Please, select a column number greater than zero for the second sample')
if (par1 > length(z[1,])) stop('The column number for the first sample should be smaller')
if (par2 > length(z[1,])) stop('The column number for the second sample should be smaller')
if (par3 <= 0) stop('The confidence level should be larger than zero')
if (par3 >= 1) stop('The confidence level should be smaller than zero')
(r.t <- t.test(z[,par1],z[,par2],var.equal=TRUE,alternative=par4,paired=paired,mu=par6,conf.level=par3))
(v.t <- var.test(z[,par1],z[,par2],conf.level=par3))
(r.w <- t.test(z[,par1],z[,par2],var.equal=FALSE,alternative=par4,paired=paired,mu=par6,conf.level=par3))
(w.t <- wilcox.test(z[,par1],z[,par2],alternative=par4,paired=paired,mu=par6,conf.level=par3))
(ks.t <- ks.test(z[,par1],z[,par2],alternative=par4))
m1 <- mean(z[,par1],na.rm=T)
m2 <- mean(z[,par2],na.rm=T)
mdiff <- m1 - m2
newsam1 <- z[!is.na(z[,par1]),par1]
newsam2 <- z[,par2]+mdiff
newsam2 <- newsam2[!is.na(newsam2)]
(ks1.t <- ks.test(newsam1,newsam2,alternative=par4))
mydf <- data.frame(cbind(z[,par1],z[,par2]))
colnames(mydf) <- c('Variable 1','Variable 2')
bitmap(file='test1.png')
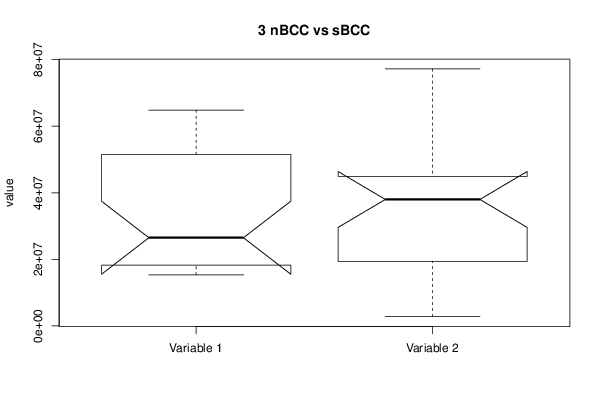
boxplot(mydf, notch=TRUE, ylab='value',main=main)
dev.off()
bitmap(file='test2.png')
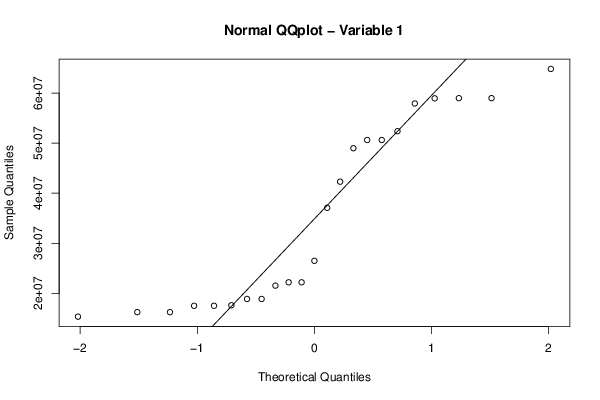
qqnorm(z[,par1],main='Normal QQplot - Variable 1')
qqline(z[,par1])
dev.off()
bitmap(file='test3.png')
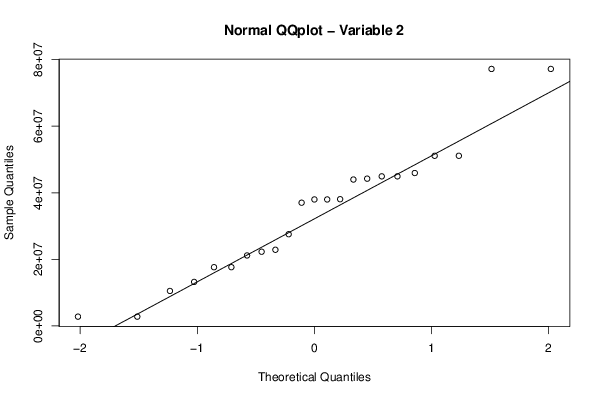
qqnorm(z[,par2],main='Normal QQplot - Variable 2')
qqline(z[,par2])
dev.off()
load(file='createtable')
a<-table.start()
a<-table.row.start(a)
a<-table.element(a,paste('Two Sample t-test (',par5,')',sep=''),2,TRUE)
a<-table.row.end(a)
if(!paired){
a<-table.row.start(a)
a<-table.element(a,'Mean of Sample 1',header=TRUE)
a<-table.element(a,r.t$estimate[[1]])
a<-table.row.end(a)
a<-table.row.start(a)
a<-table.element(a,'Mean of Sample 2',header=TRUE)
a<-table.element(a,r.t$estimate[[2]])
a<-table.row.end(a)
} else {
a<-table.row.start(a)
a<-table.element(a,'Difference: Mean1 - Mean2',header=TRUE)
a<-table.element(a,r.t$estimate)
a<-table.row.end(a)
}
a<-table.row.start(a)
a<-table.element(a,'t-stat',header=TRUE)
a<-table.element(a,r.t$statistic[[1]])
a<-table.row.end(a)
a<-table.row.start(a)
a<-table.element(a,'df',header=TRUE)
a<-table.element(a,r.t$parameter[[1]])
a<-table.row.end(a)
a<-table.row.start(a)
a<-table.element(a,'p-value',header=TRUE)
a<-table.element(a,r.t$p.value)
a<-table.row.end(a)
a<-table.row.start(a)
a<-table.element(a,'H0 value',header=TRUE)
a<-table.element(a,r.t$null.value[[1]])
a<-table.row.end(a)
a<-table.row.start(a)
a<-table.element(a,'Alternative',header=TRUE)
a<-table.element(a,r.t$alternative)
a<-table.row.end(a)
a<-table.row.start(a)
a<-table.element(a,'CI Level',header=TRUE)
a<-table.element(a,attr(r.t$conf.int,'conf.level'))
a<-table.row.end(a)
a<-table.row.start(a)
a<-table.element(a,'CI',header=TRUE)
a<-table.element(a,paste('[',r.t$conf.int[1],',',r.t$conf.int[2],']',sep=''))
a<-table.row.end(a)
a<-table.row.start(a)
a<-table.element(a,'F-test to compare two variances',2,TRUE)
a<-table.row.end(a)
a<-table.row.start(a)
a<-table.element(a,'F-stat',header=TRUE)
a<-table.element(a,v.t$statistic[[1]])
a<-table.row.end(a)
a<-table.row.start(a)
a<-table.element(a,'df',header=TRUE)
a<-table.element(a,v.t$parameter[[1]])
a<-table.row.end(a)
a<-table.row.start(a)
a<-table.element(a,'p-value',header=TRUE)
a<-table.element(a,v.t$p.value)
a<-table.row.end(a)
a<-table.row.start(a)
a<-table.element(a,'H0 value',header=TRUE)
a<-table.element(a,v.t$null.value[[1]])
a<-table.row.end(a)
a<-table.row.start(a)
a<-table.element(a,'Alternative',header=TRUE)
a<-table.element(a,v.t$alternative)
a<-table.row.end(a)
a<-table.row.start(a)
a<-table.element(a,'CI Level',header=TRUE)
a<-table.element(a,attr(v.t$conf.int,'conf.level'))
a<-table.row.end(a)
a<-table.row.start(a)
a<-table.element(a,'CI',header=TRUE)
a<-table.element(a,paste('[',v.t$conf.int[1],',',v.t$conf.int[2],']',sep=''))
a<-table.row.end(a)
a<-table.end(a)
table.save(a,file='mytable.tab')
a<-table.start()
a<-table.row.start(a)
a<-table.element(a,paste('Welch Two Sample t-test (',par5,')',sep=''),2,TRUE)
a<-table.row.end(a)
if(!paired){
a<-table.row.start(a)
a<-table.element(a,'Mean of Sample 1',header=TRUE)
a<-table.element(a,r.w$estimate[[1]])
a<-table.row.end(a)
a<-table.row.start(a)
a<-table.element(a,'Mean of Sample 2',header=TRUE)
a<-table.element(a,r.w$estimate[[2]])
a<-table.row.end(a)
} else {
a<-table.row.start(a)
a<-table.element(a,'Difference: Mean1 - Mean2',header=TRUE)
a<-table.element(a,r.w$estimate)
a<-table.row.end(a)
}
a<-table.row.start(a)
a<-table.element(a,'t-stat',header=TRUE)
a<-table.element(a,r.w$statistic[[1]])
a<-table.row.end(a)
a<-table.row.start(a)
a<-table.element(a,'df',header=TRUE)
a<-table.element(a,r.w$parameter[[1]])
a<-table.row.end(a)
a<-table.row.start(a)
a<-table.element(a,'p-value',header=TRUE)
a<-table.element(a,r.w$p.value)
a<-table.row.end(a)
a<-table.row.start(a)
a<-table.element(a,'H0 value',header=TRUE)
a<-table.element(a,r.w$null.value[[1]])
a<-table.row.end(a)
a<-table.row.start(a)
a<-table.element(a,'Alternative',header=TRUE)
a<-table.element(a,r.w$alternative)
a<-table.row.end(a)
a<-table.row.start(a)
a<-table.element(a,'CI Level',header=TRUE)
a<-table.element(a,attr(r.w$conf.int,'conf.level'))
a<-table.row.end(a)
a<-table.row.start(a)
a<-table.element(a,'CI',header=TRUE)
a<-table.element(a,paste('[',r.w$conf.int[1],',',r.w$conf.int[2],']',sep=''))
a<-table.row.end(a)
a<-table.end(a)
table.save(a,file='mytable1.tab')
a<-table.start()
a<-table.row.start(a)
a<-table.element(a,paste('Wicoxon rank sum test with continuity correction (',par5,')',sep=''),2,TRUE)
a<-table.row.end(a)
a<-table.row.start(a)
a<-table.element(a,'W',header=TRUE)
a<-table.element(a,w.t$statistic[[1]])
a<-table.row.end(a)
a<-table.row.start(a)
a<-table.element(a,'p-value',header=TRUE)
a<-table.element(a,w.t$p.value)
a<-table.row.end(a)
a<-table.row.start(a)
a<-table.element(a,'H0 value',header=TRUE)
a<-table.element(a,w.t$null.value[[1]])
a<-table.row.end(a)
a<-table.row.start(a)
a<-table.element(a,'Alternative',header=TRUE)
a<-table.element(a,w.t$alternative)
a<-table.row.end(a)
a<-table.row.start(a)
a<-table.element(a,'Kolmogorov-Smirnov Test to compare Distributions of two Samples',2,TRUE)
a<-table.row.end(a)
a<-table.row.start(a)
a<-table.element(a,'KS Statistic',header=TRUE)
a<-table.element(a,ks.t$statistic[[1]])
a<-table.row.end(a)
a<-table.row.start(a)
a<-table.element(a,'p-value',header=TRUE)
a<-table.element(a,ks.t$p.value)
a<-table.row.end(a)
a<-table.row.start(a)
a<-table.element(a,'Kolmogorov-Smirnov Test to compare Distributional Shape of two Samples',2,TRUE)
a<-table.row.end(a)
a<-table.row.start(a)
a<-table.element(a,'KS Statistic',header=TRUE)
a<-table.element(a,ks1.t$statistic[[1]])
a<-table.row.end(a)
a<-table.row.start(a)
a<-table.element(a,'p-value',header=TRUE)
a<-table.element(a,ks1.t$p.value)
a<-table.row.end(a)
a<-table.end(a)
table.save(a,file='mytable2.tab')