Free Statistics

of Irreproducible Research!

Author's title

Author*Unverified author*
R Software Modulerwasp_autocorrelation.wasp
Title produced by software(Partial) Autocorrelation Function
Date of computationSat, 16 Nov 2013 11:42:46 -0500
Cite this page as followsStatistical Computations at FreeStatistics.org, Office for Research Development and Education, URL https://freestatistics.org/blog/index.php?v=date/2013/Nov/16/t13846202131yviwxoq07vxsq3.htm/, Retrieved Sun, 05 May 2024 23:58:23 +0000
Statistical Computations at FreeStatistics.org, Office for Research Development and Education, URL https://freestatistics.org/blog/index.php?pk=225614, Retrieved Sun, 05 May 2024 23:58:23 +0000
QR Codes:

Original text written by user:
IsPrivate?No (this computation is public)
User-defined keywords
Estimated Impact72
Family? (F = Feedback message, R = changed R code, M = changed R Module, P = changed Parameters, D = changed Data)
-     [Mean Plot] [] [2013-11-16 16:36:38] [c293b431f74b4a1cfea60fdc58430002]
- RMPD    [(Partial) Autocorrelation Function] [] [2013-11-16 16:42:46] [f3f79c2d34893fd5bed45dfee56f0880] [Current]
Feedback Forum

Post a new message
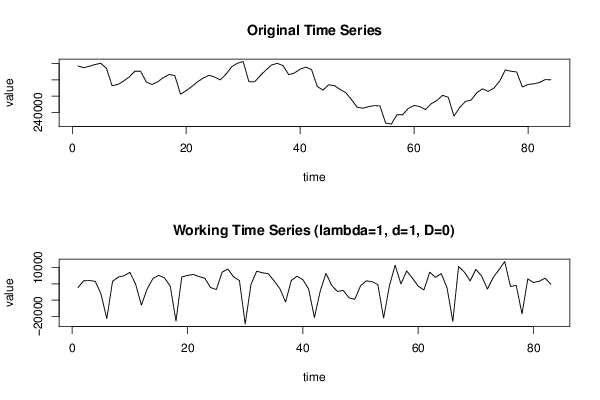
Dataseries X:
297295
295008
296917
298982
300562
294292
272817
274405
278601
283654
290770
290604
277466
274371
277686
282917
286692
285378
262433
266730
271980
277799
282329
285775
283495
279998
287224
296369
300653
302686
277891
277537
285383
292213
298522
300431
297584
286445
288576
293299
295881
292710
271993
267430
273963
273046
268347
264319
255765
246263
245098
246969
248333
247934
226839
225554
237085
237080
245039
248541
247105
243422
250643
254663
260993
258556
235372
246057
253353
255198
264176
269034
265861
269826
278506
292300
290726
289802
271311
274352
275216
276836
280408
280190


Summary of computational transaction
Raw Inputview raw input (R code)
Raw Outputview raw output of R engine
Computing time3 seconds
R Server'Sir Ronald Aylmer Fisher' @ fisher.wessa.net

\begin{tabular}{lllllllll}
\hline
Summary of computational transaction \tabularnewline
Raw Input & view raw input (R code)  \tabularnewline
Raw Output & view raw output of R engine  \tabularnewline
Computing time & 3 seconds \tabularnewline
R Server & 'Sir Ronald Aylmer Fisher' @ fisher.wessa.net \tabularnewline
\hline
\end{tabular}
%Source: https://freestatistics.org/blog/index.php?pk=225614&T=0

[TABLE]
[ROW][C]Summary of computational transaction[/C][/ROW]
[ROW][C]Raw Input[/C][C]view raw input (R code) [/C][/ROW]
[ROW][C]Raw Output[/C][C]view raw output of R engine [/C][/ROW]
[ROW][C]Computing time[/C][C]3 seconds[/C][/ROW]
[ROW][C]R Server[/C][C]'Sir Ronald Aylmer Fisher' @ fisher.wessa.net[/C][/ROW]
[/TABLE]
Source: https://freestatistics.org/blog/index.php?pk=225614&T=0

Globally Unique Identifier (entire table): ba.freestatistics.org/blog/index.php?pk=225614&T=0

As an alternative you can also use a QR Code:  

The GUIDs for individual cells are displayed in the table below:

Summary of computational transaction
Raw Inputview raw input (R code)
Raw Outputview raw output of R engine
Computing time3 seconds
R Server'Sir Ronald Aylmer Fisher' @ fisher.wessa.net


Autocorrelation Function
Time lag kACF(k)T-STATP-value
10.1412251.28660.100901
2-0.240337-2.18960.015681
3-0.264284-2.40770.009134
4-0.201241-1.83340.035164
50.16861.5360.064169
60.408963.72580.000177
70.1665961.51780.066437
8-0.19235-1.75240.0417
9-0.289094-2.63380.005035
10-0.278283-2.53530.006556
110.0946870.86260.195412
120.7141786.50650
130.0592180.53950.295491
14-0.280898-2.55910.006154
15-0.245359-2.23530.014041
16-0.211924-1.93070.028466
170.1310181.19360.118011
180.2500972.27850.012633
190.0977360.89040.187908
20-0.218804-1.99340.024751
21-0.32174-2.93120.002181
22-0.267121-2.43360.008548
230.0606070.55220.291164
240.5250144.78314e-06
250.0355350.32370.373476
26-0.246893-2.24930.013571
27-0.237318-2.16210.016746
28-0.182321-1.6610.050241
290.1142361.04070.150509
300.2017941.83840.034788
310.1024240.93310.17673
32-0.140564-1.28060.101951
33-0.211424-1.92620.028754
34-0.138475-1.26160.10532
350.1039740.94730.17313
360.4424674.03116.1e-05
370.0438190.39920.34538
38-0.174396-1.58880.057951
39-0.122251-1.11380.134298
40-0.089667-0.81690.20816
410.1321021.20350.1161
420.1918051.74740.042131
430.0681760.62110.268114
44-0.120951-1.10190.136842
45-0.153723-1.40050.082549
46-0.07508-0.6840.247936
470.0630260.57420.283695
480.3681063.35360.000602

\begin{tabular}{lllllllll}
\hline
Autocorrelation Function \tabularnewline
Time lag k & ACF(k) & T-STAT & P-value \tabularnewline
1 & 0.141225 & 1.2866 & 0.100901 \tabularnewline
2 & -0.240337 & -2.1896 & 0.015681 \tabularnewline
3 & -0.264284 & -2.4077 & 0.009134 \tabularnewline
4 & -0.201241 & -1.8334 & 0.035164 \tabularnewline
5 & 0.1686 & 1.536 & 0.064169 \tabularnewline
6 & 0.40896 & 3.7258 & 0.000177 \tabularnewline
7 & 0.166596 & 1.5178 & 0.066437 \tabularnewline
8 & -0.19235 & -1.7524 & 0.0417 \tabularnewline
9 & -0.289094 & -2.6338 & 0.005035 \tabularnewline
10 & -0.278283 & -2.5353 & 0.006556 \tabularnewline
11 & 0.094687 & 0.8626 & 0.195412 \tabularnewline
12 & 0.714178 & 6.5065 & 0 \tabularnewline
13 & 0.059218 & 0.5395 & 0.295491 \tabularnewline
14 & -0.280898 & -2.5591 & 0.006154 \tabularnewline
15 & -0.245359 & -2.2353 & 0.014041 \tabularnewline
16 & -0.211924 & -1.9307 & 0.028466 \tabularnewline
17 & 0.131018 & 1.1936 & 0.118011 \tabularnewline
18 & 0.250097 & 2.2785 & 0.012633 \tabularnewline
19 & 0.097736 & 0.8904 & 0.187908 \tabularnewline
20 & -0.218804 & -1.9934 & 0.024751 \tabularnewline
21 & -0.32174 & -2.9312 & 0.002181 \tabularnewline
22 & -0.267121 & -2.4336 & 0.008548 \tabularnewline
23 & 0.060607 & 0.5522 & 0.291164 \tabularnewline
24 & 0.525014 & 4.7831 & 4e-06 \tabularnewline
25 & 0.035535 & 0.3237 & 0.373476 \tabularnewline
26 & -0.246893 & -2.2493 & 0.013571 \tabularnewline
27 & -0.237318 & -2.1621 & 0.016746 \tabularnewline
28 & -0.182321 & -1.661 & 0.050241 \tabularnewline
29 & 0.114236 & 1.0407 & 0.150509 \tabularnewline
30 & 0.201794 & 1.8384 & 0.034788 \tabularnewline
31 & 0.102424 & 0.9331 & 0.17673 \tabularnewline
32 & -0.140564 & -1.2806 & 0.101951 \tabularnewline
33 & -0.211424 & -1.9262 & 0.028754 \tabularnewline
34 & -0.138475 & -1.2616 & 0.10532 \tabularnewline
35 & 0.103974 & 0.9473 & 0.17313 \tabularnewline
36 & 0.442467 & 4.0311 & 6.1e-05 \tabularnewline
37 & 0.043819 & 0.3992 & 0.34538 \tabularnewline
38 & -0.174396 & -1.5888 & 0.057951 \tabularnewline
39 & -0.122251 & -1.1138 & 0.134298 \tabularnewline
40 & -0.089667 & -0.8169 & 0.20816 \tabularnewline
41 & 0.132102 & 1.2035 & 0.1161 \tabularnewline
42 & 0.191805 & 1.7474 & 0.042131 \tabularnewline
43 & 0.068176 & 0.6211 & 0.268114 \tabularnewline
44 & -0.120951 & -1.1019 & 0.136842 \tabularnewline
45 & -0.153723 & -1.4005 & 0.082549 \tabularnewline
46 & -0.07508 & -0.684 & 0.247936 \tabularnewline
47 & 0.063026 & 0.5742 & 0.283695 \tabularnewline
48 & 0.368106 & 3.3536 & 0.000602 \tabularnewline
\hline
\end{tabular}
%Source: https://freestatistics.org/blog/index.php?pk=225614&T=1

[TABLE]
[ROW][C]Autocorrelation Function[/C][/ROW]
[ROW][C]Time lag k[/C][C]ACF(k)[/C][C]T-STAT[/C][C]P-value[/C][/ROW]
[ROW][C]1[/C][C]0.141225[/C][C]1.2866[/C][C]0.100901[/C][/ROW]
[ROW][C]2[/C][C]-0.240337[/C][C]-2.1896[/C][C]0.015681[/C][/ROW]
[ROW][C]3[/C][C]-0.264284[/C][C]-2.4077[/C][C]0.009134[/C][/ROW]
[ROW][C]4[/C][C]-0.201241[/C][C]-1.8334[/C][C]0.035164[/C][/ROW]
[ROW][C]5[/C][C]0.1686[/C][C]1.536[/C][C]0.064169[/C][/ROW]
[ROW][C]6[/C][C]0.40896[/C][C]3.7258[/C][C]0.000177[/C][/ROW]
[ROW][C]7[/C][C]0.166596[/C][C]1.5178[/C][C]0.066437[/C][/ROW]
[ROW][C]8[/C][C]-0.19235[/C][C]-1.7524[/C][C]0.0417[/C][/ROW]
[ROW][C]9[/C][C]-0.289094[/C][C]-2.6338[/C][C]0.005035[/C][/ROW]
[ROW][C]10[/C][C]-0.278283[/C][C]-2.5353[/C][C]0.006556[/C][/ROW]
[ROW][C]11[/C][C]0.094687[/C][C]0.8626[/C][C]0.195412[/C][/ROW]
[ROW][C]12[/C][C]0.714178[/C][C]6.5065[/C][C]0[/C][/ROW]
[ROW][C]13[/C][C]0.059218[/C][C]0.5395[/C][C]0.295491[/C][/ROW]
[ROW][C]14[/C][C]-0.280898[/C][C]-2.5591[/C][C]0.006154[/C][/ROW]
[ROW][C]15[/C][C]-0.245359[/C][C]-2.2353[/C][C]0.014041[/C][/ROW]
[ROW][C]16[/C][C]-0.211924[/C][C]-1.9307[/C][C]0.028466[/C][/ROW]
[ROW][C]17[/C][C]0.131018[/C][C]1.1936[/C][C]0.118011[/C][/ROW]
[ROW][C]18[/C][C]0.250097[/C][C]2.2785[/C][C]0.012633[/C][/ROW]
[ROW][C]19[/C][C]0.097736[/C][C]0.8904[/C][C]0.187908[/C][/ROW]
[ROW][C]20[/C][C]-0.218804[/C][C]-1.9934[/C][C]0.024751[/C][/ROW]
[ROW][C]21[/C][C]-0.32174[/C][C]-2.9312[/C][C]0.002181[/C][/ROW]
[ROW][C]22[/C][C]-0.267121[/C][C]-2.4336[/C][C]0.008548[/C][/ROW]
[ROW][C]23[/C][C]0.060607[/C][C]0.5522[/C][C]0.291164[/C][/ROW]
[ROW][C]24[/C][C]0.525014[/C][C]4.7831[/C][C]4e-06[/C][/ROW]
[ROW][C]25[/C][C]0.035535[/C][C]0.3237[/C][C]0.373476[/C][/ROW]
[ROW][C]26[/C][C]-0.246893[/C][C]-2.2493[/C][C]0.013571[/C][/ROW]
[ROW][C]27[/C][C]-0.237318[/C][C]-2.1621[/C][C]0.016746[/C][/ROW]
[ROW][C]28[/C][C]-0.182321[/C][C]-1.661[/C][C]0.050241[/C][/ROW]
[ROW][C]29[/C][C]0.114236[/C][C]1.0407[/C][C]0.150509[/C][/ROW]
[ROW][C]30[/C][C]0.201794[/C][C]1.8384[/C][C]0.034788[/C][/ROW]
[ROW][C]31[/C][C]0.102424[/C][C]0.9331[/C][C]0.17673[/C][/ROW]
[ROW][C]32[/C][C]-0.140564[/C][C]-1.2806[/C][C]0.101951[/C][/ROW]
[ROW][C]33[/C][C]-0.211424[/C][C]-1.9262[/C][C]0.028754[/C][/ROW]
[ROW][C]34[/C][C]-0.138475[/C][C]-1.2616[/C][C]0.10532[/C][/ROW]
[ROW][C]35[/C][C]0.103974[/C][C]0.9473[/C][C]0.17313[/C][/ROW]
[ROW][C]36[/C][C]0.442467[/C][C]4.0311[/C][C]6.1e-05[/C][/ROW]
[ROW][C]37[/C][C]0.043819[/C][C]0.3992[/C][C]0.34538[/C][/ROW]
[ROW][C]38[/C][C]-0.174396[/C][C]-1.5888[/C][C]0.057951[/C][/ROW]
[ROW][C]39[/C][C]-0.122251[/C][C]-1.1138[/C][C]0.134298[/C][/ROW]
[ROW][C]40[/C][C]-0.089667[/C][C]-0.8169[/C][C]0.20816[/C][/ROW]
[ROW][C]41[/C][C]0.132102[/C][C]1.2035[/C][C]0.1161[/C][/ROW]
[ROW][C]42[/C][C]0.191805[/C][C]1.7474[/C][C]0.042131[/C][/ROW]
[ROW][C]43[/C][C]0.068176[/C][C]0.6211[/C][C]0.268114[/C][/ROW]
[ROW][C]44[/C][C]-0.120951[/C][C]-1.1019[/C][C]0.136842[/C][/ROW]
[ROW][C]45[/C][C]-0.153723[/C][C]-1.4005[/C][C]0.082549[/C][/ROW]
[ROW][C]46[/C][C]-0.07508[/C][C]-0.684[/C][C]0.247936[/C][/ROW]
[ROW][C]47[/C][C]0.063026[/C][C]0.5742[/C][C]0.283695[/C][/ROW]
[ROW][C]48[/C][C]0.368106[/C][C]3.3536[/C][C]0.000602[/C][/ROW]
[/TABLE]
Source: https://freestatistics.org/blog/index.php?pk=225614&T=1

Globally Unique Identifier (entire table): ba.freestatistics.org/blog/index.php?pk=225614&T=1

As an alternative you can also use a QR Code:  

The GUIDs for individual cells are displayed in the table below:

Autocorrelation Function
Time lag kACF(k)T-STATP-value
10.1412251.28660.100901
2-0.240337-2.18960.015681
3-0.264284-2.40770.009134
4-0.201241-1.83340.035164
50.16861.5360.064169
60.408963.72580.000177
70.1665961.51780.066437
8-0.19235-1.75240.0417
9-0.289094-2.63380.005035
10-0.278283-2.53530.006556
110.0946870.86260.195412
120.7141786.50650
130.0592180.53950.295491
14-0.280898-2.55910.006154
15-0.245359-2.23530.014041
16-0.211924-1.93070.028466
170.1310181.19360.118011
180.2500972.27850.012633
190.0977360.89040.187908
20-0.218804-1.99340.024751
21-0.32174-2.93120.002181
22-0.267121-2.43360.008548
230.0606070.55220.291164
240.5250144.78314e-06
250.0355350.32370.373476
26-0.246893-2.24930.013571
27-0.237318-2.16210.016746
28-0.182321-1.6610.050241
290.1142361.04070.150509
300.2017941.83840.034788
310.1024240.93310.17673
32-0.140564-1.28060.101951
33-0.211424-1.92620.028754
34-0.138475-1.26160.10532
350.1039740.94730.17313
360.4424674.03116.1e-05
370.0438190.39920.34538
38-0.174396-1.58880.057951
39-0.122251-1.11380.134298
40-0.089667-0.81690.20816
410.1321021.20350.1161
420.1918051.74740.042131
430.0681760.62110.268114
44-0.120951-1.10190.136842
45-0.153723-1.40050.082549
46-0.07508-0.6840.247936
470.0630260.57420.283695
480.3681063.35360.000602


Partial Autocorrelation Function
Time lag kPACF(k)T-STATP-value
10.1412251.28660.100901
2-0.265578-2.41950.008862
3-0.201796-1.83840.034787
4-0.22296-2.03130.022714
50.1207171.09980.137303
60.2794672.54610.006371
70.1182191.0770.142294
8-0.070691-0.6440.260667
9-0.085375-0.77780.219447
10-0.233842-2.13040.018049
11-0.033504-0.30520.380474
120.5950435.42110
13-0.220077-2.0050.024111
14-0.137664-1.25420.106648
150.0512350.46680.320942
16-0.023362-0.21280.415987
17-0.051642-0.47050.319623
18-0.294991-2.68750.004348
19-0.029959-0.27290.392788
20-0.072172-0.65750.256335
21-0.136405-1.24270.108738
22-0.061445-0.55980.288566
23-0.092074-0.83880.201987
240.0171690.15640.438043
250.0118870.10830.457013
260.0118880.10830.457007
27-0.108094-0.98480.163796
28-0.044998-0.410.341449
29-0.036142-0.32930.37139
30-0.031088-0.28320.388856
31-0.077731-0.70820.240415
32-0.008206-0.07480.470292
330.1717971.56510.060677
340.1082060.98580.163547
350.0321870.29320.385036
360.0254380.23170.408652
37-0.019801-0.18040.428639
380.0087410.07960.46836
390.0480940.43820.331205
40-0.054015-0.49210.311975
41-0.08139-0.74150.230243
420.034490.31420.377072
43-0.046076-0.41980.337868
44-0.060554-0.55170.291327
45-0.087607-0.79810.213534
46-0.013394-0.1220.451586
47-0.12011-1.09430.138505
480.0159280.14510.442489

\begin{tabular}{lllllllll}
\hline
Partial Autocorrelation Function \tabularnewline
Time lag k & PACF(k) & T-STAT & P-value \tabularnewline
1 & 0.141225 & 1.2866 & 0.100901 \tabularnewline
2 & -0.265578 & -2.4195 & 0.008862 \tabularnewline
3 & -0.201796 & -1.8384 & 0.034787 \tabularnewline
4 & -0.22296 & -2.0313 & 0.022714 \tabularnewline
5 & 0.120717 & 1.0998 & 0.137303 \tabularnewline
6 & 0.279467 & 2.5461 & 0.006371 \tabularnewline
7 & 0.118219 & 1.077 & 0.142294 \tabularnewline
8 & -0.070691 & -0.644 & 0.260667 \tabularnewline
9 & -0.085375 & -0.7778 & 0.219447 \tabularnewline
10 & -0.233842 & -2.1304 & 0.018049 \tabularnewline
11 & -0.033504 & -0.3052 & 0.380474 \tabularnewline
12 & 0.595043 & 5.4211 & 0 \tabularnewline
13 & -0.220077 & -2.005 & 0.024111 \tabularnewline
14 & -0.137664 & -1.2542 & 0.106648 \tabularnewline
15 & 0.051235 & 0.4668 & 0.320942 \tabularnewline
16 & -0.023362 & -0.2128 & 0.415987 \tabularnewline
17 & -0.051642 & -0.4705 & 0.319623 \tabularnewline
18 & -0.294991 & -2.6875 & 0.004348 \tabularnewline
19 & -0.029959 & -0.2729 & 0.392788 \tabularnewline
20 & -0.072172 & -0.6575 & 0.256335 \tabularnewline
21 & -0.136405 & -1.2427 & 0.108738 \tabularnewline
22 & -0.061445 & -0.5598 & 0.288566 \tabularnewline
23 & -0.092074 & -0.8388 & 0.201987 \tabularnewline
24 & 0.017169 & 0.1564 & 0.438043 \tabularnewline
25 & 0.011887 & 0.1083 & 0.457013 \tabularnewline
26 & 0.011888 & 0.1083 & 0.457007 \tabularnewline
27 & -0.108094 & -0.9848 & 0.163796 \tabularnewline
28 & -0.044998 & -0.41 & 0.341449 \tabularnewline
29 & -0.036142 & -0.3293 & 0.37139 \tabularnewline
30 & -0.031088 & -0.2832 & 0.388856 \tabularnewline
31 & -0.077731 & -0.7082 & 0.240415 \tabularnewline
32 & -0.008206 & -0.0748 & 0.470292 \tabularnewline
33 & 0.171797 & 1.5651 & 0.060677 \tabularnewline
34 & 0.108206 & 0.9858 & 0.163547 \tabularnewline
35 & 0.032187 & 0.2932 & 0.385036 \tabularnewline
36 & 0.025438 & 0.2317 & 0.408652 \tabularnewline
37 & -0.019801 & -0.1804 & 0.428639 \tabularnewline
38 & 0.008741 & 0.0796 & 0.46836 \tabularnewline
39 & 0.048094 & 0.4382 & 0.331205 \tabularnewline
40 & -0.054015 & -0.4921 & 0.311975 \tabularnewline
41 & -0.08139 & -0.7415 & 0.230243 \tabularnewline
42 & 0.03449 & 0.3142 & 0.377072 \tabularnewline
43 & -0.046076 & -0.4198 & 0.337868 \tabularnewline
44 & -0.060554 & -0.5517 & 0.291327 \tabularnewline
45 & -0.087607 & -0.7981 & 0.213534 \tabularnewline
46 & -0.013394 & -0.122 & 0.451586 \tabularnewline
47 & -0.12011 & -1.0943 & 0.138505 \tabularnewline
48 & 0.015928 & 0.1451 & 0.442489 \tabularnewline
\hline
\end{tabular}
%Source: https://freestatistics.org/blog/index.php?pk=225614&T=2

[TABLE]
[ROW][C]Partial Autocorrelation Function[/C][/ROW]
[ROW][C]Time lag k[/C][C]PACF(k)[/C][C]T-STAT[/C][C]P-value[/C][/ROW]
[ROW][C]1[/C][C]0.141225[/C][C]1.2866[/C][C]0.100901[/C][/ROW]
[ROW][C]2[/C][C]-0.265578[/C][C]-2.4195[/C][C]0.008862[/C][/ROW]
[ROW][C]3[/C][C]-0.201796[/C][C]-1.8384[/C][C]0.034787[/C][/ROW]
[ROW][C]4[/C][C]-0.22296[/C][C]-2.0313[/C][C]0.022714[/C][/ROW]
[ROW][C]5[/C][C]0.120717[/C][C]1.0998[/C][C]0.137303[/C][/ROW]
[ROW][C]6[/C][C]0.279467[/C][C]2.5461[/C][C]0.006371[/C][/ROW]
[ROW][C]7[/C][C]0.118219[/C][C]1.077[/C][C]0.142294[/C][/ROW]
[ROW][C]8[/C][C]-0.070691[/C][C]-0.644[/C][C]0.260667[/C][/ROW]
[ROW][C]9[/C][C]-0.085375[/C][C]-0.7778[/C][C]0.219447[/C][/ROW]
[ROW][C]10[/C][C]-0.233842[/C][C]-2.1304[/C][C]0.018049[/C][/ROW]
[ROW][C]11[/C][C]-0.033504[/C][C]-0.3052[/C][C]0.380474[/C][/ROW]
[ROW][C]12[/C][C]0.595043[/C][C]5.4211[/C][C]0[/C][/ROW]
[ROW][C]13[/C][C]-0.220077[/C][C]-2.005[/C][C]0.024111[/C][/ROW]
[ROW][C]14[/C][C]-0.137664[/C][C]-1.2542[/C][C]0.106648[/C][/ROW]
[ROW][C]15[/C][C]0.051235[/C][C]0.4668[/C][C]0.320942[/C][/ROW]
[ROW][C]16[/C][C]-0.023362[/C][C]-0.2128[/C][C]0.415987[/C][/ROW]
[ROW][C]17[/C][C]-0.051642[/C][C]-0.4705[/C][C]0.319623[/C][/ROW]
[ROW][C]18[/C][C]-0.294991[/C][C]-2.6875[/C][C]0.004348[/C][/ROW]
[ROW][C]19[/C][C]-0.029959[/C][C]-0.2729[/C][C]0.392788[/C][/ROW]
[ROW][C]20[/C][C]-0.072172[/C][C]-0.6575[/C][C]0.256335[/C][/ROW]
[ROW][C]21[/C][C]-0.136405[/C][C]-1.2427[/C][C]0.108738[/C][/ROW]
[ROW][C]22[/C][C]-0.061445[/C][C]-0.5598[/C][C]0.288566[/C][/ROW]
[ROW][C]23[/C][C]-0.092074[/C][C]-0.8388[/C][C]0.201987[/C][/ROW]
[ROW][C]24[/C][C]0.017169[/C][C]0.1564[/C][C]0.438043[/C][/ROW]
[ROW][C]25[/C][C]0.011887[/C][C]0.1083[/C][C]0.457013[/C][/ROW]
[ROW][C]26[/C][C]0.011888[/C][C]0.1083[/C][C]0.457007[/C][/ROW]
[ROW][C]27[/C][C]-0.108094[/C][C]-0.9848[/C][C]0.163796[/C][/ROW]
[ROW][C]28[/C][C]-0.044998[/C][C]-0.41[/C][C]0.341449[/C][/ROW]
[ROW][C]29[/C][C]-0.036142[/C][C]-0.3293[/C][C]0.37139[/C][/ROW]
[ROW][C]30[/C][C]-0.031088[/C][C]-0.2832[/C][C]0.388856[/C][/ROW]
[ROW][C]31[/C][C]-0.077731[/C][C]-0.7082[/C][C]0.240415[/C][/ROW]
[ROW][C]32[/C][C]-0.008206[/C][C]-0.0748[/C][C]0.470292[/C][/ROW]
[ROW][C]33[/C][C]0.171797[/C][C]1.5651[/C][C]0.060677[/C][/ROW]
[ROW][C]34[/C][C]0.108206[/C][C]0.9858[/C][C]0.163547[/C][/ROW]
[ROW][C]35[/C][C]0.032187[/C][C]0.2932[/C][C]0.385036[/C][/ROW]
[ROW][C]36[/C][C]0.025438[/C][C]0.2317[/C][C]0.408652[/C][/ROW]
[ROW][C]37[/C][C]-0.019801[/C][C]-0.1804[/C][C]0.428639[/C][/ROW]
[ROW][C]38[/C][C]0.008741[/C][C]0.0796[/C][C]0.46836[/C][/ROW]
[ROW][C]39[/C][C]0.048094[/C][C]0.4382[/C][C]0.331205[/C][/ROW]
[ROW][C]40[/C][C]-0.054015[/C][C]-0.4921[/C][C]0.311975[/C][/ROW]
[ROW][C]41[/C][C]-0.08139[/C][C]-0.7415[/C][C]0.230243[/C][/ROW]
[ROW][C]42[/C][C]0.03449[/C][C]0.3142[/C][C]0.377072[/C][/ROW]
[ROW][C]43[/C][C]-0.046076[/C][C]-0.4198[/C][C]0.337868[/C][/ROW]
[ROW][C]44[/C][C]-0.060554[/C][C]-0.5517[/C][C]0.291327[/C][/ROW]
[ROW][C]45[/C][C]-0.087607[/C][C]-0.7981[/C][C]0.213534[/C][/ROW]
[ROW][C]46[/C][C]-0.013394[/C][C]-0.122[/C][C]0.451586[/C][/ROW]
[ROW][C]47[/C][C]-0.12011[/C][C]-1.0943[/C][C]0.138505[/C][/ROW]
[ROW][C]48[/C][C]0.015928[/C][C]0.1451[/C][C]0.442489[/C][/ROW]
[/TABLE]
Source: https://freestatistics.org/blog/index.php?pk=225614&T=2

Globally Unique Identifier (entire table): ba.freestatistics.org/blog/index.php?pk=225614&T=2

As an alternative you can also use a QR Code:  

The GUIDs for individual cells are displayed in the table below:

Partial Autocorrelation Function
Time lag kPACF(k)T-STATP-value
10.1412251.28660.100901
2-0.265578-2.41950.008862
3-0.201796-1.83840.034787
4-0.22296-2.03130.022714
50.1207171.09980.137303
60.2794672.54610.006371
70.1182191.0770.142294
8-0.070691-0.6440.260667
9-0.085375-0.77780.219447
10-0.233842-2.13040.018049
11-0.033504-0.30520.380474
120.5950435.42110
13-0.220077-2.0050.024111
14-0.137664-1.25420.106648
150.0512350.46680.320942
16-0.023362-0.21280.415987
17-0.051642-0.47050.319623
18-0.294991-2.68750.004348
19-0.029959-0.27290.392788
20-0.072172-0.65750.256335
21-0.136405-1.24270.108738
22-0.061445-0.55980.288566
23-0.092074-0.83880.201987
240.0171690.15640.438043
250.0118870.10830.457013
260.0118880.10830.457007
27-0.108094-0.98480.163796
28-0.044998-0.410.341449
29-0.036142-0.32930.37139
30-0.031088-0.28320.388856
31-0.077731-0.70820.240415
32-0.008206-0.07480.470292
330.1717971.56510.060677
340.1082060.98580.163547
350.0321870.29320.385036
360.0254380.23170.408652
37-0.019801-0.18040.428639
380.0087410.07960.46836
390.0480940.43820.331205
40-0.054015-0.49210.311975
41-0.08139-0.74150.230243
420.034490.31420.377072
43-0.046076-0.41980.337868
44-0.060554-0.55170.291327
45-0.087607-0.79810.213534
46-0.013394-0.1220.451586
47-0.12011-1.09430.138505
480.0159280.14510.442489


Parameters (Session):
par1 = 48 ; par2 = 1 ; par3 = 1 ; par4 = 0 ; par5 = 12 ; par6 = White Noise ; par7 = 0.95 ;
Parameters (R input):
par1 = 48 ; par2 = 1 ; par3 = 1 ; par4 = 0 ; par5 = 12 ; par6 = White Noise ; par7 = 0.95 ; par8 = ;
R code (references can be found in the software module):
par8 <- ''
par7 <- '0.95'
par6 <- 'White Noise'
par5 <- '12'
par4 <- '0'
par3 <- '0'
par2 <- '1'
par1 <- '48'
if (par1 == 'Default') {
par1 = 10*log10(length(x))
} else {
par1 <- as.numeric(par1)
}
par2 <- as.numeric(par2)
par3 <- as.numeric(par3)
par4 <- as.numeric(par4)
par5 <- as.numeric(par5)
if (par6 == 'White Noise') par6 <- 'white' else par6 <- 'ma'
par7 <- as.numeric(par7)
if (par8 != '') par8 <- as.numeric(par8)
ox <- x
if (par8 == '') {
if (par2 == 0) {
x <- log(x)
} else {
x <- (x ^ par2 - 1) / par2
}
} else {
x <- log(x,base=par8)
}
if (par3 > 0) x <- diff(x,lag=1,difference=par3)
if (par4 > 0) x <- diff(x,lag=par5,difference=par4)
bitmap(file='picts.png')
op <- par(mfrow=c(2,1))
plot(ox,type='l',main='Original Time Series',xlab='time',ylab='value')
if (par8=='') {
mytitle <- paste('Working Time Series (lambda=',par2,', d=',par3,', D=',par4,')',sep='')
mysub <- paste('(lambda=',par2,', d=',par3,', D=',par4,', CI=', par7, ', CI type=',par6,')',sep='')
} else {
mytitle <- paste('Working Time Series (base=',par8,', d=',par3,', D=',par4,')',sep='')
mysub <- paste('(base=',par8,', d=',par3,', D=',par4,', CI=', par7, ', CI type=',par6,')',sep='')
}
plot(x,type='l', main=mytitle,xlab='time',ylab='value')
par(op)
dev.off()
bitmap(file='pic1.png')
racf <- acf(x, par1, main='Autocorrelation', xlab='time lag', ylab='ACF', ci.type=par6, ci=par7, sub=mysub)
dev.off()
bitmap(file='pic2.png')
rpacf <- pacf(x,par1,main='Partial Autocorrelation',xlab='lags',ylab='PACF',sub=mysub)
dev.off()
(myacf <- c(racf$acf))
(mypacf <- c(rpacf$acf))
lengthx <- length(x)
sqrtn <- sqrt(lengthx)
load(file='createtable')
a<-table.start()
a<-table.row.start(a)
a<-table.element(a,'Autocorrelation Function',4,TRUE)
a<-table.row.end(a)
a<-table.row.start(a)
a<-table.element(a,'Time lag k',header=TRUE)
a<-table.element(a,hyperlink('basics.htm','ACF(k)','click here for more information about the Autocorrelation Function'),header=TRUE)
a<-table.element(a,'T-STAT',header=TRUE)
a<-table.element(a,'P-value',header=TRUE)
a<-table.row.end(a)
for (i in 2:(par1+1)) {
a<-table.row.start(a)
a<-table.element(a,i-1,header=TRUE)
a<-table.element(a,round(myacf[i],6))
mytstat <- myacf[i]*sqrtn
a<-table.element(a,round(mytstat,4))
a<-table.element(a,round(1-pt(abs(mytstat),lengthx),6))
a<-table.row.end(a)
}
a<-table.end(a)
table.save(a,file='mytable.tab')
a<-table.start()
a<-table.row.start(a)
a<-table.element(a,'Partial Autocorrelation Function',4,TRUE)
a<-table.row.end(a)
a<-table.row.start(a)
a<-table.element(a,'Time lag k',header=TRUE)
a<-table.element(a,hyperlink('basics.htm','PACF(k)','click here for more information about the Partial Autocorrelation Function'),header=TRUE)
a<-table.element(a,'T-STAT',header=TRUE)
a<-table.element(a,'P-value',header=TRUE)
a<-table.row.end(a)
for (i in 1:par1) {
a<-table.row.start(a)
a<-table.element(a,i,header=TRUE)
a<-table.element(a,round(mypacf[i],6))
mytstat <- mypacf[i]*sqrtn
a<-table.element(a,round(mytstat,4))
a<-table.element(a,round(1-pt(abs(mytstat),lengthx),6))
a<-table.row.end(a)
}
a<-table.end(a)
table.save(a,file='mytable1.tab')