Free Statistics

of Irreproducible Research!

Author's title

Author*The author of this computation has been verified*
R Software Modulerwasp_exponentialsmoothing.wasp
Title produced by softwareExponential Smoothing
Date of computationSun, 17 Nov 2013 11:08:50 -0500
Cite this page as followsStatistical Computations at FreeStatistics.org, Office for Research Development and Education, URL https://freestatistics.org/blog/index.php?v=date/2013/Nov/17/t1384704582c082tsn07scbm5q.htm/, Retrieved Sun, 28 Apr 2024 21:18:38 +0000
Statistical Computations at FreeStatistics.org, Office for Research Development and Education, URL https://freestatistics.org/blog/index.php?pk=225811, Retrieved Sun, 28 Apr 2024 21:18:38 +0000
QR Codes:

Original text written by user:
IsPrivate?No (this computation is public)
User-defined keywords
Estimated Impact74
Family? (F = Feedback message, R = changed R code, M = changed R Module, P = changed Parameters, D = changed Data)
-     [Structural Time Series Models] [] [2013-11-17 15:53:00] [22b6f4a061c8797aa483199554a73d13]
- RMP   [Exponential Smoothing] [] [2013-11-17 16:04:53] [22b6f4a061c8797aa483199554a73d13]
- R P     [Exponential Smoothing] [] [2013-11-17 16:07:01] [22b6f4a061c8797aa483199554a73d13]
-   P         [Exponential Smoothing] [] [2013-11-17 16:08:50] [30e9f90970b737702ce92dadc5d0e0ae] [Current]
Feedback Forum

Post a new message
Dataseries X:
37
30
47
35
30
43
82
40
47
19
52
136
80
42
54
66
81
63
137
72
107
58
36
52
79
77
54
84
48
96
83
66
61
53
30
74
69
59
42
65
70
100
63
105
82
81
75
102
121
98
76
77
63
37
35
23
40
29
37
51
20
28
13
22
25
13
16
13
16
17
9
17
25
14
8
7
10
7
10
3


Summary of computational transaction
Raw Inputview raw input (R code)
Raw Outputview raw output of R engine
Computing time3 seconds
R Server'Sir Ronald Aylmer Fisher' @ fisher.wessa.net

\begin{tabular}{lllllllll}
\hline
Summary of computational transaction \tabularnewline
Raw Input & view raw input (R code)  \tabularnewline
Raw Output & view raw output of R engine  \tabularnewline
Computing time & 3 seconds \tabularnewline
R Server & 'Sir Ronald Aylmer Fisher' @ fisher.wessa.net \tabularnewline
\hline
\end{tabular}
%Source: https://freestatistics.org/blog/index.php?pk=225811&T=0

[TABLE]
[ROW][C]Summary of computational transaction[/C][/ROW]
[ROW][C]Raw Input[/C][C]view raw input (R code) [/C][/ROW]
[ROW][C]Raw Output[/C][C]view raw output of R engine [/C][/ROW]
[ROW][C]Computing time[/C][C]3 seconds[/C][/ROW]
[ROW][C]R Server[/C][C]'Sir Ronald Aylmer Fisher' @ fisher.wessa.net[/C][/ROW]
[/TABLE]
Source: https://freestatistics.org/blog/index.php?pk=225811&T=0

Globally Unique Identifier (entire table): ba.freestatistics.org/blog/index.php?pk=225811&T=0

As an alternative you can also use a QR Code:  

The GUIDs for individual cells are displayed in the table below:

Summary of computational transaction
Raw Inputview raw input (R code)
Raw Outputview raw output of R engine
Computing time3 seconds
R Server'Sir Ronald Aylmer Fisher' @ fisher.wessa.net


Estimated Parameters of Exponential Smoothing
ParameterValue
alpha0.380859354911874
beta0.0316088853012827
gamma0.733581043314648

\begin{tabular}{lllllllll}
\hline
Estimated Parameters of Exponential Smoothing \tabularnewline
Parameter & Value \tabularnewline
alpha & 0.380859354911874 \tabularnewline
beta & 0.0316088853012827 \tabularnewline
gamma & 0.733581043314648 \tabularnewline
\hline
\end{tabular}
%Source: https://freestatistics.org/blog/index.php?pk=225811&T=1

[TABLE]
[ROW][C]Estimated Parameters of Exponential Smoothing[/C][/ROW]
[ROW][C]Parameter[/C][C]Value[/C][/ROW]
[ROW][C]alpha[/C][C]0.380859354911874[/C][/ROW]
[ROW][C]beta[/C][C]0.0316088853012827[/C][/ROW]
[ROW][C]gamma[/C][C]0.733581043314648[/C][/ROW]
[/TABLE]
Source: https://freestatistics.org/blog/index.php?pk=225811&T=1

Globally Unique Identifier (entire table): ba.freestatistics.org/blog/index.php?pk=225811&T=1

As an alternative you can also use a QR Code:  

The GUIDs for individual cells are displayed in the table below:

Estimated Parameters of Exponential Smoothing
ParameterValue
alpha0.380859354911874
beta0.0316088853012827
gamma0.733581043314648


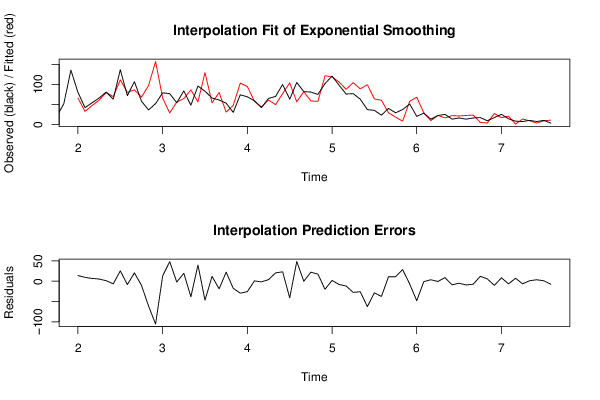
Interpolation Forecasts of Exponential Smoothing
tObservedFittedResiduals
138065.953525641025714.0464743589743
144232.44671481725839.55328518274166
155447.13530513160746.86469486839265
166660.59089490800795.40910509199209
178179.72389409402281.2761059059772
186369.423164327767-6.42316432776701
19137111.48776994845825.5122300515415
207280.1890659314029-8.18906593140285
2110786.456323671551720.5436763284483
225868.1223642893217-10.1223642893217
233697.1537646423692-61.1537646423692
2452157.471510088707-105.471510088707
257965.853803915808613.1461960841914
267728.650494978257848.3495050217422
275456.0480501431289-2.04805014312889
288464.494919076742319.5050809232577
294886.3359268092769-38.3359268092769
309656.191372995916939.8086270040831
3183129.664803267207-46.664803267207
326653.997391331065212.0026086689348
336179.6754118037347-18.6754118037347
345330.674606122690922.3253938773091
353047.4750331631066-17.4750331631066
3674103.414328539599-29.4143285395985
376994.6690520639649-25.6690520639649
385958.23468268166370.765317318336336
394243.609557805139-1.609557805139
406561.00818314123423.99181685876582
417049.478803349942520.5211966500575
4210076.760334137823.2396658622
4363103.965837074184-40.9658370741843
4410556.501549428838548.4984505711615
458281.9715413639310.0284586360690469
468158.767430267248222.2325697327518
477557.505438458554617.4945615414454
48102121.811391006697-19.8113910066967
49121119.0110215464221.98897845357767
5098106.036128029632-8.03612802963222
517687.7937238475094-11.7937238475094
5277104.548576897233-27.5485768972331
536388.8253943324188-25.8253943324188
543799.4433230770068-62.4433230770068
553563.5759025308902-28.5759025308902
562360.3350961492507-37.3350961492507
574028.937578654065911.0624213459341
582917.991147653550511.0088523464495
59378.1378362318442728.8621637681557
605157.8014044626904-6.80140446269039
612067.9862803143628-47.9862803143628
622828.951675237222-0.951675237222009
63139.31321056571143.6867894342886
642222.607051733862-0.607051733861987
652516.05057370461398.94942629538611
661321.8230856739735-8.82308567397347
671620.9469405271605-4.94694052716054
681322.1988348561943-9.19883485619434
691623.3093821664567-7.30938216645674
70174.9308234847181412.0691765152819
7193.192179909833885.80782009016612
721727.2017554894727-10.2017554894727
732516.6693885648038.33061143519702
741420.4077763690514-6.4077763690514
7580.6939026255980497.30609737440195
76713.3553977851443-6.3553977851443
77108.820287664652611.17971233534739
7873.338225050028113.66177494997189
79108.904549139223681.09545086077632
80310.5263066432418-7.52630664324185

\begin{tabular}{lllllllll}
\hline
Interpolation Forecasts of Exponential Smoothing \tabularnewline
t & Observed & Fitted & Residuals \tabularnewline
13 & 80 & 65.9535256410257 & 14.0464743589743 \tabularnewline
14 & 42 & 32.4467148172583 & 9.55328518274166 \tabularnewline
15 & 54 & 47.1353051316074 & 6.86469486839265 \tabularnewline
16 & 66 & 60.5908949080079 & 5.40910509199209 \tabularnewline
17 & 81 & 79.7238940940228 & 1.2761059059772 \tabularnewline
18 & 63 & 69.423164327767 & -6.42316432776701 \tabularnewline
19 & 137 & 111.487769948458 & 25.5122300515415 \tabularnewline
20 & 72 & 80.1890659314029 & -8.18906593140285 \tabularnewline
21 & 107 & 86.4563236715517 & 20.5436763284483 \tabularnewline
22 & 58 & 68.1223642893217 & -10.1223642893217 \tabularnewline
23 & 36 & 97.1537646423692 & -61.1537646423692 \tabularnewline
24 & 52 & 157.471510088707 & -105.471510088707 \tabularnewline
25 & 79 & 65.8538039158086 & 13.1461960841914 \tabularnewline
26 & 77 & 28.6504949782578 & 48.3495050217422 \tabularnewline
27 & 54 & 56.0480501431289 & -2.04805014312889 \tabularnewline
28 & 84 & 64.4949190767423 & 19.5050809232577 \tabularnewline
29 & 48 & 86.3359268092769 & -38.3359268092769 \tabularnewline
30 & 96 & 56.1913729959169 & 39.8086270040831 \tabularnewline
31 & 83 & 129.664803267207 & -46.664803267207 \tabularnewline
32 & 66 & 53.9973913310652 & 12.0026086689348 \tabularnewline
33 & 61 & 79.6754118037347 & -18.6754118037347 \tabularnewline
34 & 53 & 30.6746061226909 & 22.3253938773091 \tabularnewline
35 & 30 & 47.4750331631066 & -17.4750331631066 \tabularnewline
36 & 74 & 103.414328539599 & -29.4143285395985 \tabularnewline
37 & 69 & 94.6690520639649 & -25.6690520639649 \tabularnewline
38 & 59 & 58.2346826816637 & 0.765317318336336 \tabularnewline
39 & 42 & 43.609557805139 & -1.609557805139 \tabularnewline
40 & 65 & 61.0081831412342 & 3.99181685876582 \tabularnewline
41 & 70 & 49.4788033499425 & 20.5211966500575 \tabularnewline
42 & 100 & 76.7603341378 & 23.2396658622 \tabularnewline
43 & 63 & 103.965837074184 & -40.9658370741843 \tabularnewline
44 & 105 & 56.5015494288385 & 48.4984505711615 \tabularnewline
45 & 82 & 81.971541363931 & 0.0284586360690469 \tabularnewline
46 & 81 & 58.7674302672482 & 22.2325697327518 \tabularnewline
47 & 75 & 57.5054384585546 & 17.4945615414454 \tabularnewline
48 & 102 & 121.811391006697 & -19.8113910066967 \tabularnewline
49 & 121 & 119.011021546422 & 1.98897845357767 \tabularnewline
50 & 98 & 106.036128029632 & -8.03612802963222 \tabularnewline
51 & 76 & 87.7937238475094 & -11.7937238475094 \tabularnewline
52 & 77 & 104.548576897233 & -27.5485768972331 \tabularnewline
53 & 63 & 88.8253943324188 & -25.8253943324188 \tabularnewline
54 & 37 & 99.4433230770068 & -62.4433230770068 \tabularnewline
55 & 35 & 63.5759025308902 & -28.5759025308902 \tabularnewline
56 & 23 & 60.3350961492507 & -37.3350961492507 \tabularnewline
57 & 40 & 28.9375786540659 & 11.0624213459341 \tabularnewline
58 & 29 & 17.9911476535505 & 11.0088523464495 \tabularnewline
59 & 37 & 8.13783623184427 & 28.8621637681557 \tabularnewline
60 & 51 & 57.8014044626904 & -6.80140446269039 \tabularnewline
61 & 20 & 67.9862803143628 & -47.9862803143628 \tabularnewline
62 & 28 & 28.951675237222 & -0.951675237222009 \tabularnewline
63 & 13 & 9.3132105657114 & 3.6867894342886 \tabularnewline
64 & 22 & 22.607051733862 & -0.607051733861987 \tabularnewline
65 & 25 & 16.0505737046139 & 8.94942629538611 \tabularnewline
66 & 13 & 21.8230856739735 & -8.82308567397347 \tabularnewline
67 & 16 & 20.9469405271605 & -4.94694052716054 \tabularnewline
68 & 13 & 22.1988348561943 & -9.19883485619434 \tabularnewline
69 & 16 & 23.3093821664567 & -7.30938216645674 \tabularnewline
70 & 17 & 4.93082348471814 & 12.0691765152819 \tabularnewline
71 & 9 & 3.19217990983388 & 5.80782009016612 \tabularnewline
72 & 17 & 27.2017554894727 & -10.2017554894727 \tabularnewline
73 & 25 & 16.669388564803 & 8.33061143519702 \tabularnewline
74 & 14 & 20.4077763690514 & -6.4077763690514 \tabularnewline
75 & 8 & 0.693902625598049 & 7.30609737440195 \tabularnewline
76 & 7 & 13.3553977851443 & -6.3553977851443 \tabularnewline
77 & 10 & 8.82028766465261 & 1.17971233534739 \tabularnewline
78 & 7 & 3.33822505002811 & 3.66177494997189 \tabularnewline
79 & 10 & 8.90454913922368 & 1.09545086077632 \tabularnewline
80 & 3 & 10.5263066432418 & -7.52630664324185 \tabularnewline
\hline
\end{tabular}
%Source: https://freestatistics.org/blog/index.php?pk=225811&T=2

[TABLE]
[ROW][C]Interpolation Forecasts of Exponential Smoothing[/C][/ROW]
[ROW][C]t[/C][C]Observed[/C][C]Fitted[/C][C]Residuals[/C][/ROW]
[ROW][C]13[/C][C]80[/C][C]65.9535256410257[/C][C]14.0464743589743[/C][/ROW]
[ROW][C]14[/C][C]42[/C][C]32.4467148172583[/C][C]9.55328518274166[/C][/ROW]
[ROW][C]15[/C][C]54[/C][C]47.1353051316074[/C][C]6.86469486839265[/C][/ROW]
[ROW][C]16[/C][C]66[/C][C]60.5908949080079[/C][C]5.40910509199209[/C][/ROW]
[ROW][C]17[/C][C]81[/C][C]79.7238940940228[/C][C]1.2761059059772[/C][/ROW]
[ROW][C]18[/C][C]63[/C][C]69.423164327767[/C][C]-6.42316432776701[/C][/ROW]
[ROW][C]19[/C][C]137[/C][C]111.487769948458[/C][C]25.5122300515415[/C][/ROW]
[ROW][C]20[/C][C]72[/C][C]80.1890659314029[/C][C]-8.18906593140285[/C][/ROW]
[ROW][C]21[/C][C]107[/C][C]86.4563236715517[/C][C]20.5436763284483[/C][/ROW]
[ROW][C]22[/C][C]58[/C][C]68.1223642893217[/C][C]-10.1223642893217[/C][/ROW]
[ROW][C]23[/C][C]36[/C][C]97.1537646423692[/C][C]-61.1537646423692[/C][/ROW]
[ROW][C]24[/C][C]52[/C][C]157.471510088707[/C][C]-105.471510088707[/C][/ROW]
[ROW][C]25[/C][C]79[/C][C]65.8538039158086[/C][C]13.1461960841914[/C][/ROW]
[ROW][C]26[/C][C]77[/C][C]28.6504949782578[/C][C]48.3495050217422[/C][/ROW]
[ROW][C]27[/C][C]54[/C][C]56.0480501431289[/C][C]-2.04805014312889[/C][/ROW]
[ROW][C]28[/C][C]84[/C][C]64.4949190767423[/C][C]19.5050809232577[/C][/ROW]
[ROW][C]29[/C][C]48[/C][C]86.3359268092769[/C][C]-38.3359268092769[/C][/ROW]
[ROW][C]30[/C][C]96[/C][C]56.1913729959169[/C][C]39.8086270040831[/C][/ROW]
[ROW][C]31[/C][C]83[/C][C]129.664803267207[/C][C]-46.664803267207[/C][/ROW]
[ROW][C]32[/C][C]66[/C][C]53.9973913310652[/C][C]12.0026086689348[/C][/ROW]
[ROW][C]33[/C][C]61[/C][C]79.6754118037347[/C][C]-18.6754118037347[/C][/ROW]
[ROW][C]34[/C][C]53[/C][C]30.6746061226909[/C][C]22.3253938773091[/C][/ROW]
[ROW][C]35[/C][C]30[/C][C]47.4750331631066[/C][C]-17.4750331631066[/C][/ROW]
[ROW][C]36[/C][C]74[/C][C]103.414328539599[/C][C]-29.4143285395985[/C][/ROW]
[ROW][C]37[/C][C]69[/C][C]94.6690520639649[/C][C]-25.6690520639649[/C][/ROW]
[ROW][C]38[/C][C]59[/C][C]58.2346826816637[/C][C]0.765317318336336[/C][/ROW]
[ROW][C]39[/C][C]42[/C][C]43.609557805139[/C][C]-1.609557805139[/C][/ROW]
[ROW][C]40[/C][C]65[/C][C]61.0081831412342[/C][C]3.99181685876582[/C][/ROW]
[ROW][C]41[/C][C]70[/C][C]49.4788033499425[/C][C]20.5211966500575[/C][/ROW]
[ROW][C]42[/C][C]100[/C][C]76.7603341378[/C][C]23.2396658622[/C][/ROW]
[ROW][C]43[/C][C]63[/C][C]103.965837074184[/C][C]-40.9658370741843[/C][/ROW]
[ROW][C]44[/C][C]105[/C][C]56.5015494288385[/C][C]48.4984505711615[/C][/ROW]
[ROW][C]45[/C][C]82[/C][C]81.971541363931[/C][C]0.0284586360690469[/C][/ROW]
[ROW][C]46[/C][C]81[/C][C]58.7674302672482[/C][C]22.2325697327518[/C][/ROW]
[ROW][C]47[/C][C]75[/C][C]57.5054384585546[/C][C]17.4945615414454[/C][/ROW]
[ROW][C]48[/C][C]102[/C][C]121.811391006697[/C][C]-19.8113910066967[/C][/ROW]
[ROW][C]49[/C][C]121[/C][C]119.011021546422[/C][C]1.98897845357767[/C][/ROW]
[ROW][C]50[/C][C]98[/C][C]106.036128029632[/C][C]-8.03612802963222[/C][/ROW]
[ROW][C]51[/C][C]76[/C][C]87.7937238475094[/C][C]-11.7937238475094[/C][/ROW]
[ROW][C]52[/C][C]77[/C][C]104.548576897233[/C][C]-27.5485768972331[/C][/ROW]
[ROW][C]53[/C][C]63[/C][C]88.8253943324188[/C][C]-25.8253943324188[/C][/ROW]
[ROW][C]54[/C][C]37[/C][C]99.4433230770068[/C][C]-62.4433230770068[/C][/ROW]
[ROW][C]55[/C][C]35[/C][C]63.5759025308902[/C][C]-28.5759025308902[/C][/ROW]
[ROW][C]56[/C][C]23[/C][C]60.3350961492507[/C][C]-37.3350961492507[/C][/ROW]
[ROW][C]57[/C][C]40[/C][C]28.9375786540659[/C][C]11.0624213459341[/C][/ROW]
[ROW][C]58[/C][C]29[/C][C]17.9911476535505[/C][C]11.0088523464495[/C][/ROW]
[ROW][C]59[/C][C]37[/C][C]8.13783623184427[/C][C]28.8621637681557[/C][/ROW]
[ROW][C]60[/C][C]51[/C][C]57.8014044626904[/C][C]-6.80140446269039[/C][/ROW]
[ROW][C]61[/C][C]20[/C][C]67.9862803143628[/C][C]-47.9862803143628[/C][/ROW]
[ROW][C]62[/C][C]28[/C][C]28.951675237222[/C][C]-0.951675237222009[/C][/ROW]
[ROW][C]63[/C][C]13[/C][C]9.3132105657114[/C][C]3.6867894342886[/C][/ROW]
[ROW][C]64[/C][C]22[/C][C]22.607051733862[/C][C]-0.607051733861987[/C][/ROW]
[ROW][C]65[/C][C]25[/C][C]16.0505737046139[/C][C]8.94942629538611[/C][/ROW]
[ROW][C]66[/C][C]13[/C][C]21.8230856739735[/C][C]-8.82308567397347[/C][/ROW]
[ROW][C]67[/C][C]16[/C][C]20.9469405271605[/C][C]-4.94694052716054[/C][/ROW]
[ROW][C]68[/C][C]13[/C][C]22.1988348561943[/C][C]-9.19883485619434[/C][/ROW]
[ROW][C]69[/C][C]16[/C][C]23.3093821664567[/C][C]-7.30938216645674[/C][/ROW]
[ROW][C]70[/C][C]17[/C][C]4.93082348471814[/C][C]12.0691765152819[/C][/ROW]
[ROW][C]71[/C][C]9[/C][C]3.19217990983388[/C][C]5.80782009016612[/C][/ROW]
[ROW][C]72[/C][C]17[/C][C]27.2017554894727[/C][C]-10.2017554894727[/C][/ROW]
[ROW][C]73[/C][C]25[/C][C]16.669388564803[/C][C]8.33061143519702[/C][/ROW]
[ROW][C]74[/C][C]14[/C][C]20.4077763690514[/C][C]-6.4077763690514[/C][/ROW]
[ROW][C]75[/C][C]8[/C][C]0.693902625598049[/C][C]7.30609737440195[/C][/ROW]
[ROW][C]76[/C][C]7[/C][C]13.3553977851443[/C][C]-6.3553977851443[/C][/ROW]
[ROW][C]77[/C][C]10[/C][C]8.82028766465261[/C][C]1.17971233534739[/C][/ROW]
[ROW][C]78[/C][C]7[/C][C]3.33822505002811[/C][C]3.66177494997189[/C][/ROW]
[ROW][C]79[/C][C]10[/C][C]8.90454913922368[/C][C]1.09545086077632[/C][/ROW]
[ROW][C]80[/C][C]3[/C][C]10.5263066432418[/C][C]-7.52630664324185[/C][/ROW]
[/TABLE]
Source: https://freestatistics.org/blog/index.php?pk=225811&T=2

Globally Unique Identifier (entire table): ba.freestatistics.org/blog/index.php?pk=225811&T=2

As an alternative you can also use a QR Code:  

The GUIDs for individual cells are displayed in the table below:

Interpolation Forecasts of Exponential Smoothing
tObservedFittedResiduals
138065.953525641025714.0464743589743
144232.44671481725839.55328518274166
155447.13530513160746.86469486839265
166660.59089490800795.40910509199209
178179.72389409402281.2761059059772
186369.423164327767-6.42316432776701
19137111.48776994845825.5122300515415
207280.1890659314029-8.18906593140285
2110786.456323671551720.5436763284483
225868.1223642893217-10.1223642893217
233697.1537646423692-61.1537646423692
2452157.471510088707-105.471510088707
257965.853803915808613.1461960841914
267728.650494978257848.3495050217422
275456.0480501431289-2.04805014312889
288464.494919076742319.5050809232577
294886.3359268092769-38.3359268092769
309656.191372995916939.8086270040831
3183129.664803267207-46.664803267207
326653.997391331065212.0026086689348
336179.6754118037347-18.6754118037347
345330.674606122690922.3253938773091
353047.4750331631066-17.4750331631066
3674103.414328539599-29.4143285395985
376994.6690520639649-25.6690520639649
385958.23468268166370.765317318336336
394243.609557805139-1.609557805139
406561.00818314123423.99181685876582
417049.478803349942520.5211966500575
4210076.760334137823.2396658622
4363103.965837074184-40.9658370741843
4410556.501549428838548.4984505711615
458281.9715413639310.0284586360690469
468158.767430267248222.2325697327518
477557.505438458554617.4945615414454
48102121.811391006697-19.8113910066967
49121119.0110215464221.98897845357767
5098106.036128029632-8.03612802963222
517687.7937238475094-11.7937238475094
5277104.548576897233-27.5485768972331
536388.8253943324188-25.8253943324188
543799.4433230770068-62.4433230770068
553563.5759025308902-28.5759025308902
562360.3350961492507-37.3350961492507
574028.937578654065911.0624213459341
582917.991147653550511.0088523464495
59378.1378362318442728.8621637681557
605157.8014044626904-6.80140446269039
612067.9862803143628-47.9862803143628
622828.951675237222-0.951675237222009
63139.31321056571143.6867894342886
642222.607051733862-0.607051733861987
652516.05057370461398.94942629538611
661321.8230856739735-8.82308567397347
671620.9469405271605-4.94694052716054
681322.1988348561943-9.19883485619434
691623.3093821664567-7.30938216645674
70174.9308234847181412.0691765152819
7193.192179909833885.80782009016612
721727.2017554894727-10.2017554894727
732516.6693885648038.33061143519702
741420.4077763690514-6.4077763690514
7580.6939026255980497.30609737440195
76713.3553977851443-6.3553977851443
77108.820287664652611.17971233534739
7873.338225050028113.66177494997189
79108.904549139223681.09545086077632
80310.5263066432418-7.52630664324185


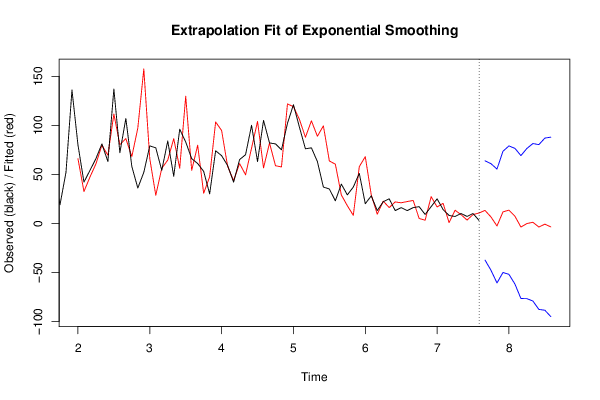
Extrapolation Forecasts of Exponential Smoothing
tForecast95% Lower Bound95% Upper Bound
8113.1518860780317-37.446598918901963.7503710749653
826.46657662735984-47.897222023730160.8303752784498
83-2.75000728511031-60.846725736888555.3467111666678
8411.6688643515569-50.140253426635873.4779821297496
8513.4546037022305-52.055546076280778.9647534807418
867.24134529397901-61.965654558531776.4483451464897
87-3.81105338955708-76.716447137431469.0943403583173
88-0.232709452867233-76.842660726258176.3772418205236
891.05592991449257-79.268509091256981.380368920242
90-3.78144524583734-87.833400150113880.2705096584391
91-0.852758842780615-88.647824662589686.9423069770283
92-3.65473445255796-95.21064612448387.901177219367

\begin{tabular}{lllllllll}
\hline
Extrapolation Forecasts of Exponential Smoothing \tabularnewline
t & Forecast & 95% Lower Bound & 95% Upper Bound \tabularnewline
81 & 13.1518860780317 & -37.4465989189019 & 63.7503710749653 \tabularnewline
82 & 6.46657662735984 & -47.8972220237301 & 60.8303752784498 \tabularnewline
83 & -2.75000728511031 & -60.8467257368885 & 55.3467111666678 \tabularnewline
84 & 11.6688643515569 & -50.1402534266358 & 73.4779821297496 \tabularnewline
85 & 13.4546037022305 & -52.0555460762807 & 78.9647534807418 \tabularnewline
86 & 7.24134529397901 & -61.9656545585317 & 76.4483451464897 \tabularnewline
87 & -3.81105338955708 & -76.7164471374314 & 69.0943403583173 \tabularnewline
88 & -0.232709452867233 & -76.8426607262581 & 76.3772418205236 \tabularnewline
89 & 1.05592991449257 & -79.2685090912569 & 81.380368920242 \tabularnewline
90 & -3.78144524583734 & -87.8334001501138 & 80.2705096584391 \tabularnewline
91 & -0.852758842780615 & -88.6478246625896 & 86.9423069770283 \tabularnewline
92 & -3.65473445255796 & -95.210646124483 & 87.901177219367 \tabularnewline
\hline
\end{tabular}
%Source: https://freestatistics.org/blog/index.php?pk=225811&T=3

[TABLE]
[ROW][C]Extrapolation Forecasts of Exponential Smoothing[/C][/ROW]
[ROW][C]t[/C][C]Forecast[/C][C]95% Lower Bound[/C][C]95% Upper Bound[/C][/ROW]
[ROW][C]81[/C][C]13.1518860780317[/C][C]-37.4465989189019[/C][C]63.7503710749653[/C][/ROW]
[ROW][C]82[/C][C]6.46657662735984[/C][C]-47.8972220237301[/C][C]60.8303752784498[/C][/ROW]
[ROW][C]83[/C][C]-2.75000728511031[/C][C]-60.8467257368885[/C][C]55.3467111666678[/C][/ROW]
[ROW][C]84[/C][C]11.6688643515569[/C][C]-50.1402534266358[/C][C]73.4779821297496[/C][/ROW]
[ROW][C]85[/C][C]13.4546037022305[/C][C]-52.0555460762807[/C][C]78.9647534807418[/C][/ROW]
[ROW][C]86[/C][C]7.24134529397901[/C][C]-61.9656545585317[/C][C]76.4483451464897[/C][/ROW]
[ROW][C]87[/C][C]-3.81105338955708[/C][C]-76.7164471374314[/C][C]69.0943403583173[/C][/ROW]
[ROW][C]88[/C][C]-0.232709452867233[/C][C]-76.8426607262581[/C][C]76.3772418205236[/C][/ROW]
[ROW][C]89[/C][C]1.05592991449257[/C][C]-79.2685090912569[/C][C]81.380368920242[/C][/ROW]
[ROW][C]90[/C][C]-3.78144524583734[/C][C]-87.8334001501138[/C][C]80.2705096584391[/C][/ROW]
[ROW][C]91[/C][C]-0.852758842780615[/C][C]-88.6478246625896[/C][C]86.9423069770283[/C][/ROW]
[ROW][C]92[/C][C]-3.65473445255796[/C][C]-95.210646124483[/C][C]87.901177219367[/C][/ROW]
[/TABLE]
Source: https://freestatistics.org/blog/index.php?pk=225811&T=3

Globally Unique Identifier (entire table): ba.freestatistics.org/blog/index.php?pk=225811&T=3

As an alternative you can also use a QR Code:  

The GUIDs for individual cells are displayed in the table below:

Extrapolation Forecasts of Exponential Smoothing
tForecast95% Lower Bound95% Upper Bound
8113.1518860780317-37.446598918901963.7503710749653
826.46657662735984-47.897222023730160.8303752784498
83-2.75000728511031-60.846725736888555.3467111666678
8411.6688643515569-50.140253426635873.4779821297496
8513.4546037022305-52.055546076280778.9647534807418
867.24134529397901-61.965654558531776.4483451464897
87-3.81105338955708-76.716447137431469.0943403583173
88-0.232709452867233-76.842660726258176.3772418205236
891.05592991449257-79.268509091256981.380368920242
90-3.78144524583734-87.833400150113880.2705096584391
91-0.852758842780615-88.647824662589686.9423069770283
92-3.65473445255796-95.21064612448387.901177219367


Parameters (Session):
par1 = 12 ; par2 = Triple ; par3 = additive ;
Parameters (R input):
par1 = 12 ; par2 = Triple ; par3 = additive ;
R code (references can be found in the software module):
par1 <- as.numeric(par1)
if (par2 == 'Single') K <- 1
if (par2 == 'Double') K <- 2
if (par2 == 'Triple') K <- par1
nx <- length(x)
nxmK <- nx - K
x <- ts(x, frequency = par1)
if (par2 == 'Single') fit <- HoltWinters(x, gamma=F, beta=F)
if (par2 == 'Double') fit <- HoltWinters(x, gamma=F)
if (par2 == 'Triple') fit <- HoltWinters(x, seasonal=par3)
fit
myresid <- x - fit$fitted[,'xhat']
bitmap(file='test1.png')
op <- par(mfrow=c(2,1))
plot(fit,ylab='Observed (black) / Fitted (red)',main='Interpolation Fit of Exponential Smoothing')
plot(myresid,ylab='Residuals',main='Interpolation Prediction Errors')
par(op)
dev.off()
bitmap(file='test2.png')
p <- predict(fit, par1, prediction.interval=TRUE)
np <- length(p[,1])
plot(fit,p,ylab='Observed (black) / Fitted (red)',main='Extrapolation Fit of Exponential Smoothing')
dev.off()
bitmap(file='test3.png')
op <- par(mfrow = c(2,2))
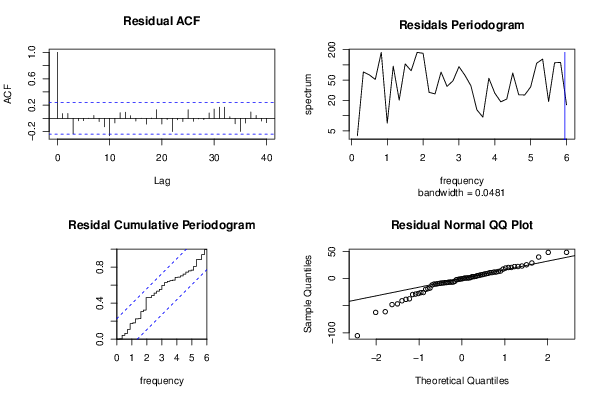
acf(as.numeric(myresid),lag.max = nx/2,main='Residual ACF')
spectrum(myresid,main='Residals Periodogram')
cpgram(myresid,main='Residal Cumulative Periodogram')
qqnorm(myresid,main='Residual Normal QQ Plot')
qqline(myresid)
par(op)
dev.off()
load(file='createtable')
a<-table.start()
a<-table.row.start(a)
a<-table.element(a,'Estimated Parameters of Exponential Smoothing',2,TRUE)
a<-table.row.end(a)
a<-table.row.start(a)
a<-table.element(a,'Parameter',header=TRUE)
a<-table.element(a,'Value',header=TRUE)
a<-table.row.end(a)
a<-table.row.start(a)
a<-table.element(a,'alpha',header=TRUE)
a<-table.element(a,fit$alpha)
a<-table.row.end(a)
a<-table.row.start(a)
a<-table.element(a,'beta',header=TRUE)
a<-table.element(a,fit$beta)
a<-table.row.end(a)
a<-table.row.start(a)
a<-table.element(a,'gamma',header=TRUE)
a<-table.element(a,fit$gamma)
a<-table.row.end(a)
a<-table.end(a)
table.save(a,file='mytable.tab')
a<-table.start()
a<-table.row.start(a)
a<-table.element(a,'Interpolation Forecasts of Exponential Smoothing',4,TRUE)
a<-table.row.end(a)
a<-table.row.start(a)
a<-table.element(a,'t',header=TRUE)
a<-table.element(a,'Observed',header=TRUE)
a<-table.element(a,'Fitted',header=TRUE)
a<-table.element(a,'Residuals',header=TRUE)
a<-table.row.end(a)
for (i in 1:nxmK) {
a<-table.row.start(a)
a<-table.element(a,i+K,header=TRUE)
a<-table.element(a,x[i+K])
a<-table.element(a,fit$fitted[i,'xhat'])
a<-table.element(a,myresid[i])
a<-table.row.end(a)
}
a<-table.end(a)
table.save(a,file='mytable1.tab')
a<-table.start()
a<-table.row.start(a)
a<-table.element(a,'Extrapolation Forecasts of Exponential Smoothing',4,TRUE)
a<-table.row.end(a)
a<-table.row.start(a)
a<-table.element(a,'t',header=TRUE)
a<-table.element(a,'Forecast',header=TRUE)
a<-table.element(a,'95% Lower Bound',header=TRUE)
a<-table.element(a,'95% Upper Bound',header=TRUE)
a<-table.row.end(a)
for (i in 1:np) {
a<-table.row.start(a)
a<-table.element(a,nx+i,header=TRUE)
a<-table.element(a,p[i,'fit'])
a<-table.element(a,p[i,'lwr'])
a<-table.element(a,p[i,'upr'])
a<-table.row.end(a)
}
a<-table.end(a)
table.save(a,file='mytable2.tab')