Free Statistics
of Irreproducible Research!
Description of Statistical Computation | ||||||||||||||||||||||||||||||
|---|---|---|---|---|---|---|---|---|---|---|---|---|---|---|---|---|---|---|---|---|---|---|---|---|---|---|---|---|---|---|
| Author's title | ||||||||||||||||||||||||||||||
| Author | *Unverified author* | |||||||||||||||||||||||||||||
| R Software Module | rwasp_Distributional Plots.wasp | |||||||||||||||||||||||||||||
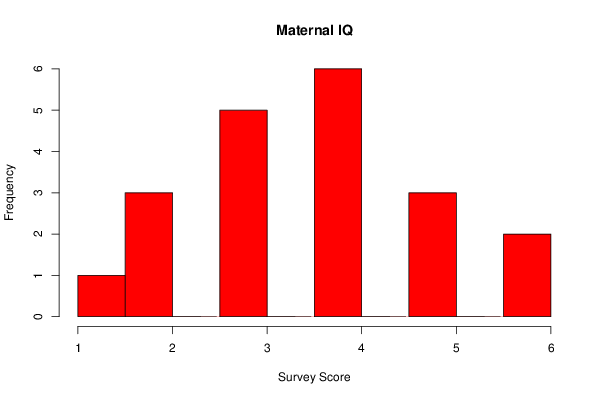
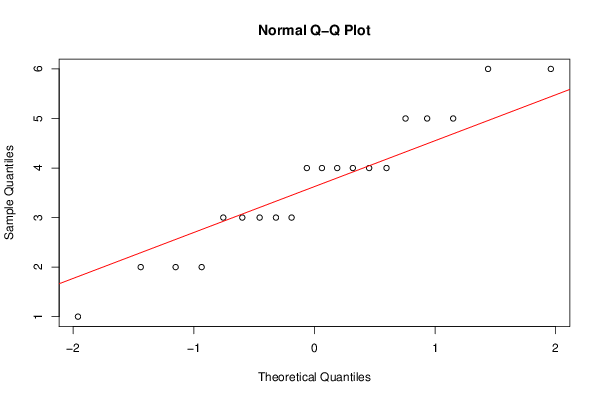
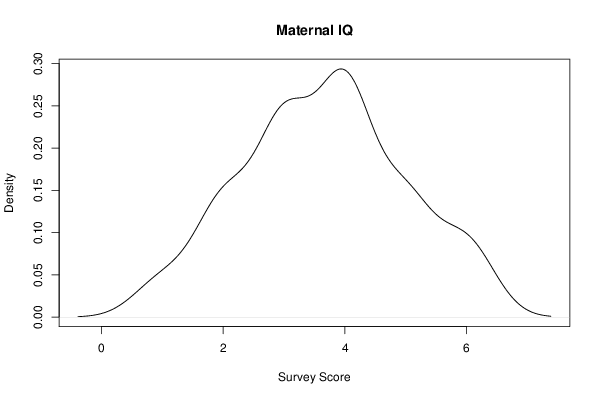
| Title produced by software | Histogram, QQplot and Density | |||||||||||||||||||||||||||||
| Date of computation | Sun, 17 Nov 2013 16:04:59 -0500 | |||||||||||||||||||||||||||||
| Cite this page as follows | Statistical Computations at FreeStatistics.org, Office for Research Development and Education, URL https://freestatistics.org/blog/index.php?v=date/2013/Nov/17/t1384722326onn0ruy86ok6p4v.htm/, Retrieved Sun, 28 Apr 2024 19:39:35 +0000 | |||||||||||||||||||||||||||||
| Statistical Computations at FreeStatistics.org, Office for Research Development and Education, URL https://freestatistics.org/blog/index.php?pk=225880, Retrieved Sun, 28 Apr 2024 19:39:35 +0000 | ||||||||||||||||||||||||||||||
| QR Codes: | ||||||||||||||||||||||||||||||
|
| ||||||||||||||||||||||||||||||
| Original text written by user: | ||||||||||||||||||||||||||||||
| IsPrivate? | No (this computation is public) | |||||||||||||||||||||||||||||
| User-defined keywords | ||||||||||||||||||||||||||||||
| Estimated Impact | 80 | |||||||||||||||||||||||||||||
Tree of Dependent Computations | ||||||||||||||||||||||||||||||
| Family? (F = Feedback message, R = changed R code, M = changed R Module, P = changed Parameters, D = changed Data) | ||||||||||||||||||||||||||||||
| - [Histogram, QQplot and Density] [Workshop 1 ] [2010-09-29 15:04:17] [98fd0e87c3eb04e0cc2efde01dbafab6] - RM [Histogram, QQplot and Density] [Workshop 1] [2011-10-03 09:04:15] [74be16979710d4c4e7c6647856088456] - R P [Histogram, QQplot and Density] [bin 11 compendium...] [2013-10-11 12:10:35] [3f5dcb93a339c554a71395e4dba6a6a4] - D [Histogram, QQplot and Density] [korma smoker] [2013-11-17 17:38:34] [3f5dcb93a339c554a71395e4dba6a6a4] - [Histogram, QQplot and Density] [Korma smoker] [2013-11-17 17:42:33] [3f5dcb93a339c554a71395e4dba6a6a4] - [Histogram, QQplot and Density] [smoker Korma] [2013-11-17 19:18:47] [74be16979710d4c4e7c6647856088456] - D [Histogram, QQplot and Density] [non smoker vindaloo] [2013-11-17 20:52:04] [74be16979710d4c4e7c6647856088456] - D [Histogram, QQplot and Density] [non smoker korma] [2013-11-17 21:04:59] [d41d8cd98f00b204e9800998ecf8427e] [Current] - [Histogram, QQplot and Density] [non smoker korma] [2013-11-17 21:17:47] [74be16979710d4c4e7c6647856088456] | ||||||||||||||||||||||||||||||
| Feedback Forum | ||||||||||||||||||||||||||||||
Post a new message | ||||||||||||||||||||||||||||||
Dataset | ||||||||||||||||||||||||||||||
| Dataseries X: | ||||||||||||||||||||||||||||||
3 5 4 2 6 1 4 4 5 4 3 3 4 3 2 5 4 3 6 2 | ||||||||||||||||||||||||||||||
Tables (Output of Computation) | ||||||||||||||||||||||||||||||
| ||||||||||||||||||||||||||||||
Figures (Output of Computation) | ||||||||||||||||||||||||||||||
Input Parameters & R Code | ||||||||||||||||||||||||||||||
| Parameters (Session): | ||||||||||||||||||||||||||||||
| par1 = 11 ; | ||||||||||||||||||||||||||||||
| Parameters (R input): | ||||||||||||||||||||||||||||||
| par1 = 11 ; | ||||||||||||||||||||||||||||||
| R code (references can be found in the software module): | ||||||||||||||||||||||||||||||
bitmap(file='test1.png') | ||||||||||||||||||||||||||||||