Free Statistics

of Irreproducible Research!

Author's title

Author*Unverified author*
R Software Modulerwasp_autocorrelation.wasp
Title produced by software(Partial) Autocorrelation Function
Date of computationMon, 18 Nov 2013 04:56:27 -0500
Cite this page as followsStatistical Computations at FreeStatistics.org, Office for Research Development and Education, URL https://freestatistics.org/blog/index.php?v=date/2013/Nov/18/t13847686072qamlml3ktz93ki.htm/, Retrieved Sat, 27 Apr 2024 07:06:42 +0000
Statistical Computations at FreeStatistics.org, Office for Research Development and Education, URL https://freestatistics.org/blog/index.php?pk=225978, Retrieved Sat, 27 Apr 2024 07:06:42 +0000
QR Codes:

Original text written by user:
IsPrivate?No (this computation is public)
User-defined keywords
Estimated Impact97
Family? (F = Feedback message, R = changed R code, M = changed R Module, P = changed Parameters, D = changed Data)
-       [(Partial) Autocorrelation Function] [] [2013-11-18 09:56:27] [f1eb0c717bff20e026fad887906ea64a] [Current]
-   PD    [(Partial) Autocorrelation Function] [] [2013-11-25 07:35:48] [74be16979710d4c4e7c6647856088456]
Feedback Forum

Post a new message
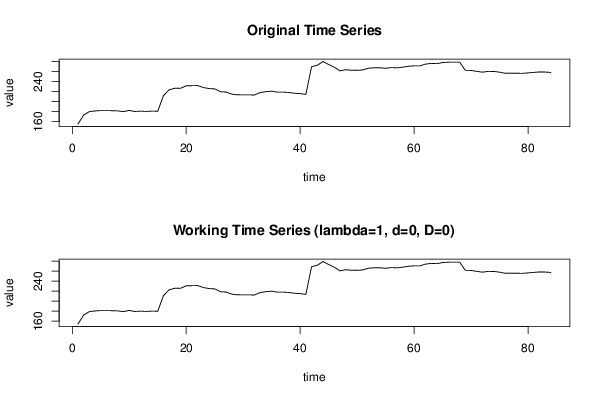
Dataseries X:
155,28
173,24
180,16
181,52
182,25
182,19
182
181,65
180,07
182,62
180,38
181,15
180,5
181,14
180,93
211,91
223,81
226,88
226,8
231,81
232,06
232,32
228,37
226,31
225,72
219,98
219,31
215,19
213,81
213,7
213,6
213,52
218,39
219,97
221,09
219,17
219,17
218,45
216,88
216,19
214,59
269,87
272,71
280,35
274,5
268,86
261,7
263,98
263,01
262,79
263,59
267
267,89
267,86
266,84
268,24
267,67
269,07
270,87
271,68
271,63
275,21
276,66
276,08
278,3
279,06
279,28
279,12
262,72
262,55
260,7
259,14
260,61
260,53
259,07
257,01
257,08
256,83
256,75
257,61
258,58
259,57
259,29
258,51


Summary of computational transaction
Raw Inputview raw input (R code)
Raw Outputview raw output of R engine
Computing time4 seconds
R Server'Gwilym Jenkins' @ jenkins.wessa.net

\begin{tabular}{lllllllll}
\hline
Summary of computational transaction \tabularnewline
Raw Input & view raw input (R code)  \tabularnewline
Raw Output & view raw output of R engine  \tabularnewline
Computing time & 4 seconds \tabularnewline
R Server & 'Gwilym Jenkins' @ jenkins.wessa.net \tabularnewline
\hline
\end{tabular}
%Source: https://freestatistics.org/blog/index.php?pk=225978&T=0

[TABLE]
[ROW][C]Summary of computational transaction[/C][/ROW]
[ROW][C]Raw Input[/C][C]view raw input (R code) [/C][/ROW]
[ROW][C]Raw Output[/C][C]view raw output of R engine [/C][/ROW]
[ROW][C]Computing time[/C][C]4 seconds[/C][/ROW]
[ROW][C]R Server[/C][C]'Gwilym Jenkins' @ jenkins.wessa.net[/C][/ROW]
[/TABLE]
Source: https://freestatistics.org/blog/index.php?pk=225978&T=0

Globally Unique Identifier (entire table): ba.freestatistics.org/blog/index.php?pk=225978&T=0

As an alternative you can also use a QR Code:  

The GUIDs for individual cells are displayed in the table below:

Summary of computational transaction
Raw Inputview raw input (R code)
Raw Outputview raw output of R engine
Computing time4 seconds
R Server'Gwilym Jenkins' @ jenkins.wessa.net


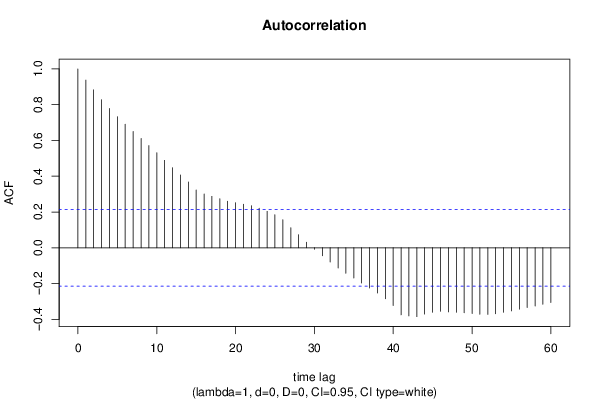
Autocorrelation Function
Time lag kACF(k)T-STATP-value
10.9376188.59340
20.8838.09280
30.828047.58910
40.7786367.13630
50.7322966.71160
60.691126.33420
70.6501475.95870
80.6113675.60330
90.5711965.23511e-06
100.5310324.8673e-06
110.4886634.47871.2e-05
120.4473814.10034.7e-05
130.4074333.73420.000171
140.3678173.37110.000567
150.3227372.95790.002011
160.3010312.7590.003557
170.2876232.63610.004994
180.2743712.51470.006911
190.2604692.38720.00961
200.2522522.31190.011615
210.2435452.23210.014134
220.2350282.15410.01705
230.2206382.02220.02317
240.2038061.86790.032631
250.184621.69210.047169
260.1563851.43330.077743
270.1119291.02580.153955
280.072840.66760.253112
290.0305440.27990.390107
30-0.007914-0.07250.471174
31-0.044564-0.40840.341998
32-0.079943-0.73270.232894
33-0.113462-1.03990.150685
34-0.142954-1.31020.096851
35-0.169562-1.55410.061965
36-0.197499-1.81010.036928
37-0.225436-2.06620.020947
38-0.253397-2.32240.011315
39-0.285488-2.61650.005265
40-0.323239-2.96250.001984
41-0.375101-3.43790.000457
42-0.38099-3.49180.000384
43-0.385185-3.53030.000338
44-0.370924-3.39960.000517
45-0.360837-3.30710.000694
46-0.355304-3.25640.000814
47-0.358542-3.28610.000742
48-0.360394-3.30310.000703
49-0.363474-3.33130.000643
50-0.367673-3.36980.000569
51-0.371947-3.40890.000502
52-0.372579-3.41470.000493
53-0.369339-3.3850.000542
54-0.360936-3.3080.000692
55-0.353152-3.23670.000866
56-0.34336-3.14690.001142
57-0.334359-3.06440.001466
58-0.325747-2.98550.001854
59-0.31607-2.89680.002403
60-0.306101-2.80550.003121

\begin{tabular}{lllllllll}
\hline
Autocorrelation Function \tabularnewline
Time lag k & ACF(k) & T-STAT & P-value \tabularnewline
1 & 0.937618 & 8.5934 & 0 \tabularnewline
2 & 0.883 & 8.0928 & 0 \tabularnewline
3 & 0.82804 & 7.5891 & 0 \tabularnewline
4 & 0.778636 & 7.1363 & 0 \tabularnewline
5 & 0.732296 & 6.7116 & 0 \tabularnewline
6 & 0.69112 & 6.3342 & 0 \tabularnewline
7 & 0.650147 & 5.9587 & 0 \tabularnewline
8 & 0.611367 & 5.6033 & 0 \tabularnewline
9 & 0.571196 & 5.2351 & 1e-06 \tabularnewline
10 & 0.531032 & 4.867 & 3e-06 \tabularnewline
11 & 0.488663 & 4.4787 & 1.2e-05 \tabularnewline
12 & 0.447381 & 4.1003 & 4.7e-05 \tabularnewline
13 & 0.407433 & 3.7342 & 0.000171 \tabularnewline
14 & 0.367817 & 3.3711 & 0.000567 \tabularnewline
15 & 0.322737 & 2.9579 & 0.002011 \tabularnewline
16 & 0.301031 & 2.759 & 0.003557 \tabularnewline
17 & 0.287623 & 2.6361 & 0.004994 \tabularnewline
18 & 0.274371 & 2.5147 & 0.006911 \tabularnewline
19 & 0.260469 & 2.3872 & 0.00961 \tabularnewline
20 & 0.252252 & 2.3119 & 0.011615 \tabularnewline
21 & 0.243545 & 2.2321 & 0.014134 \tabularnewline
22 & 0.235028 & 2.1541 & 0.01705 \tabularnewline
23 & 0.220638 & 2.0222 & 0.02317 \tabularnewline
24 & 0.203806 & 1.8679 & 0.032631 \tabularnewline
25 & 0.18462 & 1.6921 & 0.047169 \tabularnewline
26 & 0.156385 & 1.4333 & 0.077743 \tabularnewline
27 & 0.111929 & 1.0258 & 0.153955 \tabularnewline
28 & 0.07284 & 0.6676 & 0.253112 \tabularnewline
29 & 0.030544 & 0.2799 & 0.390107 \tabularnewline
30 & -0.007914 & -0.0725 & 0.471174 \tabularnewline
31 & -0.044564 & -0.4084 & 0.341998 \tabularnewline
32 & -0.079943 & -0.7327 & 0.232894 \tabularnewline
33 & -0.113462 & -1.0399 & 0.150685 \tabularnewline
34 & -0.142954 & -1.3102 & 0.096851 \tabularnewline
35 & -0.169562 & -1.5541 & 0.061965 \tabularnewline
36 & -0.197499 & -1.8101 & 0.036928 \tabularnewline
37 & -0.225436 & -2.0662 & 0.020947 \tabularnewline
38 & -0.253397 & -2.3224 & 0.011315 \tabularnewline
39 & -0.285488 & -2.6165 & 0.005265 \tabularnewline
40 & -0.323239 & -2.9625 & 0.001984 \tabularnewline
41 & -0.375101 & -3.4379 & 0.000457 \tabularnewline
42 & -0.38099 & -3.4918 & 0.000384 \tabularnewline
43 & -0.385185 & -3.5303 & 0.000338 \tabularnewline
44 & -0.370924 & -3.3996 & 0.000517 \tabularnewline
45 & -0.360837 & -3.3071 & 0.000694 \tabularnewline
46 & -0.355304 & -3.2564 & 0.000814 \tabularnewline
47 & -0.358542 & -3.2861 & 0.000742 \tabularnewline
48 & -0.360394 & -3.3031 & 0.000703 \tabularnewline
49 & -0.363474 & -3.3313 & 0.000643 \tabularnewline
50 & -0.367673 & -3.3698 & 0.000569 \tabularnewline
51 & -0.371947 & -3.4089 & 0.000502 \tabularnewline
52 & -0.372579 & -3.4147 & 0.000493 \tabularnewline
53 & -0.369339 & -3.385 & 0.000542 \tabularnewline
54 & -0.360936 & -3.308 & 0.000692 \tabularnewline
55 & -0.353152 & -3.2367 & 0.000866 \tabularnewline
56 & -0.34336 & -3.1469 & 0.001142 \tabularnewline
57 & -0.334359 & -3.0644 & 0.001466 \tabularnewline
58 & -0.325747 & -2.9855 & 0.001854 \tabularnewline
59 & -0.31607 & -2.8968 & 0.002403 \tabularnewline
60 & -0.306101 & -2.8055 & 0.003121 \tabularnewline
\hline
\end{tabular}
%Source: https://freestatistics.org/blog/index.php?pk=225978&T=1

[TABLE]
[ROW][C]Autocorrelation Function[/C][/ROW]
[ROW][C]Time lag k[/C][C]ACF(k)[/C][C]T-STAT[/C][C]P-value[/C][/ROW]
[ROW][C]1[/C][C]0.937618[/C][C]8.5934[/C][C]0[/C][/ROW]
[ROW][C]2[/C][C]0.883[/C][C]8.0928[/C][C]0[/C][/ROW]
[ROW][C]3[/C][C]0.82804[/C][C]7.5891[/C][C]0[/C][/ROW]
[ROW][C]4[/C][C]0.778636[/C][C]7.1363[/C][C]0[/C][/ROW]
[ROW][C]5[/C][C]0.732296[/C][C]6.7116[/C][C]0[/C][/ROW]
[ROW][C]6[/C][C]0.69112[/C][C]6.3342[/C][C]0[/C][/ROW]
[ROW][C]7[/C][C]0.650147[/C][C]5.9587[/C][C]0[/C][/ROW]
[ROW][C]8[/C][C]0.611367[/C][C]5.6033[/C][C]0[/C][/ROW]
[ROW][C]9[/C][C]0.571196[/C][C]5.2351[/C][C]1e-06[/C][/ROW]
[ROW][C]10[/C][C]0.531032[/C][C]4.867[/C][C]3e-06[/C][/ROW]
[ROW][C]11[/C][C]0.488663[/C][C]4.4787[/C][C]1.2e-05[/C][/ROW]
[ROW][C]12[/C][C]0.447381[/C][C]4.1003[/C][C]4.7e-05[/C][/ROW]
[ROW][C]13[/C][C]0.407433[/C][C]3.7342[/C][C]0.000171[/C][/ROW]
[ROW][C]14[/C][C]0.367817[/C][C]3.3711[/C][C]0.000567[/C][/ROW]
[ROW][C]15[/C][C]0.322737[/C][C]2.9579[/C][C]0.002011[/C][/ROW]
[ROW][C]16[/C][C]0.301031[/C][C]2.759[/C][C]0.003557[/C][/ROW]
[ROW][C]17[/C][C]0.287623[/C][C]2.6361[/C][C]0.004994[/C][/ROW]
[ROW][C]18[/C][C]0.274371[/C][C]2.5147[/C][C]0.006911[/C][/ROW]
[ROW][C]19[/C][C]0.260469[/C][C]2.3872[/C][C]0.00961[/C][/ROW]
[ROW][C]20[/C][C]0.252252[/C][C]2.3119[/C][C]0.011615[/C][/ROW]
[ROW][C]21[/C][C]0.243545[/C][C]2.2321[/C][C]0.014134[/C][/ROW]
[ROW][C]22[/C][C]0.235028[/C][C]2.1541[/C][C]0.01705[/C][/ROW]
[ROW][C]23[/C][C]0.220638[/C][C]2.0222[/C][C]0.02317[/C][/ROW]
[ROW][C]24[/C][C]0.203806[/C][C]1.8679[/C][C]0.032631[/C][/ROW]
[ROW][C]25[/C][C]0.18462[/C][C]1.6921[/C][C]0.047169[/C][/ROW]
[ROW][C]26[/C][C]0.156385[/C][C]1.4333[/C][C]0.077743[/C][/ROW]
[ROW][C]27[/C][C]0.111929[/C][C]1.0258[/C][C]0.153955[/C][/ROW]
[ROW][C]28[/C][C]0.07284[/C][C]0.6676[/C][C]0.253112[/C][/ROW]
[ROW][C]29[/C][C]0.030544[/C][C]0.2799[/C][C]0.390107[/C][/ROW]
[ROW][C]30[/C][C]-0.007914[/C][C]-0.0725[/C][C]0.471174[/C][/ROW]
[ROW][C]31[/C][C]-0.044564[/C][C]-0.4084[/C][C]0.341998[/C][/ROW]
[ROW][C]32[/C][C]-0.079943[/C][C]-0.7327[/C][C]0.232894[/C][/ROW]
[ROW][C]33[/C][C]-0.113462[/C][C]-1.0399[/C][C]0.150685[/C][/ROW]
[ROW][C]34[/C][C]-0.142954[/C][C]-1.3102[/C][C]0.096851[/C][/ROW]
[ROW][C]35[/C][C]-0.169562[/C][C]-1.5541[/C][C]0.061965[/C][/ROW]
[ROW][C]36[/C][C]-0.197499[/C][C]-1.8101[/C][C]0.036928[/C][/ROW]
[ROW][C]37[/C][C]-0.225436[/C][C]-2.0662[/C][C]0.020947[/C][/ROW]
[ROW][C]38[/C][C]-0.253397[/C][C]-2.3224[/C][C]0.011315[/C][/ROW]
[ROW][C]39[/C][C]-0.285488[/C][C]-2.6165[/C][C]0.005265[/C][/ROW]
[ROW][C]40[/C][C]-0.323239[/C][C]-2.9625[/C][C]0.001984[/C][/ROW]
[ROW][C]41[/C][C]-0.375101[/C][C]-3.4379[/C][C]0.000457[/C][/ROW]
[ROW][C]42[/C][C]-0.38099[/C][C]-3.4918[/C][C]0.000384[/C][/ROW]
[ROW][C]43[/C][C]-0.385185[/C][C]-3.5303[/C][C]0.000338[/C][/ROW]
[ROW][C]44[/C][C]-0.370924[/C][C]-3.3996[/C][C]0.000517[/C][/ROW]
[ROW][C]45[/C][C]-0.360837[/C][C]-3.3071[/C][C]0.000694[/C][/ROW]
[ROW][C]46[/C][C]-0.355304[/C][C]-3.2564[/C][C]0.000814[/C][/ROW]
[ROW][C]47[/C][C]-0.358542[/C][C]-3.2861[/C][C]0.000742[/C][/ROW]
[ROW][C]48[/C][C]-0.360394[/C][C]-3.3031[/C][C]0.000703[/C][/ROW]
[ROW][C]49[/C][C]-0.363474[/C][C]-3.3313[/C][C]0.000643[/C][/ROW]
[ROW][C]50[/C][C]-0.367673[/C][C]-3.3698[/C][C]0.000569[/C][/ROW]
[ROW][C]51[/C][C]-0.371947[/C][C]-3.4089[/C][C]0.000502[/C][/ROW]
[ROW][C]52[/C][C]-0.372579[/C][C]-3.4147[/C][C]0.000493[/C][/ROW]
[ROW][C]53[/C][C]-0.369339[/C][C]-3.385[/C][C]0.000542[/C][/ROW]
[ROW][C]54[/C][C]-0.360936[/C][C]-3.308[/C][C]0.000692[/C][/ROW]
[ROW][C]55[/C][C]-0.353152[/C][C]-3.2367[/C][C]0.000866[/C][/ROW]
[ROW][C]56[/C][C]-0.34336[/C][C]-3.1469[/C][C]0.001142[/C][/ROW]
[ROW][C]57[/C][C]-0.334359[/C][C]-3.0644[/C][C]0.001466[/C][/ROW]
[ROW][C]58[/C][C]-0.325747[/C][C]-2.9855[/C][C]0.001854[/C][/ROW]
[ROW][C]59[/C][C]-0.31607[/C][C]-2.8968[/C][C]0.002403[/C][/ROW]
[ROW][C]60[/C][C]-0.306101[/C][C]-2.8055[/C][C]0.003121[/C][/ROW]
[/TABLE]
Source: https://freestatistics.org/blog/index.php?pk=225978&T=1

Globally Unique Identifier (entire table): ba.freestatistics.org/blog/index.php?pk=225978&T=1

As an alternative you can also use a QR Code:  

The GUIDs for individual cells are displayed in the table below:

Autocorrelation Function
Time lag kACF(k)T-STATP-value
10.9376188.59340
20.8838.09280
30.828047.58910
40.7786367.13630
50.7322966.71160
60.691126.33420
70.6501475.95870
80.6113675.60330
90.5711965.23511e-06
100.5310324.8673e-06
110.4886634.47871.2e-05
120.4473814.10034.7e-05
130.4074333.73420.000171
140.3678173.37110.000567
150.3227372.95790.002011
160.3010312.7590.003557
170.2876232.63610.004994
180.2743712.51470.006911
190.2604692.38720.00961
200.2522522.31190.011615
210.2435452.23210.014134
220.2350282.15410.01705
230.2206382.02220.02317
240.2038061.86790.032631
250.184621.69210.047169
260.1563851.43330.077743
270.1119291.02580.153955
280.072840.66760.253112
290.0305440.27990.390107
30-0.007914-0.07250.471174
31-0.044564-0.40840.341998
32-0.079943-0.73270.232894
33-0.113462-1.03990.150685
34-0.142954-1.31020.096851
35-0.169562-1.55410.061965
36-0.197499-1.81010.036928
37-0.225436-2.06620.020947
38-0.253397-2.32240.011315
39-0.285488-2.61650.005265
40-0.323239-2.96250.001984
41-0.375101-3.43790.000457
42-0.38099-3.49180.000384
43-0.385185-3.53030.000338
44-0.370924-3.39960.000517
45-0.360837-3.30710.000694
46-0.355304-3.25640.000814
47-0.358542-3.28610.000742
48-0.360394-3.30310.000703
49-0.363474-3.33130.000643
50-0.367673-3.36980.000569
51-0.371947-3.40890.000502
52-0.372579-3.41470.000493
53-0.369339-3.3850.000542
54-0.360936-3.3080.000692
55-0.353152-3.23670.000866
56-0.34336-3.14690.001142
57-0.334359-3.06440.001466
58-0.325747-2.98550.001854
59-0.31607-2.89680.002403
60-0.306101-2.80550.003121


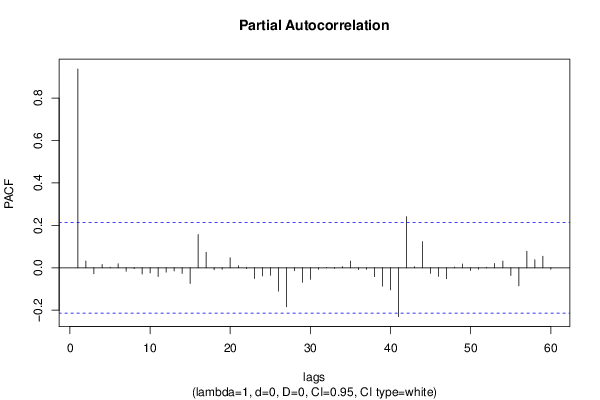
Partial Autocorrelation Function
Time lag kPACF(k)T-STATP-value
10.9376188.59340
20.0320360.29360.384889
3-0.028084-0.25740.398753
40.0158760.14550.442328
50.0028640.02620.48956
60.0190850.17490.430782
7-0.016024-0.14690.441797
8-0.004003-0.03670.485412
9-0.029314-0.26870.394422
10-0.023878-0.21880.413652
11-0.040899-0.37480.354359
12-0.020424-0.18720.425981
13-0.015281-0.14010.444477
14-0.026222-0.24030.405329
15-0.074383-0.68170.248641
160.1566741.43590.077367
170.073360.67240.251601
18-0.00887-0.08130.4677
19-0.006895-0.06320.474881
200.0478180.43830.331162
210.0098840.09060.464016
22-0.004125-0.03780.484965
23-0.050666-0.46440.321794
24-0.038289-0.35090.363263
25-0.035534-0.32570.372739
26-0.10998-1.0080.158178
27-0.183853-1.6850.047846
28-0.013669-0.12530.4503
29-0.067814-0.62150.267967
30-0.054575-0.50020.309126
31-0.007099-0.06510.47414
320.0009310.00850.496606
33-0.003328-0.03050.487871
340.0056080.05140.479565
350.0316120.28970.38637
36-0.008522-0.07810.468964
37-0.007384-0.06770.473103
38-0.041653-0.38180.351804
39-0.086537-0.79310.214969
40-0.104153-0.95460.171264
41-0.23035-2.11120.018864
420.2414152.21260.014819
430.0053670.04920.480441
440.1232951.130.130842
45-0.026273-0.24080.405149
46-0.040348-0.36980.356232
47-0.05201-0.47670.317415
480.0033620.03080.487746
490.0178720.16380.435139
50-0.012755-0.11690.453608
51-0.006309-0.05780.477014
520.0028480.02610.48962
530.0205770.18860.425435
540.0323410.29640.383823
55-0.036241-0.33210.370302
56-0.085091-0.77990.21883
570.0777420.71250.239058
580.0380690.34890.364017
590.0542990.49770.310012
60-0.007029-0.06440.474395

\begin{tabular}{lllllllll}
\hline
Partial Autocorrelation Function \tabularnewline
Time lag k & PACF(k) & T-STAT & P-value \tabularnewline
1 & 0.937618 & 8.5934 & 0 \tabularnewline
2 & 0.032036 & 0.2936 & 0.384889 \tabularnewline
3 & -0.028084 & -0.2574 & 0.398753 \tabularnewline
4 & 0.015876 & 0.1455 & 0.442328 \tabularnewline
5 & 0.002864 & 0.0262 & 0.48956 \tabularnewline
6 & 0.019085 & 0.1749 & 0.430782 \tabularnewline
7 & -0.016024 & -0.1469 & 0.441797 \tabularnewline
8 & -0.004003 & -0.0367 & 0.485412 \tabularnewline
9 & -0.029314 & -0.2687 & 0.394422 \tabularnewline
10 & -0.023878 & -0.2188 & 0.413652 \tabularnewline
11 & -0.040899 & -0.3748 & 0.354359 \tabularnewline
12 & -0.020424 & -0.1872 & 0.425981 \tabularnewline
13 & -0.015281 & -0.1401 & 0.444477 \tabularnewline
14 & -0.026222 & -0.2403 & 0.405329 \tabularnewline
15 & -0.074383 & -0.6817 & 0.248641 \tabularnewline
16 & 0.156674 & 1.4359 & 0.077367 \tabularnewline
17 & 0.07336 & 0.6724 & 0.251601 \tabularnewline
18 & -0.00887 & -0.0813 & 0.4677 \tabularnewline
19 & -0.006895 & -0.0632 & 0.474881 \tabularnewline
20 & 0.047818 & 0.4383 & 0.331162 \tabularnewline
21 & 0.009884 & 0.0906 & 0.464016 \tabularnewline
22 & -0.004125 & -0.0378 & 0.484965 \tabularnewline
23 & -0.050666 & -0.4644 & 0.321794 \tabularnewline
24 & -0.038289 & -0.3509 & 0.363263 \tabularnewline
25 & -0.035534 & -0.3257 & 0.372739 \tabularnewline
26 & -0.10998 & -1.008 & 0.158178 \tabularnewline
27 & -0.183853 & -1.685 & 0.047846 \tabularnewline
28 & -0.013669 & -0.1253 & 0.4503 \tabularnewline
29 & -0.067814 & -0.6215 & 0.267967 \tabularnewline
30 & -0.054575 & -0.5002 & 0.309126 \tabularnewline
31 & -0.007099 & -0.0651 & 0.47414 \tabularnewline
32 & 0.000931 & 0.0085 & 0.496606 \tabularnewline
33 & -0.003328 & -0.0305 & 0.487871 \tabularnewline
34 & 0.005608 & 0.0514 & 0.479565 \tabularnewline
35 & 0.031612 & 0.2897 & 0.38637 \tabularnewline
36 & -0.008522 & -0.0781 & 0.468964 \tabularnewline
37 & -0.007384 & -0.0677 & 0.473103 \tabularnewline
38 & -0.041653 & -0.3818 & 0.351804 \tabularnewline
39 & -0.086537 & -0.7931 & 0.214969 \tabularnewline
40 & -0.104153 & -0.9546 & 0.171264 \tabularnewline
41 & -0.23035 & -2.1112 & 0.018864 \tabularnewline
42 & 0.241415 & 2.2126 & 0.014819 \tabularnewline
43 & 0.005367 & 0.0492 & 0.480441 \tabularnewline
44 & 0.123295 & 1.13 & 0.130842 \tabularnewline
45 & -0.026273 & -0.2408 & 0.405149 \tabularnewline
46 & -0.040348 & -0.3698 & 0.356232 \tabularnewline
47 & -0.05201 & -0.4767 & 0.317415 \tabularnewline
48 & 0.003362 & 0.0308 & 0.487746 \tabularnewline
49 & 0.017872 & 0.1638 & 0.435139 \tabularnewline
50 & -0.012755 & -0.1169 & 0.453608 \tabularnewline
51 & -0.006309 & -0.0578 & 0.477014 \tabularnewline
52 & 0.002848 & 0.0261 & 0.48962 \tabularnewline
53 & 0.020577 & 0.1886 & 0.425435 \tabularnewline
54 & 0.032341 & 0.2964 & 0.383823 \tabularnewline
55 & -0.036241 & -0.3321 & 0.370302 \tabularnewline
56 & -0.085091 & -0.7799 & 0.21883 \tabularnewline
57 & 0.077742 & 0.7125 & 0.239058 \tabularnewline
58 & 0.038069 & 0.3489 & 0.364017 \tabularnewline
59 & 0.054299 & 0.4977 & 0.310012 \tabularnewline
60 & -0.007029 & -0.0644 & 0.474395 \tabularnewline
\hline
\end{tabular}
%Source: https://freestatistics.org/blog/index.php?pk=225978&T=2

[TABLE]
[ROW][C]Partial Autocorrelation Function[/C][/ROW]
[ROW][C]Time lag k[/C][C]PACF(k)[/C][C]T-STAT[/C][C]P-value[/C][/ROW]
[ROW][C]1[/C][C]0.937618[/C][C]8.5934[/C][C]0[/C][/ROW]
[ROW][C]2[/C][C]0.032036[/C][C]0.2936[/C][C]0.384889[/C][/ROW]
[ROW][C]3[/C][C]-0.028084[/C][C]-0.2574[/C][C]0.398753[/C][/ROW]
[ROW][C]4[/C][C]0.015876[/C][C]0.1455[/C][C]0.442328[/C][/ROW]
[ROW][C]5[/C][C]0.002864[/C][C]0.0262[/C][C]0.48956[/C][/ROW]
[ROW][C]6[/C][C]0.019085[/C][C]0.1749[/C][C]0.430782[/C][/ROW]
[ROW][C]7[/C][C]-0.016024[/C][C]-0.1469[/C][C]0.441797[/C][/ROW]
[ROW][C]8[/C][C]-0.004003[/C][C]-0.0367[/C][C]0.485412[/C][/ROW]
[ROW][C]9[/C][C]-0.029314[/C][C]-0.2687[/C][C]0.394422[/C][/ROW]
[ROW][C]10[/C][C]-0.023878[/C][C]-0.2188[/C][C]0.413652[/C][/ROW]
[ROW][C]11[/C][C]-0.040899[/C][C]-0.3748[/C][C]0.354359[/C][/ROW]
[ROW][C]12[/C][C]-0.020424[/C][C]-0.1872[/C][C]0.425981[/C][/ROW]
[ROW][C]13[/C][C]-0.015281[/C][C]-0.1401[/C][C]0.444477[/C][/ROW]
[ROW][C]14[/C][C]-0.026222[/C][C]-0.2403[/C][C]0.405329[/C][/ROW]
[ROW][C]15[/C][C]-0.074383[/C][C]-0.6817[/C][C]0.248641[/C][/ROW]
[ROW][C]16[/C][C]0.156674[/C][C]1.4359[/C][C]0.077367[/C][/ROW]
[ROW][C]17[/C][C]0.07336[/C][C]0.6724[/C][C]0.251601[/C][/ROW]
[ROW][C]18[/C][C]-0.00887[/C][C]-0.0813[/C][C]0.4677[/C][/ROW]
[ROW][C]19[/C][C]-0.006895[/C][C]-0.0632[/C][C]0.474881[/C][/ROW]
[ROW][C]20[/C][C]0.047818[/C][C]0.4383[/C][C]0.331162[/C][/ROW]
[ROW][C]21[/C][C]0.009884[/C][C]0.0906[/C][C]0.464016[/C][/ROW]
[ROW][C]22[/C][C]-0.004125[/C][C]-0.0378[/C][C]0.484965[/C][/ROW]
[ROW][C]23[/C][C]-0.050666[/C][C]-0.4644[/C][C]0.321794[/C][/ROW]
[ROW][C]24[/C][C]-0.038289[/C][C]-0.3509[/C][C]0.363263[/C][/ROW]
[ROW][C]25[/C][C]-0.035534[/C][C]-0.3257[/C][C]0.372739[/C][/ROW]
[ROW][C]26[/C][C]-0.10998[/C][C]-1.008[/C][C]0.158178[/C][/ROW]
[ROW][C]27[/C][C]-0.183853[/C][C]-1.685[/C][C]0.047846[/C][/ROW]
[ROW][C]28[/C][C]-0.013669[/C][C]-0.1253[/C][C]0.4503[/C][/ROW]
[ROW][C]29[/C][C]-0.067814[/C][C]-0.6215[/C][C]0.267967[/C][/ROW]
[ROW][C]30[/C][C]-0.054575[/C][C]-0.5002[/C][C]0.309126[/C][/ROW]
[ROW][C]31[/C][C]-0.007099[/C][C]-0.0651[/C][C]0.47414[/C][/ROW]
[ROW][C]32[/C][C]0.000931[/C][C]0.0085[/C][C]0.496606[/C][/ROW]
[ROW][C]33[/C][C]-0.003328[/C][C]-0.0305[/C][C]0.487871[/C][/ROW]
[ROW][C]34[/C][C]0.005608[/C][C]0.0514[/C][C]0.479565[/C][/ROW]
[ROW][C]35[/C][C]0.031612[/C][C]0.2897[/C][C]0.38637[/C][/ROW]
[ROW][C]36[/C][C]-0.008522[/C][C]-0.0781[/C][C]0.468964[/C][/ROW]
[ROW][C]37[/C][C]-0.007384[/C][C]-0.0677[/C][C]0.473103[/C][/ROW]
[ROW][C]38[/C][C]-0.041653[/C][C]-0.3818[/C][C]0.351804[/C][/ROW]
[ROW][C]39[/C][C]-0.086537[/C][C]-0.7931[/C][C]0.214969[/C][/ROW]
[ROW][C]40[/C][C]-0.104153[/C][C]-0.9546[/C][C]0.171264[/C][/ROW]
[ROW][C]41[/C][C]-0.23035[/C][C]-2.1112[/C][C]0.018864[/C][/ROW]
[ROW][C]42[/C][C]0.241415[/C][C]2.2126[/C][C]0.014819[/C][/ROW]
[ROW][C]43[/C][C]0.005367[/C][C]0.0492[/C][C]0.480441[/C][/ROW]
[ROW][C]44[/C][C]0.123295[/C][C]1.13[/C][C]0.130842[/C][/ROW]
[ROW][C]45[/C][C]-0.026273[/C][C]-0.2408[/C][C]0.405149[/C][/ROW]
[ROW][C]46[/C][C]-0.040348[/C][C]-0.3698[/C][C]0.356232[/C][/ROW]
[ROW][C]47[/C][C]-0.05201[/C][C]-0.4767[/C][C]0.317415[/C][/ROW]
[ROW][C]48[/C][C]0.003362[/C][C]0.0308[/C][C]0.487746[/C][/ROW]
[ROW][C]49[/C][C]0.017872[/C][C]0.1638[/C][C]0.435139[/C][/ROW]
[ROW][C]50[/C][C]-0.012755[/C][C]-0.1169[/C][C]0.453608[/C][/ROW]
[ROW][C]51[/C][C]-0.006309[/C][C]-0.0578[/C][C]0.477014[/C][/ROW]
[ROW][C]52[/C][C]0.002848[/C][C]0.0261[/C][C]0.48962[/C][/ROW]
[ROW][C]53[/C][C]0.020577[/C][C]0.1886[/C][C]0.425435[/C][/ROW]
[ROW][C]54[/C][C]0.032341[/C][C]0.2964[/C][C]0.383823[/C][/ROW]
[ROW][C]55[/C][C]-0.036241[/C][C]-0.3321[/C][C]0.370302[/C][/ROW]
[ROW][C]56[/C][C]-0.085091[/C][C]-0.7799[/C][C]0.21883[/C][/ROW]
[ROW][C]57[/C][C]0.077742[/C][C]0.7125[/C][C]0.239058[/C][/ROW]
[ROW][C]58[/C][C]0.038069[/C][C]0.3489[/C][C]0.364017[/C][/ROW]
[ROW][C]59[/C][C]0.054299[/C][C]0.4977[/C][C]0.310012[/C][/ROW]
[ROW][C]60[/C][C]-0.007029[/C][C]-0.0644[/C][C]0.474395[/C][/ROW]
[/TABLE]
Source: https://freestatistics.org/blog/index.php?pk=225978&T=2

Globally Unique Identifier (entire table): ba.freestatistics.org/blog/index.php?pk=225978&T=2

As an alternative you can also use a QR Code:  

The GUIDs for individual cells are displayed in the table below:

Partial Autocorrelation Function
Time lag kPACF(k)T-STATP-value
10.9376188.59340
20.0320360.29360.384889
3-0.028084-0.25740.398753
40.0158760.14550.442328
50.0028640.02620.48956
60.0190850.17490.430782
7-0.016024-0.14690.441797
8-0.004003-0.03670.485412
9-0.029314-0.26870.394422
10-0.023878-0.21880.413652
11-0.040899-0.37480.354359
12-0.020424-0.18720.425981
13-0.015281-0.14010.444477
14-0.026222-0.24030.405329
15-0.074383-0.68170.248641
160.1566741.43590.077367
170.073360.67240.251601
18-0.00887-0.08130.4677
19-0.006895-0.06320.474881
200.0478180.43830.331162
210.0098840.09060.464016
22-0.004125-0.03780.484965
23-0.050666-0.46440.321794
24-0.038289-0.35090.363263
25-0.035534-0.32570.372739
26-0.10998-1.0080.158178
27-0.183853-1.6850.047846
28-0.013669-0.12530.4503
29-0.067814-0.62150.267967
30-0.054575-0.50020.309126
31-0.007099-0.06510.47414
320.0009310.00850.496606
33-0.003328-0.03050.487871
340.0056080.05140.479565
350.0316120.28970.38637
36-0.008522-0.07810.468964
37-0.007384-0.06770.473103
38-0.041653-0.38180.351804
39-0.086537-0.79310.214969
40-0.104153-0.95460.171264
41-0.23035-2.11120.018864
420.2414152.21260.014819
430.0053670.04920.480441
440.1232951.130.130842
45-0.026273-0.24080.405149
46-0.040348-0.36980.356232
47-0.05201-0.47670.317415
480.0033620.03080.487746
490.0178720.16380.435139
50-0.012755-0.11690.453608
51-0.006309-0.05780.477014
520.0028480.02610.48962
530.0205770.18860.425435
540.0323410.29640.383823
55-0.036241-0.33210.370302
56-0.085091-0.77990.21883
570.0777420.71250.239058
580.0380690.34890.364017
590.0542990.49770.310012
60-0.007029-0.06440.474395


Parameters (Session):
par1 = 60 ; par2 = 1 ; par3 = 0 ; par4 = 0 ; par5 = 12 ; par6 = White Noise ; par7 = 0.95 ;
Parameters (R input):
par1 = 60 ; par2 = 1 ; par3 = 0 ; par4 = 0 ; par5 = 12 ; par6 = White Noise ; par7 = 0.95 ; par8 = ;
R code (references can be found in the software module):
if (par1 == 'Default') {
par1 = 10*log10(length(x))
} else {
par1 <- as.numeric(par1)
}
par2 <- as.numeric(par2)
par3 <- as.numeric(par3)
par4 <- as.numeric(par4)
par5 <- as.numeric(par5)
if (par6 == 'White Noise') par6 <- 'white' else par6 <- 'ma'
par7 <- as.numeric(par7)
if (par8 != '') par8 <- as.numeric(par8)
ox <- x
if (par8 == '') {
if (par2 == 0) {
x <- log(x)
} else {
x <- (x ^ par2 - 1) / par2
}
} else {
x <- log(x,base=par8)
}
if (par3 > 0) x <- diff(x,lag=1,difference=par3)
if (par4 > 0) x <- diff(x,lag=par5,difference=par4)
bitmap(file='picts.png')
op <- par(mfrow=c(2,1))
plot(ox,type='l',main='Original Time Series',xlab='time',ylab='value')
if (par8=='') {
mytitle <- paste('Working Time Series (lambda=',par2,', d=',par3,', D=',par4,')',sep='')
mysub <- paste('(lambda=',par2,', d=',par3,', D=',par4,', CI=', par7, ', CI type=',par6,')',sep='')
} else {
mytitle <- paste('Working Time Series (base=',par8,', d=',par3,', D=',par4,')',sep='')
mysub <- paste('(base=',par8,', d=',par3,', D=',par4,', CI=', par7, ', CI type=',par6,')',sep='')
}
plot(x,type='l', main=mytitle,xlab='time',ylab='value')
par(op)
dev.off()
bitmap(file='pic1.png')
racf <- acf(x, par1, main='Autocorrelation', xlab='time lag', ylab='ACF', ci.type=par6, ci=par7, sub=mysub)
dev.off()
bitmap(file='pic2.png')
rpacf <- pacf(x,par1,main='Partial Autocorrelation',xlab='lags',ylab='PACF',sub=mysub)
dev.off()
(myacf <- c(racf$acf))
(mypacf <- c(rpacf$acf))
lengthx <- length(x)
sqrtn <- sqrt(lengthx)
load(file='createtable')
a<-table.start()
a<-table.row.start(a)
a<-table.element(a,'Autocorrelation Function',4,TRUE)
a<-table.row.end(a)
a<-table.row.start(a)
a<-table.element(a,'Time lag k',header=TRUE)
a<-table.element(a,hyperlink('basics.htm','ACF(k)','click here for more information about the Autocorrelation Function'),header=TRUE)
a<-table.element(a,'T-STAT',header=TRUE)
a<-table.element(a,'P-value',header=TRUE)
a<-table.row.end(a)
for (i in 2:(par1+1)) {
a<-table.row.start(a)
a<-table.element(a,i-1,header=TRUE)
a<-table.element(a,round(myacf[i],6))
mytstat <- myacf[i]*sqrtn
a<-table.element(a,round(mytstat,4))
a<-table.element(a,round(1-pt(abs(mytstat),lengthx),6))
a<-table.row.end(a)
}
a<-table.end(a)
table.save(a,file='mytable.tab')
a<-table.start()
a<-table.row.start(a)
a<-table.element(a,'Partial Autocorrelation Function',4,TRUE)
a<-table.row.end(a)
a<-table.row.start(a)
a<-table.element(a,'Time lag k',header=TRUE)
a<-table.element(a,hyperlink('basics.htm','PACF(k)','click here for more information about the Partial Autocorrelation Function'),header=TRUE)
a<-table.element(a,'T-STAT',header=TRUE)
a<-table.element(a,'P-value',header=TRUE)
a<-table.row.end(a)
for (i in 1:par1) {
a<-table.row.start(a)
a<-table.element(a,i,header=TRUE)
a<-table.element(a,round(mypacf[i],6))
mytstat <- mypacf[i]*sqrtn
a<-table.element(a,round(mytstat,4))
a<-table.element(a,round(1-pt(abs(mytstat),lengthx),6))
a<-table.row.end(a)
}
a<-table.end(a)
table.save(a,file='mytable1.tab')