Free Statistics

of Irreproducible Research!

Author's title

Author*Unverified author*
R Software Modulerwasp_autocorrelation.wasp
Title produced by software(Partial) Autocorrelation Function
Date of computationMon, 18 Nov 2013 05:00:23 -0500
Cite this page as followsStatistical Computations at FreeStatistics.org, Office for Research Development and Education, URL https://freestatistics.org/blog/index.php?v=date/2013/Nov/18/t13847688691elyobgxrlpe3k6.htm/, Retrieved Sat, 27 Apr 2024 13:03:12 +0000
Statistical Computations at FreeStatistics.org, Office for Research Development and Education, URL https://freestatistics.org/blog/index.php?pk=225980, Retrieved Sat, 27 Apr 2024 13:03:12 +0000
QR Codes:

Original text written by user:
IsPrivate?No (this computation is public)
User-defined keywords
Estimated Impact59
Family? (F = Feedback message, R = changed R code, M = changed R Module, P = changed Parameters, D = changed Data)
-       [(Partial) Autocorrelation Function] [] [2013-11-18 10:00:23] [f1eb0c717bff20e026fad887906ea64a] [Current]
Feedback Forum

Post a new message
Dataseries X:
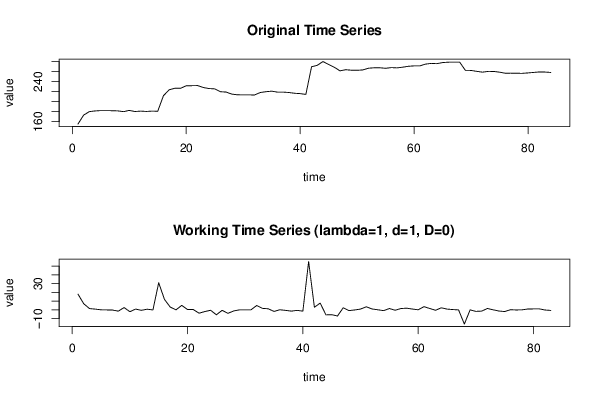
155.28
173.24
180.16
181.52
182.25
182.19
182
181.65
180.07
182.62
180.38
181.15
180.5
181.14
180.93
211.91
223.81
226.88
226.8
231.81
232.06
232.32
228.37
226.31
225.72
219.98
219.31
215.19
213.81
213.7
213.6
213.52
218.39
219.97
221.09
219.17
219.17
218.45
216.88
216.19
214.59
269.87
272.71
280.35
274.5
268.86
261.7
263.98
263.01
262.79
263.59
267
267.89
267.86
266.84
268.24
267.67
269.07
270.87
271.68
271.63
275.21
276.66
276.08
278.3
279.06
279.28
279.12
262.72
262.55
260.7
259.14
260.61
260.53
259.07
257.01
257.08
256.83
256.75
257.61
258.58
259.57
259.29
258.51


Summary of computational transaction
Raw Inputview raw input (R code)
Raw Outputview raw output of R engine
Computing time3 seconds
R Server'Gwilym Jenkins' @ jenkins.wessa.net

\begin{tabular}{lllllllll}
\hline
Summary of computational transaction \tabularnewline
Raw Input & view raw input (R code)  \tabularnewline
Raw Output & view raw output of R engine  \tabularnewline
Computing time & 3 seconds \tabularnewline
R Server & 'Gwilym Jenkins' @ jenkins.wessa.net \tabularnewline
\hline
\end{tabular}
%Source: https://freestatistics.org/blog/index.php?pk=225980&T=0

[TABLE]
[ROW][C]Summary of computational transaction[/C][/ROW]
[ROW][C]Raw Input[/C][C]view raw input (R code) [/C][/ROW]
[ROW][C]Raw Output[/C][C]view raw output of R engine [/C][/ROW]
[ROW][C]Computing time[/C][C]3 seconds[/C][/ROW]
[ROW][C]R Server[/C][C]'Gwilym Jenkins' @ jenkins.wessa.net[/C][/ROW]
[/TABLE]
Source: https://freestatistics.org/blog/index.php?pk=225980&T=0

Globally Unique Identifier (entire table): ba.freestatistics.org/blog/index.php?pk=225980&T=0

As an alternative you can also use a QR Code:  

The GUIDs for individual cells are displayed in the table below:

Summary of computational transaction
Raw Inputview raw input (R code)
Raw Outputview raw output of R engine
Computing time3 seconds
R Server'Gwilym Jenkins' @ jenkins.wessa.net


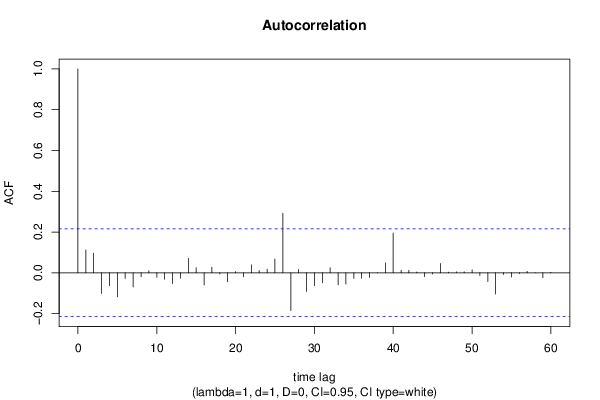
Autocorrelation Function
Time lag kACF(k)T-STATP-value
10.1122951.02310.154626
20.0962990.87730.191422
3-0.101665-0.92620.17851
4-0.063348-0.57710.282709
5-0.117355-1.06920.144049
6-0.027476-0.25030.401478
7-0.069899-0.63680.263001
8-0.019238-0.17530.43065
90.0104290.0950.462267
10-0.021975-0.20020.420905
11-0.031931-0.29090.385925
12-0.052919-0.48210.315498
13-0.02631-0.23970.405579
140.070620.64340.260875
150.0246460.22450.411445
16-0.059221-0.53950.295483
170.0274850.25040.401448
18-0.005977-0.05450.478351
19-0.044067-0.40150.344554
200.0062030.05650.477535
21-0.019271-0.17560.430532
220.0388540.3540.362125
230.0116740.10640.457778
240.0175160.15960.436802
250.0672210.61240.270969
260.2920332.66050.004681
27-0.185367-1.68880.047508
280.0159120.1450.442546
29-0.092171-0.83970.201739
30-0.063526-0.57880.282162
31-0.048835-0.44490.328772
320.0241040.21960.413363
33-0.059042-0.53790.296044
34-0.05519-0.50280.308217
35-0.027285-0.24860.402152
36-0.026078-0.23760.406394
37-0.02315-0.21090.416738
389.5e-059e-040.499655
390.0485450.44230.329723
400.1951661.7780.039529
410.0123890.11290.455202
420.0126870.11560.454129
430.0039250.03580.485779
44-0.018655-0.170.432731
45-0.005829-0.05310.478887
460.04550.41450.33978
470.0031650.02880.488531
480.0044620.04070.483835
490.0052410.04770.481016
500.0145440.13250.447455
51-0.012947-0.11790.453196
52-0.042611-0.38820.34943
53-0.103968-0.94720.173144
54-0.0082-0.07470.470313
55-0.020449-0.18630.426331
56-0.003909-0.03560.485838
570.0071780.06540.474008
586.6e-056e-040.49976
59-0.024007-0.21870.413705
600.0020030.01830.492741

\begin{tabular}{lllllllll}
\hline
Autocorrelation Function \tabularnewline
Time lag k & ACF(k) & T-STAT & P-value \tabularnewline
1 & 0.112295 & 1.0231 & 0.154626 \tabularnewline
2 & 0.096299 & 0.8773 & 0.191422 \tabularnewline
3 & -0.101665 & -0.9262 & 0.17851 \tabularnewline
4 & -0.063348 & -0.5771 & 0.282709 \tabularnewline
5 & -0.117355 & -1.0692 & 0.144049 \tabularnewline
6 & -0.027476 & -0.2503 & 0.401478 \tabularnewline
7 & -0.069899 & -0.6368 & 0.263001 \tabularnewline
8 & -0.019238 & -0.1753 & 0.43065 \tabularnewline
9 & 0.010429 & 0.095 & 0.462267 \tabularnewline
10 & -0.021975 & -0.2002 & 0.420905 \tabularnewline
11 & -0.031931 & -0.2909 & 0.385925 \tabularnewline
12 & -0.052919 & -0.4821 & 0.315498 \tabularnewline
13 & -0.02631 & -0.2397 & 0.405579 \tabularnewline
14 & 0.07062 & 0.6434 & 0.260875 \tabularnewline
15 & 0.024646 & 0.2245 & 0.411445 \tabularnewline
16 & -0.059221 & -0.5395 & 0.295483 \tabularnewline
17 & 0.027485 & 0.2504 & 0.401448 \tabularnewline
18 & -0.005977 & -0.0545 & 0.478351 \tabularnewline
19 & -0.044067 & -0.4015 & 0.344554 \tabularnewline
20 & 0.006203 & 0.0565 & 0.477535 \tabularnewline
21 & -0.019271 & -0.1756 & 0.430532 \tabularnewline
22 & 0.038854 & 0.354 & 0.362125 \tabularnewline
23 & 0.011674 & 0.1064 & 0.457778 \tabularnewline
24 & 0.017516 & 0.1596 & 0.436802 \tabularnewline
25 & 0.067221 & 0.6124 & 0.270969 \tabularnewline
26 & 0.292033 & 2.6605 & 0.004681 \tabularnewline
27 & -0.185367 & -1.6888 & 0.047508 \tabularnewline
28 & 0.015912 & 0.145 & 0.442546 \tabularnewline
29 & -0.092171 & -0.8397 & 0.201739 \tabularnewline
30 & -0.063526 & -0.5788 & 0.282162 \tabularnewline
31 & -0.048835 & -0.4449 & 0.328772 \tabularnewline
32 & 0.024104 & 0.2196 & 0.413363 \tabularnewline
33 & -0.059042 & -0.5379 & 0.296044 \tabularnewline
34 & -0.05519 & -0.5028 & 0.308217 \tabularnewline
35 & -0.027285 & -0.2486 & 0.402152 \tabularnewline
36 & -0.026078 & -0.2376 & 0.406394 \tabularnewline
37 & -0.02315 & -0.2109 & 0.416738 \tabularnewline
38 & 9.5e-05 & 9e-04 & 0.499655 \tabularnewline
39 & 0.048545 & 0.4423 & 0.329723 \tabularnewline
40 & 0.195166 & 1.778 & 0.039529 \tabularnewline
41 & 0.012389 & 0.1129 & 0.455202 \tabularnewline
42 & 0.012687 & 0.1156 & 0.454129 \tabularnewline
43 & 0.003925 & 0.0358 & 0.485779 \tabularnewline
44 & -0.018655 & -0.17 & 0.432731 \tabularnewline
45 & -0.005829 & -0.0531 & 0.478887 \tabularnewline
46 & 0.0455 & 0.4145 & 0.33978 \tabularnewline
47 & 0.003165 & 0.0288 & 0.488531 \tabularnewline
48 & 0.004462 & 0.0407 & 0.483835 \tabularnewline
49 & 0.005241 & 0.0477 & 0.481016 \tabularnewline
50 & 0.014544 & 0.1325 & 0.447455 \tabularnewline
51 & -0.012947 & -0.1179 & 0.453196 \tabularnewline
52 & -0.042611 & -0.3882 & 0.34943 \tabularnewline
53 & -0.103968 & -0.9472 & 0.173144 \tabularnewline
54 & -0.0082 & -0.0747 & 0.470313 \tabularnewline
55 & -0.020449 & -0.1863 & 0.426331 \tabularnewline
56 & -0.003909 & -0.0356 & 0.485838 \tabularnewline
57 & 0.007178 & 0.0654 & 0.474008 \tabularnewline
58 & 6.6e-05 & 6e-04 & 0.49976 \tabularnewline
59 & -0.024007 & -0.2187 & 0.413705 \tabularnewline
60 & 0.002003 & 0.0183 & 0.492741 \tabularnewline
\hline
\end{tabular}
%Source: https://freestatistics.org/blog/index.php?pk=225980&T=1

[TABLE]
[ROW][C]Autocorrelation Function[/C][/ROW]
[ROW][C]Time lag k[/C][C]ACF(k)[/C][C]T-STAT[/C][C]P-value[/C][/ROW]
[ROW][C]1[/C][C]0.112295[/C][C]1.0231[/C][C]0.154626[/C][/ROW]
[ROW][C]2[/C][C]0.096299[/C][C]0.8773[/C][C]0.191422[/C][/ROW]
[ROW][C]3[/C][C]-0.101665[/C][C]-0.9262[/C][C]0.17851[/C][/ROW]
[ROW][C]4[/C][C]-0.063348[/C][C]-0.5771[/C][C]0.282709[/C][/ROW]
[ROW][C]5[/C][C]-0.117355[/C][C]-1.0692[/C][C]0.144049[/C][/ROW]
[ROW][C]6[/C][C]-0.027476[/C][C]-0.2503[/C][C]0.401478[/C][/ROW]
[ROW][C]7[/C][C]-0.069899[/C][C]-0.6368[/C][C]0.263001[/C][/ROW]
[ROW][C]8[/C][C]-0.019238[/C][C]-0.1753[/C][C]0.43065[/C][/ROW]
[ROW][C]9[/C][C]0.010429[/C][C]0.095[/C][C]0.462267[/C][/ROW]
[ROW][C]10[/C][C]-0.021975[/C][C]-0.2002[/C][C]0.420905[/C][/ROW]
[ROW][C]11[/C][C]-0.031931[/C][C]-0.2909[/C][C]0.385925[/C][/ROW]
[ROW][C]12[/C][C]-0.052919[/C][C]-0.4821[/C][C]0.315498[/C][/ROW]
[ROW][C]13[/C][C]-0.02631[/C][C]-0.2397[/C][C]0.405579[/C][/ROW]
[ROW][C]14[/C][C]0.07062[/C][C]0.6434[/C][C]0.260875[/C][/ROW]
[ROW][C]15[/C][C]0.024646[/C][C]0.2245[/C][C]0.411445[/C][/ROW]
[ROW][C]16[/C][C]-0.059221[/C][C]-0.5395[/C][C]0.295483[/C][/ROW]
[ROW][C]17[/C][C]0.027485[/C][C]0.2504[/C][C]0.401448[/C][/ROW]
[ROW][C]18[/C][C]-0.005977[/C][C]-0.0545[/C][C]0.478351[/C][/ROW]
[ROW][C]19[/C][C]-0.044067[/C][C]-0.4015[/C][C]0.344554[/C][/ROW]
[ROW][C]20[/C][C]0.006203[/C][C]0.0565[/C][C]0.477535[/C][/ROW]
[ROW][C]21[/C][C]-0.019271[/C][C]-0.1756[/C][C]0.430532[/C][/ROW]
[ROW][C]22[/C][C]0.038854[/C][C]0.354[/C][C]0.362125[/C][/ROW]
[ROW][C]23[/C][C]0.011674[/C][C]0.1064[/C][C]0.457778[/C][/ROW]
[ROW][C]24[/C][C]0.017516[/C][C]0.1596[/C][C]0.436802[/C][/ROW]
[ROW][C]25[/C][C]0.067221[/C][C]0.6124[/C][C]0.270969[/C][/ROW]
[ROW][C]26[/C][C]0.292033[/C][C]2.6605[/C][C]0.004681[/C][/ROW]
[ROW][C]27[/C][C]-0.185367[/C][C]-1.6888[/C][C]0.047508[/C][/ROW]
[ROW][C]28[/C][C]0.015912[/C][C]0.145[/C][C]0.442546[/C][/ROW]
[ROW][C]29[/C][C]-0.092171[/C][C]-0.8397[/C][C]0.201739[/C][/ROW]
[ROW][C]30[/C][C]-0.063526[/C][C]-0.5788[/C][C]0.282162[/C][/ROW]
[ROW][C]31[/C][C]-0.048835[/C][C]-0.4449[/C][C]0.328772[/C][/ROW]
[ROW][C]32[/C][C]0.024104[/C][C]0.2196[/C][C]0.413363[/C][/ROW]
[ROW][C]33[/C][C]-0.059042[/C][C]-0.5379[/C][C]0.296044[/C][/ROW]
[ROW][C]34[/C][C]-0.05519[/C][C]-0.5028[/C][C]0.308217[/C][/ROW]
[ROW][C]35[/C][C]-0.027285[/C][C]-0.2486[/C][C]0.402152[/C][/ROW]
[ROW][C]36[/C][C]-0.026078[/C][C]-0.2376[/C][C]0.406394[/C][/ROW]
[ROW][C]37[/C][C]-0.02315[/C][C]-0.2109[/C][C]0.416738[/C][/ROW]
[ROW][C]38[/C][C]9.5e-05[/C][C]9e-04[/C][C]0.499655[/C][/ROW]
[ROW][C]39[/C][C]0.048545[/C][C]0.4423[/C][C]0.329723[/C][/ROW]
[ROW][C]40[/C][C]0.195166[/C][C]1.778[/C][C]0.039529[/C][/ROW]
[ROW][C]41[/C][C]0.012389[/C][C]0.1129[/C][C]0.455202[/C][/ROW]
[ROW][C]42[/C][C]0.012687[/C][C]0.1156[/C][C]0.454129[/C][/ROW]
[ROW][C]43[/C][C]0.003925[/C][C]0.0358[/C][C]0.485779[/C][/ROW]
[ROW][C]44[/C][C]-0.018655[/C][C]-0.17[/C][C]0.432731[/C][/ROW]
[ROW][C]45[/C][C]-0.005829[/C][C]-0.0531[/C][C]0.478887[/C][/ROW]
[ROW][C]46[/C][C]0.0455[/C][C]0.4145[/C][C]0.33978[/C][/ROW]
[ROW][C]47[/C][C]0.003165[/C][C]0.0288[/C][C]0.488531[/C][/ROW]
[ROW][C]48[/C][C]0.004462[/C][C]0.0407[/C][C]0.483835[/C][/ROW]
[ROW][C]49[/C][C]0.005241[/C][C]0.0477[/C][C]0.481016[/C][/ROW]
[ROW][C]50[/C][C]0.014544[/C][C]0.1325[/C][C]0.447455[/C][/ROW]
[ROW][C]51[/C][C]-0.012947[/C][C]-0.1179[/C][C]0.453196[/C][/ROW]
[ROW][C]52[/C][C]-0.042611[/C][C]-0.3882[/C][C]0.34943[/C][/ROW]
[ROW][C]53[/C][C]-0.103968[/C][C]-0.9472[/C][C]0.173144[/C][/ROW]
[ROW][C]54[/C][C]-0.0082[/C][C]-0.0747[/C][C]0.470313[/C][/ROW]
[ROW][C]55[/C][C]-0.020449[/C][C]-0.1863[/C][C]0.426331[/C][/ROW]
[ROW][C]56[/C][C]-0.003909[/C][C]-0.0356[/C][C]0.485838[/C][/ROW]
[ROW][C]57[/C][C]0.007178[/C][C]0.0654[/C][C]0.474008[/C][/ROW]
[ROW][C]58[/C][C]6.6e-05[/C][C]6e-04[/C][C]0.49976[/C][/ROW]
[ROW][C]59[/C][C]-0.024007[/C][C]-0.2187[/C][C]0.413705[/C][/ROW]
[ROW][C]60[/C][C]0.002003[/C][C]0.0183[/C][C]0.492741[/C][/ROW]
[/TABLE]
Source: https://freestatistics.org/blog/index.php?pk=225980&T=1

Globally Unique Identifier (entire table): ba.freestatistics.org/blog/index.php?pk=225980&T=1

As an alternative you can also use a QR Code:  

The GUIDs for individual cells are displayed in the table below:

Autocorrelation Function
Time lag kACF(k)T-STATP-value
10.1122951.02310.154626
20.0962990.87730.191422
3-0.101665-0.92620.17851
4-0.063348-0.57710.282709
5-0.117355-1.06920.144049
6-0.027476-0.25030.401478
7-0.069899-0.63680.263001
8-0.019238-0.17530.43065
90.0104290.0950.462267
10-0.021975-0.20020.420905
11-0.031931-0.29090.385925
12-0.052919-0.48210.315498
13-0.02631-0.23970.405579
140.070620.64340.260875
150.0246460.22450.411445
16-0.059221-0.53950.295483
170.0274850.25040.401448
18-0.005977-0.05450.478351
19-0.044067-0.40150.344554
200.0062030.05650.477535
21-0.019271-0.17560.430532
220.0388540.3540.362125
230.0116740.10640.457778
240.0175160.15960.436802
250.0672210.61240.270969
260.2920332.66050.004681
27-0.185367-1.68880.047508
280.0159120.1450.442546
29-0.092171-0.83970.201739
30-0.063526-0.57880.282162
31-0.048835-0.44490.328772
320.0241040.21960.413363
33-0.059042-0.53790.296044
34-0.05519-0.50280.308217
35-0.027285-0.24860.402152
36-0.026078-0.23760.406394
37-0.02315-0.21090.416738
389.5e-059e-040.499655
390.0485450.44230.329723
400.1951661.7780.039529
410.0123890.11290.455202
420.0126870.11560.454129
430.0039250.03580.485779
44-0.018655-0.170.432731
45-0.005829-0.05310.478887
460.04550.41450.33978
470.0031650.02880.488531
480.0044620.04070.483835
490.0052410.04770.481016
500.0145440.13250.447455
51-0.012947-0.11790.453196
52-0.042611-0.38820.34943
53-0.103968-0.94720.173144
54-0.0082-0.07470.470313
55-0.020449-0.18630.426331
56-0.003909-0.03560.485838
570.0071780.06540.474008
586.6e-056e-040.49976
59-0.024007-0.21870.413705
600.0020030.01830.492741


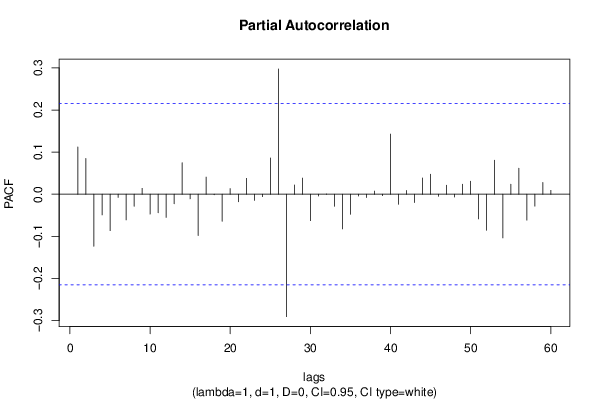
Partial Autocorrelation Function
Time lag kPACF(k)T-STATP-value
10.1122951.02310.154626
20.0847570.77220.221102
3-0.123514-1.12530.131859
4-0.049049-0.44690.328072
5-0.086503-0.78810.216446
6-0.007443-0.06780.473049
7-0.060861-0.55450.290374
8-0.028375-0.25850.398328
90.0140220.12780.449328
10-0.047162-0.42970.334277
11-0.043799-0.3990.345449
12-0.055024-0.50130.308746
13-0.022637-0.20620.418558
140.0748570.6820.248575
15-0.010943-0.09970.460412
16-0.098016-0.8930.187228
170.040690.37070.355901
18-0.00134-0.01220.495146
19-0.064123-0.58420.280338
200.013310.12130.451889
21-0.01784-0.16250.435641
220.0376420.34290.366258
23-0.014562-0.13270.447391
24-0.00578-0.05270.479065
250.0860660.78410.217606
260.297572.7110.004075
27-0.290731-2.64870.004835
280.0219860.20030.420869
290.0383660.34950.363788
30-0.062746-0.57160.284555
31-0.004113-0.03750.4851
320.0007390.00670.497322
33-0.028413-0.25890.398193
34-0.082256-0.74940.22787
35-0.047669-0.43430.332603
36-0.004392-0.040.48409
37-0.007781-0.07090.471828
380.0073630.06710.473341
39-0.003361-0.03060.487825
400.1428171.30110.098409
41-0.023699-0.21590.414796
420.0089830.08180.467487
43-0.019472-0.17740.429812
440.0386620.35220.362782
450.0474080.43190.333464
46-0.004924-0.04490.482163
470.0215090.1960.422563
48-0.006537-0.05960.476328
490.023550.21460.41532
500.0309540.2820.389321
51-0.058502-0.5330.297735
52-0.085462-0.77860.219217
530.0807520.73570.231999
54-0.10375-0.94520.173647
550.023840.21720.414297
560.0615780.5610.288154
57-0.061467-0.560.288496
58-0.028275-0.25760.398679
590.0280790.25580.399366
600.0092750.08450.466431

\begin{tabular}{lllllllll}
\hline
Partial Autocorrelation Function \tabularnewline
Time lag k & PACF(k) & T-STAT & P-value \tabularnewline
1 & 0.112295 & 1.0231 & 0.154626 \tabularnewline
2 & 0.084757 & 0.7722 & 0.221102 \tabularnewline
3 & -0.123514 & -1.1253 & 0.131859 \tabularnewline
4 & -0.049049 & -0.4469 & 0.328072 \tabularnewline
5 & -0.086503 & -0.7881 & 0.216446 \tabularnewline
6 & -0.007443 & -0.0678 & 0.473049 \tabularnewline
7 & -0.060861 & -0.5545 & 0.290374 \tabularnewline
8 & -0.028375 & -0.2585 & 0.398328 \tabularnewline
9 & 0.014022 & 0.1278 & 0.449328 \tabularnewline
10 & -0.047162 & -0.4297 & 0.334277 \tabularnewline
11 & -0.043799 & -0.399 & 0.345449 \tabularnewline
12 & -0.055024 & -0.5013 & 0.308746 \tabularnewline
13 & -0.022637 & -0.2062 & 0.418558 \tabularnewline
14 & 0.074857 & 0.682 & 0.248575 \tabularnewline
15 & -0.010943 & -0.0997 & 0.460412 \tabularnewline
16 & -0.098016 & -0.893 & 0.187228 \tabularnewline
17 & 0.04069 & 0.3707 & 0.355901 \tabularnewline
18 & -0.00134 & -0.0122 & 0.495146 \tabularnewline
19 & -0.064123 & -0.5842 & 0.280338 \tabularnewline
20 & 0.01331 & 0.1213 & 0.451889 \tabularnewline
21 & -0.01784 & -0.1625 & 0.435641 \tabularnewline
22 & 0.037642 & 0.3429 & 0.366258 \tabularnewline
23 & -0.014562 & -0.1327 & 0.447391 \tabularnewline
24 & -0.00578 & -0.0527 & 0.479065 \tabularnewline
25 & 0.086066 & 0.7841 & 0.217606 \tabularnewline
26 & 0.29757 & 2.711 & 0.004075 \tabularnewline
27 & -0.290731 & -2.6487 & 0.004835 \tabularnewline
28 & 0.021986 & 0.2003 & 0.420869 \tabularnewline
29 & 0.038366 & 0.3495 & 0.363788 \tabularnewline
30 & -0.062746 & -0.5716 & 0.284555 \tabularnewline
31 & -0.004113 & -0.0375 & 0.4851 \tabularnewline
32 & 0.000739 & 0.0067 & 0.497322 \tabularnewline
33 & -0.028413 & -0.2589 & 0.398193 \tabularnewline
34 & -0.082256 & -0.7494 & 0.22787 \tabularnewline
35 & -0.047669 & -0.4343 & 0.332603 \tabularnewline
36 & -0.004392 & -0.04 & 0.48409 \tabularnewline
37 & -0.007781 & -0.0709 & 0.471828 \tabularnewline
38 & 0.007363 & 0.0671 & 0.473341 \tabularnewline
39 & -0.003361 & -0.0306 & 0.487825 \tabularnewline
40 & 0.142817 & 1.3011 & 0.098409 \tabularnewline
41 & -0.023699 & -0.2159 & 0.414796 \tabularnewline
42 & 0.008983 & 0.0818 & 0.467487 \tabularnewline
43 & -0.019472 & -0.1774 & 0.429812 \tabularnewline
44 & 0.038662 & 0.3522 & 0.362782 \tabularnewline
45 & 0.047408 & 0.4319 & 0.333464 \tabularnewline
46 & -0.004924 & -0.0449 & 0.482163 \tabularnewline
47 & 0.021509 & 0.196 & 0.422563 \tabularnewline
48 & -0.006537 & -0.0596 & 0.476328 \tabularnewline
49 & 0.02355 & 0.2146 & 0.41532 \tabularnewline
50 & 0.030954 & 0.282 & 0.389321 \tabularnewline
51 & -0.058502 & -0.533 & 0.297735 \tabularnewline
52 & -0.085462 & -0.7786 & 0.219217 \tabularnewline
53 & 0.080752 & 0.7357 & 0.231999 \tabularnewline
54 & -0.10375 & -0.9452 & 0.173647 \tabularnewline
55 & 0.02384 & 0.2172 & 0.414297 \tabularnewline
56 & 0.061578 & 0.561 & 0.288154 \tabularnewline
57 & -0.061467 & -0.56 & 0.288496 \tabularnewline
58 & -0.028275 & -0.2576 & 0.398679 \tabularnewline
59 & 0.028079 & 0.2558 & 0.399366 \tabularnewline
60 & 0.009275 & 0.0845 & 0.466431 \tabularnewline
\hline
\end{tabular}
%Source: https://freestatistics.org/blog/index.php?pk=225980&T=2

[TABLE]
[ROW][C]Partial Autocorrelation Function[/C][/ROW]
[ROW][C]Time lag k[/C][C]PACF(k)[/C][C]T-STAT[/C][C]P-value[/C][/ROW]
[ROW][C]1[/C][C]0.112295[/C][C]1.0231[/C][C]0.154626[/C][/ROW]
[ROW][C]2[/C][C]0.084757[/C][C]0.7722[/C][C]0.221102[/C][/ROW]
[ROW][C]3[/C][C]-0.123514[/C][C]-1.1253[/C][C]0.131859[/C][/ROW]
[ROW][C]4[/C][C]-0.049049[/C][C]-0.4469[/C][C]0.328072[/C][/ROW]
[ROW][C]5[/C][C]-0.086503[/C][C]-0.7881[/C][C]0.216446[/C][/ROW]
[ROW][C]6[/C][C]-0.007443[/C][C]-0.0678[/C][C]0.473049[/C][/ROW]
[ROW][C]7[/C][C]-0.060861[/C][C]-0.5545[/C][C]0.290374[/C][/ROW]
[ROW][C]8[/C][C]-0.028375[/C][C]-0.2585[/C][C]0.398328[/C][/ROW]
[ROW][C]9[/C][C]0.014022[/C][C]0.1278[/C][C]0.449328[/C][/ROW]
[ROW][C]10[/C][C]-0.047162[/C][C]-0.4297[/C][C]0.334277[/C][/ROW]
[ROW][C]11[/C][C]-0.043799[/C][C]-0.399[/C][C]0.345449[/C][/ROW]
[ROW][C]12[/C][C]-0.055024[/C][C]-0.5013[/C][C]0.308746[/C][/ROW]
[ROW][C]13[/C][C]-0.022637[/C][C]-0.2062[/C][C]0.418558[/C][/ROW]
[ROW][C]14[/C][C]0.074857[/C][C]0.682[/C][C]0.248575[/C][/ROW]
[ROW][C]15[/C][C]-0.010943[/C][C]-0.0997[/C][C]0.460412[/C][/ROW]
[ROW][C]16[/C][C]-0.098016[/C][C]-0.893[/C][C]0.187228[/C][/ROW]
[ROW][C]17[/C][C]0.04069[/C][C]0.3707[/C][C]0.355901[/C][/ROW]
[ROW][C]18[/C][C]-0.00134[/C][C]-0.0122[/C][C]0.495146[/C][/ROW]
[ROW][C]19[/C][C]-0.064123[/C][C]-0.5842[/C][C]0.280338[/C][/ROW]
[ROW][C]20[/C][C]0.01331[/C][C]0.1213[/C][C]0.451889[/C][/ROW]
[ROW][C]21[/C][C]-0.01784[/C][C]-0.1625[/C][C]0.435641[/C][/ROW]
[ROW][C]22[/C][C]0.037642[/C][C]0.3429[/C][C]0.366258[/C][/ROW]
[ROW][C]23[/C][C]-0.014562[/C][C]-0.1327[/C][C]0.447391[/C][/ROW]
[ROW][C]24[/C][C]-0.00578[/C][C]-0.0527[/C][C]0.479065[/C][/ROW]
[ROW][C]25[/C][C]0.086066[/C][C]0.7841[/C][C]0.217606[/C][/ROW]
[ROW][C]26[/C][C]0.29757[/C][C]2.711[/C][C]0.004075[/C][/ROW]
[ROW][C]27[/C][C]-0.290731[/C][C]-2.6487[/C][C]0.004835[/C][/ROW]
[ROW][C]28[/C][C]0.021986[/C][C]0.2003[/C][C]0.420869[/C][/ROW]
[ROW][C]29[/C][C]0.038366[/C][C]0.3495[/C][C]0.363788[/C][/ROW]
[ROW][C]30[/C][C]-0.062746[/C][C]-0.5716[/C][C]0.284555[/C][/ROW]
[ROW][C]31[/C][C]-0.004113[/C][C]-0.0375[/C][C]0.4851[/C][/ROW]
[ROW][C]32[/C][C]0.000739[/C][C]0.0067[/C][C]0.497322[/C][/ROW]
[ROW][C]33[/C][C]-0.028413[/C][C]-0.2589[/C][C]0.398193[/C][/ROW]
[ROW][C]34[/C][C]-0.082256[/C][C]-0.7494[/C][C]0.22787[/C][/ROW]
[ROW][C]35[/C][C]-0.047669[/C][C]-0.4343[/C][C]0.332603[/C][/ROW]
[ROW][C]36[/C][C]-0.004392[/C][C]-0.04[/C][C]0.48409[/C][/ROW]
[ROW][C]37[/C][C]-0.007781[/C][C]-0.0709[/C][C]0.471828[/C][/ROW]
[ROW][C]38[/C][C]0.007363[/C][C]0.0671[/C][C]0.473341[/C][/ROW]
[ROW][C]39[/C][C]-0.003361[/C][C]-0.0306[/C][C]0.487825[/C][/ROW]
[ROW][C]40[/C][C]0.142817[/C][C]1.3011[/C][C]0.098409[/C][/ROW]
[ROW][C]41[/C][C]-0.023699[/C][C]-0.2159[/C][C]0.414796[/C][/ROW]
[ROW][C]42[/C][C]0.008983[/C][C]0.0818[/C][C]0.467487[/C][/ROW]
[ROW][C]43[/C][C]-0.019472[/C][C]-0.1774[/C][C]0.429812[/C][/ROW]
[ROW][C]44[/C][C]0.038662[/C][C]0.3522[/C][C]0.362782[/C][/ROW]
[ROW][C]45[/C][C]0.047408[/C][C]0.4319[/C][C]0.333464[/C][/ROW]
[ROW][C]46[/C][C]-0.004924[/C][C]-0.0449[/C][C]0.482163[/C][/ROW]
[ROW][C]47[/C][C]0.021509[/C][C]0.196[/C][C]0.422563[/C][/ROW]
[ROW][C]48[/C][C]-0.006537[/C][C]-0.0596[/C][C]0.476328[/C][/ROW]
[ROW][C]49[/C][C]0.02355[/C][C]0.2146[/C][C]0.41532[/C][/ROW]
[ROW][C]50[/C][C]0.030954[/C][C]0.282[/C][C]0.389321[/C][/ROW]
[ROW][C]51[/C][C]-0.058502[/C][C]-0.533[/C][C]0.297735[/C][/ROW]
[ROW][C]52[/C][C]-0.085462[/C][C]-0.7786[/C][C]0.219217[/C][/ROW]
[ROW][C]53[/C][C]0.080752[/C][C]0.7357[/C][C]0.231999[/C][/ROW]
[ROW][C]54[/C][C]-0.10375[/C][C]-0.9452[/C][C]0.173647[/C][/ROW]
[ROW][C]55[/C][C]0.02384[/C][C]0.2172[/C][C]0.414297[/C][/ROW]
[ROW][C]56[/C][C]0.061578[/C][C]0.561[/C][C]0.288154[/C][/ROW]
[ROW][C]57[/C][C]-0.061467[/C][C]-0.56[/C][C]0.288496[/C][/ROW]
[ROW][C]58[/C][C]-0.028275[/C][C]-0.2576[/C][C]0.398679[/C][/ROW]
[ROW][C]59[/C][C]0.028079[/C][C]0.2558[/C][C]0.399366[/C][/ROW]
[ROW][C]60[/C][C]0.009275[/C][C]0.0845[/C][C]0.466431[/C][/ROW]
[/TABLE]
Source: https://freestatistics.org/blog/index.php?pk=225980&T=2

Globally Unique Identifier (entire table): ba.freestatistics.org/blog/index.php?pk=225980&T=2

As an alternative you can also use a QR Code:  

The GUIDs for individual cells are displayed in the table below:

Partial Autocorrelation Function
Time lag kPACF(k)T-STATP-value
10.1122951.02310.154626
20.0847570.77220.221102
3-0.123514-1.12530.131859
4-0.049049-0.44690.328072
5-0.086503-0.78810.216446
6-0.007443-0.06780.473049
7-0.060861-0.55450.290374
8-0.028375-0.25850.398328
90.0140220.12780.449328
10-0.047162-0.42970.334277
11-0.043799-0.3990.345449
12-0.055024-0.50130.308746
13-0.022637-0.20620.418558
140.0748570.6820.248575
15-0.010943-0.09970.460412
16-0.098016-0.8930.187228
170.040690.37070.355901
18-0.00134-0.01220.495146
19-0.064123-0.58420.280338
200.013310.12130.451889
21-0.01784-0.16250.435641
220.0376420.34290.366258
23-0.014562-0.13270.447391
24-0.00578-0.05270.479065
250.0860660.78410.217606
260.297572.7110.004075
27-0.290731-2.64870.004835
280.0219860.20030.420869
290.0383660.34950.363788
30-0.062746-0.57160.284555
31-0.004113-0.03750.4851
320.0007390.00670.497322
33-0.028413-0.25890.398193
34-0.082256-0.74940.22787
35-0.047669-0.43430.332603
36-0.004392-0.040.48409
37-0.007781-0.07090.471828
380.0073630.06710.473341
39-0.003361-0.03060.487825
400.1428171.30110.098409
41-0.023699-0.21590.414796
420.0089830.08180.467487
43-0.019472-0.17740.429812
440.0386620.35220.362782
450.0474080.43190.333464
46-0.004924-0.04490.482163
470.0215090.1960.422563
48-0.006537-0.05960.476328
490.023550.21460.41532
500.0309540.2820.389321
51-0.058502-0.5330.297735
52-0.085462-0.77860.219217
530.0807520.73570.231999
54-0.10375-0.94520.173647
550.023840.21720.414297
560.0615780.5610.288154
57-0.061467-0.560.288496
58-0.028275-0.25760.398679
590.0280790.25580.399366
600.0092750.08450.466431


Parameters (Session):
par1 = 60 ; par2 = 1 ; par3 = 1 ; par4 = 0 ; par5 = 12 ; par6 = White Noise ; par7 = 0.95 ;
Parameters (R input):
par1 = 60 ; par2 = 1 ; par3 = 1 ; par4 = 0 ; par5 = 12 ; par6 = White Noise ; par7 = 0.95 ; par8 = ;
R code (references can be found in the software module):
if (par1 == 'Default') {
par1 = 10*log10(length(x))
} else {
par1 <- as.numeric(par1)
}
par2 <- as.numeric(par2)
par3 <- as.numeric(par3)
par4 <- as.numeric(par4)
par5 <- as.numeric(par5)
if (par6 == 'White Noise') par6 <- 'white' else par6 <- 'ma'
par7 <- as.numeric(par7)
if (par8 != '') par8 <- as.numeric(par8)
ox <- x
if (par8 == '') {
if (par2 == 0) {
x <- log(x)
} else {
x <- (x ^ par2 - 1) / par2
}
} else {
x <- log(x,base=par8)
}
if (par3 > 0) x <- diff(x,lag=1,difference=par3)
if (par4 > 0) x <- diff(x,lag=par5,difference=par4)
bitmap(file='picts.png')
op <- par(mfrow=c(2,1))
plot(ox,type='l',main='Original Time Series',xlab='time',ylab='value')
if (par8=='') {
mytitle <- paste('Working Time Series (lambda=',par2,', d=',par3,', D=',par4,')',sep='')
mysub <- paste('(lambda=',par2,', d=',par3,', D=',par4,', CI=', par7, ', CI type=',par6,')',sep='')
} else {
mytitle <- paste('Working Time Series (base=',par8,', d=',par3,', D=',par4,')',sep='')
mysub <- paste('(base=',par8,', d=',par3,', D=',par4,', CI=', par7, ', CI type=',par6,')',sep='')
}
plot(x,type='l', main=mytitle,xlab='time',ylab='value')
par(op)
dev.off()
bitmap(file='pic1.png')
racf <- acf(x, par1, main='Autocorrelation', xlab='time lag', ylab='ACF', ci.type=par6, ci=par7, sub=mysub)
dev.off()
bitmap(file='pic2.png')
rpacf <- pacf(x,par1,main='Partial Autocorrelation',xlab='lags',ylab='PACF',sub=mysub)
dev.off()
(myacf <- c(racf$acf))
(mypacf <- c(rpacf$acf))
lengthx <- length(x)
sqrtn <- sqrt(lengthx)
load(file='createtable')
a<-table.start()
a<-table.row.start(a)
a<-table.element(a,'Autocorrelation Function',4,TRUE)
a<-table.row.end(a)
a<-table.row.start(a)
a<-table.element(a,'Time lag k',header=TRUE)
a<-table.element(a,hyperlink('basics.htm','ACF(k)','click here for more information about the Autocorrelation Function'),header=TRUE)
a<-table.element(a,'T-STAT',header=TRUE)
a<-table.element(a,'P-value',header=TRUE)
a<-table.row.end(a)
for (i in 2:(par1+1)) {
a<-table.row.start(a)
a<-table.element(a,i-1,header=TRUE)
a<-table.element(a,round(myacf[i],6))
mytstat <- myacf[i]*sqrtn
a<-table.element(a,round(mytstat,4))
a<-table.element(a,round(1-pt(abs(mytstat),lengthx),6))
a<-table.row.end(a)
}
a<-table.end(a)
table.save(a,file='mytable.tab')
a<-table.start()
a<-table.row.start(a)
a<-table.element(a,'Partial Autocorrelation Function',4,TRUE)
a<-table.row.end(a)
a<-table.row.start(a)
a<-table.element(a,'Time lag k',header=TRUE)
a<-table.element(a,hyperlink('basics.htm','PACF(k)','click here for more information about the Partial Autocorrelation Function'),header=TRUE)
a<-table.element(a,'T-STAT',header=TRUE)
a<-table.element(a,'P-value',header=TRUE)
a<-table.row.end(a)
for (i in 1:par1) {
a<-table.row.start(a)
a<-table.element(a,i,header=TRUE)
a<-table.element(a,round(mypacf[i],6))
mytstat <- mypacf[i]*sqrtn
a<-table.element(a,round(mytstat,4))
a<-table.element(a,round(1-pt(abs(mytstat),lengthx),6))
a<-table.row.end(a)
}
a<-table.end(a)
table.save(a,file='mytable1.tab')