Free Statistics

of Irreproducible Research!

Author's title

Author*Unverified author*
R Software Modulerwasp_autocorrelation.wasp
Title produced by software(Partial) Autocorrelation Function
Date of computationMon, 18 Nov 2013 06:18:11 -0500
Cite this page as followsStatistical Computations at FreeStatistics.org, Office for Research Development and Education, URL https://freestatistics.org/blog/index.php?v=date/2013/Nov/18/t1384773511f6vfaqmha4ehqkg.htm/, Retrieved Sat, 27 Apr 2024 07:25:46 +0000
Statistical Computations at FreeStatistics.org, Office for Research Development and Education, URL https://freestatistics.org/blog/index.php?pk=226007, Retrieved Sat, 27 Apr 2024 07:25:46 +0000
QR Codes:

Original text written by user:
IsPrivate?No (this computation is public)
User-defined keywords
Estimated Impact59
Family? (F = Feedback message, R = changed R code, M = changed R Module, P = changed Parameters, D = changed Data)
-       [(Partial) Autocorrelation Function] [] [2013-11-18 11:18:11] [a0fdb281759790a4896cd836cbe89967] [Current]
Feedback Forum

Post a new message
Dataseries X:
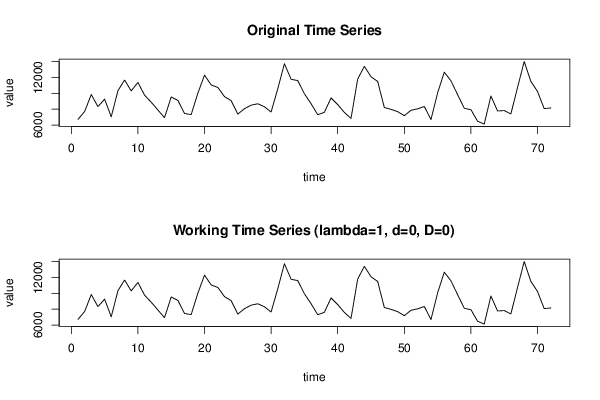
 6 715 
 7 703 
 9 856 
 8 326 
 9 269 
 7 035 
 10 342 
 11 682 
 10 304 
 11 385 
 9 777 
 8 882 
 7 897 
 6 930 
 9 545 
 9 110 
 7 459 
 7 320 
 10 017 
 12 307 
 11 072 
 10 749 
 9 589 
 9 080 
 7 384 
 8 062 
 8 511 
 8 684 
 8 306 
 7 643 
 10 577 
 13 747 
 11 783 
 11 611 
 9 946 
 8 693 
 7 303 
 7 609 
 9 423 
 8 584 
 7 586 
 6 843 
 11 811 
 13 414 
 12 103 
 11 501 
 8 213 
 7 982 
 7 687 
 7 180 
 7 862 
 8 043 
 8 340 
 6 692 
 10 065 
 12 684 
 11 587 
 9 843 
 8 110 
 7 940 
 6 475 
 6 121 
 9 669 
 7 778 
 7 826 
 7 403 
 10 741 
 14 023 
 11 519 
 10 236 
 8 075 
 8 157 


Summary of computational transaction
Raw Inputview raw input (R code)
Raw Outputview raw output of R engine
Computing time3 seconds
R Server'Gwilym Jenkins' @ jenkins.wessa.net

\begin{tabular}{lllllllll}
\hline
Summary of computational transaction \tabularnewline
Raw Input & view raw input (R code)  \tabularnewline
Raw Output & view raw output of R engine  \tabularnewline
Computing time & 3 seconds \tabularnewline
R Server & 'Gwilym Jenkins' @ jenkins.wessa.net \tabularnewline
\hline
\end{tabular}
%Source: https://freestatistics.org/blog/index.php?pk=226007&T=0

[TABLE]
[ROW][C]Summary of computational transaction[/C][/ROW]
[ROW][C]Raw Input[/C][C]view raw input (R code) [/C][/ROW]
[ROW][C]Raw Output[/C][C]view raw output of R engine [/C][/ROW]
[ROW][C]Computing time[/C][C]3 seconds[/C][/ROW]
[ROW][C]R Server[/C][C]'Gwilym Jenkins' @ jenkins.wessa.net[/C][/ROW]
[/TABLE]
Source: https://freestatistics.org/blog/index.php?pk=226007&T=0

Globally Unique Identifier (entire table): ba.freestatistics.org/blog/index.php?pk=226007&T=0

As an alternative you can also use a QR Code:  

The GUIDs for individual cells are displayed in the table below:

Summary of computational transaction
Raw Inputview raw input (R code)
Raw Outputview raw output of R engine
Computing time3 seconds
R Server'Gwilym Jenkins' @ jenkins.wessa.net


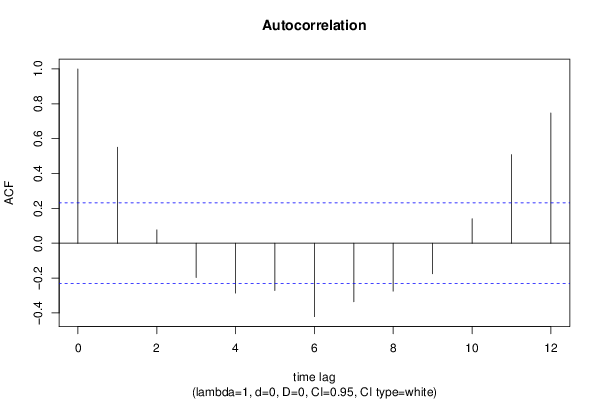
Autocorrelation Function
Time lag kACF(k)T-STATP-value
10.5511464.67667e-06
20.0767140.65090.258579
3-0.19625-1.66520.050106
4-0.286128-2.42790.008844
5-0.271716-2.30560.012009
6-0.421235-3.57430.000316
7-0.335881-2.850.002849
8-0.274947-2.3330.011223
9-0.175475-1.4890.070433
100.1405111.19230.118534
110.5082864.3132.5e-05
120.7470626.3390

\begin{tabular}{lllllllll}
\hline
Autocorrelation Function \tabularnewline
Time lag k & ACF(k) & T-STAT & P-value \tabularnewline
1 & 0.551146 & 4.6766 & 7e-06 \tabularnewline
2 & 0.076714 & 0.6509 & 0.258579 \tabularnewline
3 & -0.19625 & -1.6652 & 0.050106 \tabularnewline
4 & -0.286128 & -2.4279 & 0.008844 \tabularnewline
5 & -0.271716 & -2.3056 & 0.012009 \tabularnewline
6 & -0.421235 & -3.5743 & 0.000316 \tabularnewline
7 & -0.335881 & -2.85 & 0.002849 \tabularnewline
8 & -0.274947 & -2.333 & 0.011223 \tabularnewline
9 & -0.175475 & -1.489 & 0.070433 \tabularnewline
10 & 0.140511 & 1.1923 & 0.118534 \tabularnewline
11 & 0.508286 & 4.313 & 2.5e-05 \tabularnewline
12 & 0.747062 & 6.339 & 0 \tabularnewline
\hline
\end{tabular}
%Source: https://freestatistics.org/blog/index.php?pk=226007&T=1

[TABLE]
[ROW][C]Autocorrelation Function[/C][/ROW]
[ROW][C]Time lag k[/C][C]ACF(k)[/C][C]T-STAT[/C][C]P-value[/C][/ROW]
[ROW][C]1[/C][C]0.551146[/C][C]4.6766[/C][C]7e-06[/C][/ROW]
[ROW][C]2[/C][C]0.076714[/C][C]0.6509[/C][C]0.258579[/C][/ROW]
[ROW][C]3[/C][C]-0.19625[/C][C]-1.6652[/C][C]0.050106[/C][/ROW]
[ROW][C]4[/C][C]-0.286128[/C][C]-2.4279[/C][C]0.008844[/C][/ROW]
[ROW][C]5[/C][C]-0.271716[/C][C]-2.3056[/C][C]0.012009[/C][/ROW]
[ROW][C]6[/C][C]-0.421235[/C][C]-3.5743[/C][C]0.000316[/C][/ROW]
[ROW][C]7[/C][C]-0.335881[/C][C]-2.85[/C][C]0.002849[/C][/ROW]
[ROW][C]8[/C][C]-0.274947[/C][C]-2.333[/C][C]0.011223[/C][/ROW]
[ROW][C]9[/C][C]-0.175475[/C][C]-1.489[/C][C]0.070433[/C][/ROW]
[ROW][C]10[/C][C]0.140511[/C][C]1.1923[/C][C]0.118534[/C][/ROW]
[ROW][C]11[/C][C]0.508286[/C][C]4.313[/C][C]2.5e-05[/C][/ROW]
[ROW][C]12[/C][C]0.747062[/C][C]6.339[/C][C]0[/C][/ROW]
[/TABLE]
Source: https://freestatistics.org/blog/index.php?pk=226007&T=1

Globally Unique Identifier (entire table): ba.freestatistics.org/blog/index.php?pk=226007&T=1

As an alternative you can also use a QR Code:  

The GUIDs for individual cells are displayed in the table below:

Autocorrelation Function
Time lag kACF(k)T-STATP-value
10.5511464.67667e-06
20.0767140.65090.258579
3-0.19625-1.66520.050106
4-0.286128-2.42790.008844
5-0.271716-2.30560.012009
6-0.421235-3.57430.000316
7-0.335881-2.850.002849
8-0.274947-2.3330.011223
9-0.175475-1.4890.070433
100.1405111.19230.118534
110.5082864.3132.5e-05
120.7470626.3390


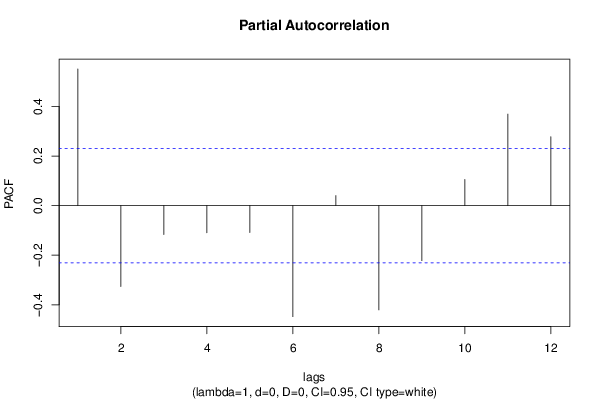
Partial Autocorrelation Function
Time lag kPACF(k)T-STATP-value
10.5511464.67667e-06
2-0.326107-2.76710.003592
3-0.11666-0.98990.16277
4-0.109798-0.93170.17731
5-0.108799-0.92320.179496
6-0.447984-3.80130.000149
70.0403690.34250.36647
8-0.420784-3.57050.00032
9-0.222106-1.88460.031758
100.1054250.89460.187001
110.368883.13010.001262
120.2777032.35640.010589

\begin{tabular}{lllllllll}
\hline
Partial Autocorrelation Function \tabularnewline
Time lag k & PACF(k) & T-STAT & P-value \tabularnewline
1 & 0.551146 & 4.6766 & 7e-06 \tabularnewline
2 & -0.326107 & -2.7671 & 0.003592 \tabularnewline
3 & -0.11666 & -0.9899 & 0.16277 \tabularnewline
4 & -0.109798 & -0.9317 & 0.17731 \tabularnewline
5 & -0.108799 & -0.9232 & 0.179496 \tabularnewline
6 & -0.447984 & -3.8013 & 0.000149 \tabularnewline
7 & 0.040369 & 0.3425 & 0.36647 \tabularnewline
8 & -0.420784 & -3.5705 & 0.00032 \tabularnewline
9 & -0.222106 & -1.8846 & 0.031758 \tabularnewline
10 & 0.105425 & 0.8946 & 0.187001 \tabularnewline
11 & 0.36888 & 3.1301 & 0.001262 \tabularnewline
12 & 0.277703 & 2.3564 & 0.010589 \tabularnewline
\hline
\end{tabular}
%Source: https://freestatistics.org/blog/index.php?pk=226007&T=2

[TABLE]
[ROW][C]Partial Autocorrelation Function[/C][/ROW]
[ROW][C]Time lag k[/C][C]PACF(k)[/C][C]T-STAT[/C][C]P-value[/C][/ROW]
[ROW][C]1[/C][C]0.551146[/C][C]4.6766[/C][C]7e-06[/C][/ROW]
[ROW][C]2[/C][C]-0.326107[/C][C]-2.7671[/C][C]0.003592[/C][/ROW]
[ROW][C]3[/C][C]-0.11666[/C][C]-0.9899[/C][C]0.16277[/C][/ROW]
[ROW][C]4[/C][C]-0.109798[/C][C]-0.9317[/C][C]0.17731[/C][/ROW]
[ROW][C]5[/C][C]-0.108799[/C][C]-0.9232[/C][C]0.179496[/C][/ROW]
[ROW][C]6[/C][C]-0.447984[/C][C]-3.8013[/C][C]0.000149[/C][/ROW]
[ROW][C]7[/C][C]0.040369[/C][C]0.3425[/C][C]0.36647[/C][/ROW]
[ROW][C]8[/C][C]-0.420784[/C][C]-3.5705[/C][C]0.00032[/C][/ROW]
[ROW][C]9[/C][C]-0.222106[/C][C]-1.8846[/C][C]0.031758[/C][/ROW]
[ROW][C]10[/C][C]0.105425[/C][C]0.8946[/C][C]0.187001[/C][/ROW]
[ROW][C]11[/C][C]0.36888[/C][C]3.1301[/C][C]0.001262[/C][/ROW]
[ROW][C]12[/C][C]0.277703[/C][C]2.3564[/C][C]0.010589[/C][/ROW]
[/TABLE]
Source: https://freestatistics.org/blog/index.php?pk=226007&T=2

Globally Unique Identifier (entire table): ba.freestatistics.org/blog/index.php?pk=226007&T=2

As an alternative you can also use a QR Code:  

The GUIDs for individual cells are displayed in the table below:

Partial Autocorrelation Function
Time lag kPACF(k)T-STATP-value
10.5511464.67667e-06
2-0.326107-2.76710.003592
3-0.11666-0.98990.16277
4-0.109798-0.93170.17731
5-0.108799-0.92320.179496
6-0.447984-3.80130.000149
70.0403690.34250.36647
8-0.420784-3.57050.00032
9-0.222106-1.88460.031758
100.1054250.89460.187001
110.368883.13010.001262
120.2777032.35640.010589


Parameters (Session):
par1 = 12 ; par2 = 1 ; par3 = 0 ; par4 = 0 ; par5 = 12 ; par6 = White Noise ; par7 = 0.95 ;
Parameters (R input):
par1 = 12 ; par2 = 1 ; par3 = 0 ; par4 = 0 ; par5 = 12 ; par6 = White Noise ; par7 = 0.95 ; par8 = ;
R code (references can be found in the software module):
if (par1 == 'Default') {
par1 = 10*log10(length(x))
} else {
par1 <- as.numeric(par1)
}
par2 <- as.numeric(par2)
par3 <- as.numeric(par3)
par4 <- as.numeric(par4)
par5 <- as.numeric(par5)
if (par6 == 'White Noise') par6 <- 'white' else par6 <- 'ma'
par7 <- as.numeric(par7)
if (par8 != '') par8 <- as.numeric(par8)
ox <- x
if (par8 == '') {
if (par2 == 0) {
x <- log(x)
} else {
x <- (x ^ par2 - 1) / par2
}
} else {
x <- log(x,base=par8)
}
if (par3 > 0) x <- diff(x,lag=1,difference=par3)
if (par4 > 0) x <- diff(x,lag=par5,difference=par4)
bitmap(file='picts.png')
op <- par(mfrow=c(2,1))
plot(ox,type='l',main='Original Time Series',xlab='time',ylab='value')
if (par8=='') {
mytitle <- paste('Working Time Series (lambda=',par2,', d=',par3,', D=',par4,')',sep='')
mysub <- paste('(lambda=',par2,', d=',par3,', D=',par4,', CI=', par7, ', CI type=',par6,')',sep='')
} else {
mytitle <- paste('Working Time Series (base=',par8,', d=',par3,', D=',par4,')',sep='')
mysub <- paste('(base=',par8,', d=',par3,', D=',par4,', CI=', par7, ', CI type=',par6,')',sep='')
}
plot(x,type='l', main=mytitle,xlab='time',ylab='value')
par(op)
dev.off()
bitmap(file='pic1.png')
racf <- acf(x, par1, main='Autocorrelation', xlab='time lag', ylab='ACF', ci.type=par6, ci=par7, sub=mysub)
dev.off()
bitmap(file='pic2.png')
rpacf <- pacf(x,par1,main='Partial Autocorrelation',xlab='lags',ylab='PACF',sub=mysub)
dev.off()
(myacf <- c(racf$acf))
(mypacf <- c(rpacf$acf))
lengthx <- length(x)
sqrtn <- sqrt(lengthx)
load(file='createtable')
a<-table.start()
a<-table.row.start(a)
a<-table.element(a,'Autocorrelation Function',4,TRUE)
a<-table.row.end(a)
a<-table.row.start(a)
a<-table.element(a,'Time lag k',header=TRUE)
a<-table.element(a,hyperlink('basics.htm','ACF(k)','click here for more information about the Autocorrelation Function'),header=TRUE)
a<-table.element(a,'T-STAT',header=TRUE)
a<-table.element(a,'P-value',header=TRUE)
a<-table.row.end(a)
for (i in 2:(par1+1)) {
a<-table.row.start(a)
a<-table.element(a,i-1,header=TRUE)
a<-table.element(a,round(myacf[i],6))
mytstat <- myacf[i]*sqrtn
a<-table.element(a,round(mytstat,4))
a<-table.element(a,round(1-pt(abs(mytstat),lengthx),6))
a<-table.row.end(a)
}
a<-table.end(a)
table.save(a,file='mytable.tab')
a<-table.start()
a<-table.row.start(a)
a<-table.element(a,'Partial Autocorrelation Function',4,TRUE)
a<-table.row.end(a)
a<-table.row.start(a)
a<-table.element(a,'Time lag k',header=TRUE)
a<-table.element(a,hyperlink('basics.htm','PACF(k)','click here for more information about the Partial Autocorrelation Function'),header=TRUE)
a<-table.element(a,'T-STAT',header=TRUE)
a<-table.element(a,'P-value',header=TRUE)
a<-table.row.end(a)
for (i in 1:par1) {
a<-table.row.start(a)
a<-table.element(a,i,header=TRUE)
a<-table.element(a,round(mypacf[i],6))
mytstat <- mypacf[i]*sqrtn
a<-table.element(a,round(mytstat,4))
a<-table.element(a,round(1-pt(abs(mytstat),lengthx),6))
a<-table.row.end(a)
}
a<-table.end(a)
table.save(a,file='mytable1.tab')