Free Statistics

of Irreproducible Research!

Author's title

Author*Unverified author*
R Software Modulerwasp_autocorrelation.wasp
Title produced by software(Partial) Autocorrelation Function
Date of computationMon, 18 Nov 2013 06:18:39 -0500
Cite this page as followsStatistical Computations at FreeStatistics.org, Office for Research Development and Education, URL https://freestatistics.org/blog/index.php?v=date/2013/Nov/18/t13847735973sljck49kc5x5ow.htm/, Retrieved Sat, 27 Apr 2024 10:42:28 +0000
Statistical Computations at FreeStatistics.org, Office for Research Development and Education, URL https://freestatistics.org/blog/index.php?pk=226013, Retrieved Sat, 27 Apr 2024 10:42:28 +0000
QR Codes:

Original text written by user:
IsPrivate?No (this computation is public)
User-defined keywords
Estimated Impact49
Family? (F = Feedback message, R = changed R code, M = changed R Module, P = changed Parameters, D = changed Data)
-       [(Partial) Autocorrelation Function] [] [2013-11-18 11:18:39] [626ac9e5ebaea65a3a0a76f5178dd51c] [Current]
Feedback Forum

Post a new message
Dataseries X:
6.715
7.703
9.856
8.326
9.269
7.035
10.342
11.682
10.304
11.385
9.777
8.882
7.897
6.930
9.545
9.110
7.459
7.320
10.017
12.307
11.072
10.749
9.589
9.080
7.384
8.062
8.511
8.684
8.306
7.643
10.577
13.747
11.783
11.611
9.946
8.693
7.303
7.609
9.423
8.584
7.586
6.843
11.811
13.414
12.103
11.501
8.213
7.982
7.687
7.180
7.862
8.043
8.340
6.692
10.065
12.684
11.587
9.843
8.110
7.940
6.475
6.121
9.669
7.778
7.826
7.403
10.741
14.023
11.519
10.236
8.075
8.157


Summary of computational transaction
Raw Inputview raw input (R code)
Raw Outputview raw output of R engine
Computing time2 seconds
R Server'Gwilym Jenkins' @ jenkins.wessa.net

\begin{tabular}{lllllllll}
\hline
Summary of computational transaction \tabularnewline
Raw Input & view raw input (R code)  \tabularnewline
Raw Output & view raw output of R engine  \tabularnewline
Computing time & 2 seconds \tabularnewline
R Server & 'Gwilym Jenkins' @ jenkins.wessa.net \tabularnewline
\hline
\end{tabular}
%Source: https://freestatistics.org/blog/index.php?pk=226013&T=0

[TABLE]
[ROW][C]Summary of computational transaction[/C][/ROW]
[ROW][C]Raw Input[/C][C]view raw input (R code) [/C][/ROW]
[ROW][C]Raw Output[/C][C]view raw output of R engine [/C][/ROW]
[ROW][C]Computing time[/C][C]2 seconds[/C][/ROW]
[ROW][C]R Server[/C][C]'Gwilym Jenkins' @ jenkins.wessa.net[/C][/ROW]
[/TABLE]
Source: https://freestatistics.org/blog/index.php?pk=226013&T=0

Globally Unique Identifier (entire table): ba.freestatistics.org/blog/index.php?pk=226013&T=0

As an alternative you can also use a QR Code:  

The GUIDs for individual cells are displayed in the table below:

Summary of computational transaction
Raw Inputview raw input (R code)
Raw Outputview raw output of R engine
Computing time2 seconds
R Server'Gwilym Jenkins' @ jenkins.wessa.net


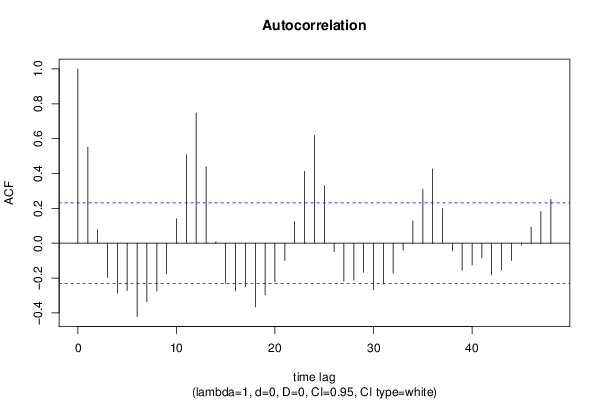
Autocorrelation Function
Time lag kACF(k)T-STATP-value
10.5511464.67667e-06
20.0767140.65090.258579
3-0.19625-1.66520.050106
4-0.286128-2.42790.008844
5-0.271716-2.30560.012009
6-0.421235-3.57430.000316
7-0.335881-2.850.002849
8-0.274947-2.3330.011223
9-0.175475-1.4890.070433
100.1405111.19230.118534
110.5082864.3132.5e-05
120.7470626.3390
130.4394233.72860.00019
140.0077870.06610.47375
15-0.231218-1.9620.026817
16-0.272038-2.30830.011928
17-0.249417-2.11640.018885
18-0.364608-3.09380.001406
19-0.29633-2.51440.007079
20-0.222403-1.88720.031585
21-0.099274-0.84240.201185
220.1245561.05690.147046
230.4126323.50134e-04
240.617895.2431e-06
250.3295422.79630.003312
26-0.049111-0.41670.339061
27-0.218255-1.8520.034066
28-0.212208-1.80060.037973
29-0.166684-1.41440.080783
30-0.266933-2.2650.013261
31-0.233452-1.98090.025711
32-0.1726-1.46460.073697
33-0.039742-0.33720.368464
340.1278171.08460.140866
350.308492.61760.005393
360.4254893.61040.000281
370.199841.69570.047132
38-0.042574-0.36130.359483
39-0.155133-1.31630.096117
40-0.124372-1.05530.147401
41-0.084227-0.71470.238557
42-0.180238-1.52940.065277
43-0.154296-1.30920.097308
44-0.098155-0.83290.203835
45-0.010351-0.08780.465128
460.0914710.77620.2201
470.181541.54040.063921
480.2522092.14010.017869

\begin{tabular}{lllllllll}
\hline
Autocorrelation Function \tabularnewline
Time lag k & ACF(k) & T-STAT & P-value \tabularnewline
1 & 0.551146 & 4.6766 & 7e-06 \tabularnewline
2 & 0.076714 & 0.6509 & 0.258579 \tabularnewline
3 & -0.19625 & -1.6652 & 0.050106 \tabularnewline
4 & -0.286128 & -2.4279 & 0.008844 \tabularnewline
5 & -0.271716 & -2.3056 & 0.012009 \tabularnewline
6 & -0.421235 & -3.5743 & 0.000316 \tabularnewline
7 & -0.335881 & -2.85 & 0.002849 \tabularnewline
8 & -0.274947 & -2.333 & 0.011223 \tabularnewline
9 & -0.175475 & -1.489 & 0.070433 \tabularnewline
10 & 0.140511 & 1.1923 & 0.118534 \tabularnewline
11 & 0.508286 & 4.313 & 2.5e-05 \tabularnewline
12 & 0.747062 & 6.339 & 0 \tabularnewline
13 & 0.439423 & 3.7286 & 0.00019 \tabularnewline
14 & 0.007787 & 0.0661 & 0.47375 \tabularnewline
15 & -0.231218 & -1.962 & 0.026817 \tabularnewline
16 & -0.272038 & -2.3083 & 0.011928 \tabularnewline
17 & -0.249417 & -2.1164 & 0.018885 \tabularnewline
18 & -0.364608 & -3.0938 & 0.001406 \tabularnewline
19 & -0.29633 & -2.5144 & 0.007079 \tabularnewline
20 & -0.222403 & -1.8872 & 0.031585 \tabularnewline
21 & -0.099274 & -0.8424 & 0.201185 \tabularnewline
22 & 0.124556 & 1.0569 & 0.147046 \tabularnewline
23 & 0.412632 & 3.5013 & 4e-04 \tabularnewline
24 & 0.61789 & 5.243 & 1e-06 \tabularnewline
25 & 0.329542 & 2.7963 & 0.003312 \tabularnewline
26 & -0.049111 & -0.4167 & 0.339061 \tabularnewline
27 & -0.218255 & -1.852 & 0.034066 \tabularnewline
28 & -0.212208 & -1.8006 & 0.037973 \tabularnewline
29 & -0.166684 & -1.4144 & 0.080783 \tabularnewline
30 & -0.266933 & -2.265 & 0.013261 \tabularnewline
31 & -0.233452 & -1.9809 & 0.025711 \tabularnewline
32 & -0.1726 & -1.4646 & 0.073697 \tabularnewline
33 & -0.039742 & -0.3372 & 0.368464 \tabularnewline
34 & 0.127817 & 1.0846 & 0.140866 \tabularnewline
35 & 0.30849 & 2.6176 & 0.005393 \tabularnewline
36 & 0.425489 & 3.6104 & 0.000281 \tabularnewline
37 & 0.19984 & 1.6957 & 0.047132 \tabularnewline
38 & -0.042574 & -0.3613 & 0.359483 \tabularnewline
39 & -0.155133 & -1.3163 & 0.096117 \tabularnewline
40 & -0.124372 & -1.0553 & 0.147401 \tabularnewline
41 & -0.084227 & -0.7147 & 0.238557 \tabularnewline
42 & -0.180238 & -1.5294 & 0.065277 \tabularnewline
43 & -0.154296 & -1.3092 & 0.097308 \tabularnewline
44 & -0.098155 & -0.8329 & 0.203835 \tabularnewline
45 & -0.010351 & -0.0878 & 0.465128 \tabularnewline
46 & 0.091471 & 0.7762 & 0.2201 \tabularnewline
47 & 0.18154 & 1.5404 & 0.063921 \tabularnewline
48 & 0.252209 & 2.1401 & 0.017869 \tabularnewline
\hline
\end{tabular}
%Source: https://freestatistics.org/blog/index.php?pk=226013&T=1

[TABLE]
[ROW][C]Autocorrelation Function[/C][/ROW]
[ROW][C]Time lag k[/C][C]ACF(k)[/C][C]T-STAT[/C][C]P-value[/C][/ROW]
[ROW][C]1[/C][C]0.551146[/C][C]4.6766[/C][C]7e-06[/C][/ROW]
[ROW][C]2[/C][C]0.076714[/C][C]0.6509[/C][C]0.258579[/C][/ROW]
[ROW][C]3[/C][C]-0.19625[/C][C]-1.6652[/C][C]0.050106[/C][/ROW]
[ROW][C]4[/C][C]-0.286128[/C][C]-2.4279[/C][C]0.008844[/C][/ROW]
[ROW][C]5[/C][C]-0.271716[/C][C]-2.3056[/C][C]0.012009[/C][/ROW]
[ROW][C]6[/C][C]-0.421235[/C][C]-3.5743[/C][C]0.000316[/C][/ROW]
[ROW][C]7[/C][C]-0.335881[/C][C]-2.85[/C][C]0.002849[/C][/ROW]
[ROW][C]8[/C][C]-0.274947[/C][C]-2.333[/C][C]0.011223[/C][/ROW]
[ROW][C]9[/C][C]-0.175475[/C][C]-1.489[/C][C]0.070433[/C][/ROW]
[ROW][C]10[/C][C]0.140511[/C][C]1.1923[/C][C]0.118534[/C][/ROW]
[ROW][C]11[/C][C]0.508286[/C][C]4.313[/C][C]2.5e-05[/C][/ROW]
[ROW][C]12[/C][C]0.747062[/C][C]6.339[/C][C]0[/C][/ROW]
[ROW][C]13[/C][C]0.439423[/C][C]3.7286[/C][C]0.00019[/C][/ROW]
[ROW][C]14[/C][C]0.007787[/C][C]0.0661[/C][C]0.47375[/C][/ROW]
[ROW][C]15[/C][C]-0.231218[/C][C]-1.962[/C][C]0.026817[/C][/ROW]
[ROW][C]16[/C][C]-0.272038[/C][C]-2.3083[/C][C]0.011928[/C][/ROW]
[ROW][C]17[/C][C]-0.249417[/C][C]-2.1164[/C][C]0.018885[/C][/ROW]
[ROW][C]18[/C][C]-0.364608[/C][C]-3.0938[/C][C]0.001406[/C][/ROW]
[ROW][C]19[/C][C]-0.29633[/C][C]-2.5144[/C][C]0.007079[/C][/ROW]
[ROW][C]20[/C][C]-0.222403[/C][C]-1.8872[/C][C]0.031585[/C][/ROW]
[ROW][C]21[/C][C]-0.099274[/C][C]-0.8424[/C][C]0.201185[/C][/ROW]
[ROW][C]22[/C][C]0.124556[/C][C]1.0569[/C][C]0.147046[/C][/ROW]
[ROW][C]23[/C][C]0.412632[/C][C]3.5013[/C][C]4e-04[/C][/ROW]
[ROW][C]24[/C][C]0.61789[/C][C]5.243[/C][C]1e-06[/C][/ROW]
[ROW][C]25[/C][C]0.329542[/C][C]2.7963[/C][C]0.003312[/C][/ROW]
[ROW][C]26[/C][C]-0.049111[/C][C]-0.4167[/C][C]0.339061[/C][/ROW]
[ROW][C]27[/C][C]-0.218255[/C][C]-1.852[/C][C]0.034066[/C][/ROW]
[ROW][C]28[/C][C]-0.212208[/C][C]-1.8006[/C][C]0.037973[/C][/ROW]
[ROW][C]29[/C][C]-0.166684[/C][C]-1.4144[/C][C]0.080783[/C][/ROW]
[ROW][C]30[/C][C]-0.266933[/C][C]-2.265[/C][C]0.013261[/C][/ROW]
[ROW][C]31[/C][C]-0.233452[/C][C]-1.9809[/C][C]0.025711[/C][/ROW]
[ROW][C]32[/C][C]-0.1726[/C][C]-1.4646[/C][C]0.073697[/C][/ROW]
[ROW][C]33[/C][C]-0.039742[/C][C]-0.3372[/C][C]0.368464[/C][/ROW]
[ROW][C]34[/C][C]0.127817[/C][C]1.0846[/C][C]0.140866[/C][/ROW]
[ROW][C]35[/C][C]0.30849[/C][C]2.6176[/C][C]0.005393[/C][/ROW]
[ROW][C]36[/C][C]0.425489[/C][C]3.6104[/C][C]0.000281[/C][/ROW]
[ROW][C]37[/C][C]0.19984[/C][C]1.6957[/C][C]0.047132[/C][/ROW]
[ROW][C]38[/C][C]-0.042574[/C][C]-0.3613[/C][C]0.359483[/C][/ROW]
[ROW][C]39[/C][C]-0.155133[/C][C]-1.3163[/C][C]0.096117[/C][/ROW]
[ROW][C]40[/C][C]-0.124372[/C][C]-1.0553[/C][C]0.147401[/C][/ROW]
[ROW][C]41[/C][C]-0.084227[/C][C]-0.7147[/C][C]0.238557[/C][/ROW]
[ROW][C]42[/C][C]-0.180238[/C][C]-1.5294[/C][C]0.065277[/C][/ROW]
[ROW][C]43[/C][C]-0.154296[/C][C]-1.3092[/C][C]0.097308[/C][/ROW]
[ROW][C]44[/C][C]-0.098155[/C][C]-0.8329[/C][C]0.203835[/C][/ROW]
[ROW][C]45[/C][C]-0.010351[/C][C]-0.0878[/C][C]0.465128[/C][/ROW]
[ROW][C]46[/C][C]0.091471[/C][C]0.7762[/C][C]0.2201[/C][/ROW]
[ROW][C]47[/C][C]0.18154[/C][C]1.5404[/C][C]0.063921[/C][/ROW]
[ROW][C]48[/C][C]0.252209[/C][C]2.1401[/C][C]0.017869[/C][/ROW]
[/TABLE]
Source: https://freestatistics.org/blog/index.php?pk=226013&T=1

Globally Unique Identifier (entire table): ba.freestatistics.org/blog/index.php?pk=226013&T=1

As an alternative you can also use a QR Code:  

The GUIDs for individual cells are displayed in the table below:

Autocorrelation Function
Time lag kACF(k)T-STATP-value
10.5511464.67667e-06
20.0767140.65090.258579
3-0.19625-1.66520.050106
4-0.286128-2.42790.008844
5-0.271716-2.30560.012009
6-0.421235-3.57430.000316
7-0.335881-2.850.002849
8-0.274947-2.3330.011223
9-0.175475-1.4890.070433
100.1405111.19230.118534
110.5082864.3132.5e-05
120.7470626.3390
130.4394233.72860.00019
140.0077870.06610.47375
15-0.231218-1.9620.026817
16-0.272038-2.30830.011928
17-0.249417-2.11640.018885
18-0.364608-3.09380.001406
19-0.29633-2.51440.007079
20-0.222403-1.88720.031585
21-0.099274-0.84240.201185
220.1245561.05690.147046
230.4126323.50134e-04
240.617895.2431e-06
250.3295422.79630.003312
26-0.049111-0.41670.339061
27-0.218255-1.8520.034066
28-0.212208-1.80060.037973
29-0.166684-1.41440.080783
30-0.266933-2.2650.013261
31-0.233452-1.98090.025711
32-0.1726-1.46460.073697
33-0.039742-0.33720.368464
340.1278171.08460.140866
350.308492.61760.005393
360.4254893.61040.000281
370.199841.69570.047132
38-0.042574-0.36130.359483
39-0.155133-1.31630.096117
40-0.124372-1.05530.147401
41-0.084227-0.71470.238557
42-0.180238-1.52940.065277
43-0.154296-1.30920.097308
44-0.098155-0.83290.203835
45-0.010351-0.08780.465128
460.0914710.77620.2201
470.181541.54040.063921
480.2522092.14010.017869


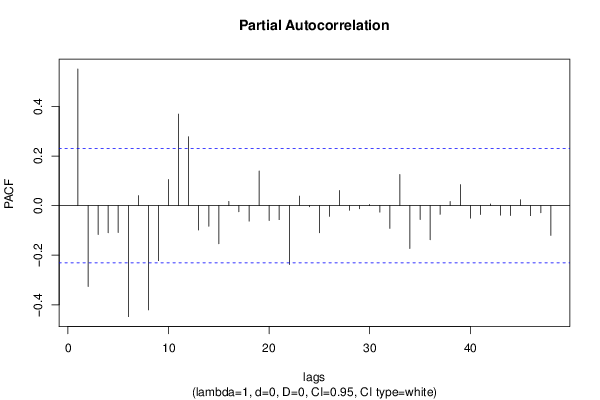
Partial Autocorrelation Function
Time lag kPACF(k)T-STATP-value
10.5511464.67667e-06
2-0.326107-2.76710.003592
3-0.11666-0.98990.16277
4-0.109798-0.93170.17731
5-0.108799-0.92320.179496
6-0.447984-3.80130.000149
70.0403690.34250.36647
8-0.420784-3.57050.00032
9-0.222106-1.88460.031758
100.1054250.89460.187001
110.368883.13010.001262
120.2777032.35640.010589
13-0.098505-0.83580.203004
14-0.083343-0.70720.240867
15-0.154213-1.30850.097426
160.0168730.14320.443277
17-0.024846-0.21080.416808
18-0.062841-0.53320.29776
190.1395331.1840.120158
20-0.059921-0.50840.306349
21-0.05679-0.48190.315676
22-0.237388-2.01430.023857
230.0381270.32350.373621
24-0.004551-0.03860.484651
25-0.109423-0.92850.178129
26-0.043426-0.36850.356799
270.0611110.51850.302835
28-0.018864-0.16010.436637
29-0.012733-0.1080.45713
300.0042130.03580.48579
31-0.02629-0.22310.412052
32-0.091847-0.77940.219164
330.1252031.06240.145805
34-0.173259-1.47010.072939
35-0.056212-0.4770.317411
36-0.137543-1.16710.123513
37-0.035345-0.29990.382554
380.0168070.14260.443499
390.0845110.71710.237815
40-0.050647-0.42980.334329
41-0.036089-0.30620.380158
420.0065680.05570.477854
43-0.038631-0.32780.372009
44-0.040142-0.34060.367191
450.0233390.1980.421787
46-0.040439-0.34310.366248
47-0.02911-0.2470.402803
48-0.120224-1.02010.155539

\begin{tabular}{lllllllll}
\hline
Partial Autocorrelation Function \tabularnewline
Time lag k & PACF(k) & T-STAT & P-value \tabularnewline
1 & 0.551146 & 4.6766 & 7e-06 \tabularnewline
2 & -0.326107 & -2.7671 & 0.003592 \tabularnewline
3 & -0.11666 & -0.9899 & 0.16277 \tabularnewline
4 & -0.109798 & -0.9317 & 0.17731 \tabularnewline
5 & -0.108799 & -0.9232 & 0.179496 \tabularnewline
6 & -0.447984 & -3.8013 & 0.000149 \tabularnewline
7 & 0.040369 & 0.3425 & 0.36647 \tabularnewline
8 & -0.420784 & -3.5705 & 0.00032 \tabularnewline
9 & -0.222106 & -1.8846 & 0.031758 \tabularnewline
10 & 0.105425 & 0.8946 & 0.187001 \tabularnewline
11 & 0.36888 & 3.1301 & 0.001262 \tabularnewline
12 & 0.277703 & 2.3564 & 0.010589 \tabularnewline
13 & -0.098505 & -0.8358 & 0.203004 \tabularnewline
14 & -0.083343 & -0.7072 & 0.240867 \tabularnewline
15 & -0.154213 & -1.3085 & 0.097426 \tabularnewline
16 & 0.016873 & 0.1432 & 0.443277 \tabularnewline
17 & -0.024846 & -0.2108 & 0.416808 \tabularnewline
18 & -0.062841 & -0.5332 & 0.29776 \tabularnewline
19 & 0.139533 & 1.184 & 0.120158 \tabularnewline
20 & -0.059921 & -0.5084 & 0.306349 \tabularnewline
21 & -0.05679 & -0.4819 & 0.315676 \tabularnewline
22 & -0.237388 & -2.0143 & 0.023857 \tabularnewline
23 & 0.038127 & 0.3235 & 0.373621 \tabularnewline
24 & -0.004551 & -0.0386 & 0.484651 \tabularnewline
25 & -0.109423 & -0.9285 & 0.178129 \tabularnewline
26 & -0.043426 & -0.3685 & 0.356799 \tabularnewline
27 & 0.061111 & 0.5185 & 0.302835 \tabularnewline
28 & -0.018864 & -0.1601 & 0.436637 \tabularnewline
29 & -0.012733 & -0.108 & 0.45713 \tabularnewline
30 & 0.004213 & 0.0358 & 0.48579 \tabularnewline
31 & -0.02629 & -0.2231 & 0.412052 \tabularnewline
32 & -0.091847 & -0.7794 & 0.219164 \tabularnewline
33 & 0.125203 & 1.0624 & 0.145805 \tabularnewline
34 & -0.173259 & -1.4701 & 0.072939 \tabularnewline
35 & -0.056212 & -0.477 & 0.317411 \tabularnewline
36 & -0.137543 & -1.1671 & 0.123513 \tabularnewline
37 & -0.035345 & -0.2999 & 0.382554 \tabularnewline
38 & 0.016807 & 0.1426 & 0.443499 \tabularnewline
39 & 0.084511 & 0.7171 & 0.237815 \tabularnewline
40 & -0.050647 & -0.4298 & 0.334329 \tabularnewline
41 & -0.036089 & -0.3062 & 0.380158 \tabularnewline
42 & 0.006568 & 0.0557 & 0.477854 \tabularnewline
43 & -0.038631 & -0.3278 & 0.372009 \tabularnewline
44 & -0.040142 & -0.3406 & 0.367191 \tabularnewline
45 & 0.023339 & 0.198 & 0.421787 \tabularnewline
46 & -0.040439 & -0.3431 & 0.366248 \tabularnewline
47 & -0.02911 & -0.247 & 0.402803 \tabularnewline
48 & -0.120224 & -1.0201 & 0.155539 \tabularnewline
\hline
\end{tabular}
%Source: https://freestatistics.org/blog/index.php?pk=226013&T=2

[TABLE]
[ROW][C]Partial Autocorrelation Function[/C][/ROW]
[ROW][C]Time lag k[/C][C]PACF(k)[/C][C]T-STAT[/C][C]P-value[/C][/ROW]
[ROW][C]1[/C][C]0.551146[/C][C]4.6766[/C][C]7e-06[/C][/ROW]
[ROW][C]2[/C][C]-0.326107[/C][C]-2.7671[/C][C]0.003592[/C][/ROW]
[ROW][C]3[/C][C]-0.11666[/C][C]-0.9899[/C][C]0.16277[/C][/ROW]
[ROW][C]4[/C][C]-0.109798[/C][C]-0.9317[/C][C]0.17731[/C][/ROW]
[ROW][C]5[/C][C]-0.108799[/C][C]-0.9232[/C][C]0.179496[/C][/ROW]
[ROW][C]6[/C][C]-0.447984[/C][C]-3.8013[/C][C]0.000149[/C][/ROW]
[ROW][C]7[/C][C]0.040369[/C][C]0.3425[/C][C]0.36647[/C][/ROW]
[ROW][C]8[/C][C]-0.420784[/C][C]-3.5705[/C][C]0.00032[/C][/ROW]
[ROW][C]9[/C][C]-0.222106[/C][C]-1.8846[/C][C]0.031758[/C][/ROW]
[ROW][C]10[/C][C]0.105425[/C][C]0.8946[/C][C]0.187001[/C][/ROW]
[ROW][C]11[/C][C]0.36888[/C][C]3.1301[/C][C]0.001262[/C][/ROW]
[ROW][C]12[/C][C]0.277703[/C][C]2.3564[/C][C]0.010589[/C][/ROW]
[ROW][C]13[/C][C]-0.098505[/C][C]-0.8358[/C][C]0.203004[/C][/ROW]
[ROW][C]14[/C][C]-0.083343[/C][C]-0.7072[/C][C]0.240867[/C][/ROW]
[ROW][C]15[/C][C]-0.154213[/C][C]-1.3085[/C][C]0.097426[/C][/ROW]
[ROW][C]16[/C][C]0.016873[/C][C]0.1432[/C][C]0.443277[/C][/ROW]
[ROW][C]17[/C][C]-0.024846[/C][C]-0.2108[/C][C]0.416808[/C][/ROW]
[ROW][C]18[/C][C]-0.062841[/C][C]-0.5332[/C][C]0.29776[/C][/ROW]
[ROW][C]19[/C][C]0.139533[/C][C]1.184[/C][C]0.120158[/C][/ROW]
[ROW][C]20[/C][C]-0.059921[/C][C]-0.5084[/C][C]0.306349[/C][/ROW]
[ROW][C]21[/C][C]-0.05679[/C][C]-0.4819[/C][C]0.315676[/C][/ROW]
[ROW][C]22[/C][C]-0.237388[/C][C]-2.0143[/C][C]0.023857[/C][/ROW]
[ROW][C]23[/C][C]0.038127[/C][C]0.3235[/C][C]0.373621[/C][/ROW]
[ROW][C]24[/C][C]-0.004551[/C][C]-0.0386[/C][C]0.484651[/C][/ROW]
[ROW][C]25[/C][C]-0.109423[/C][C]-0.9285[/C][C]0.178129[/C][/ROW]
[ROW][C]26[/C][C]-0.043426[/C][C]-0.3685[/C][C]0.356799[/C][/ROW]
[ROW][C]27[/C][C]0.061111[/C][C]0.5185[/C][C]0.302835[/C][/ROW]
[ROW][C]28[/C][C]-0.018864[/C][C]-0.1601[/C][C]0.436637[/C][/ROW]
[ROW][C]29[/C][C]-0.012733[/C][C]-0.108[/C][C]0.45713[/C][/ROW]
[ROW][C]30[/C][C]0.004213[/C][C]0.0358[/C][C]0.48579[/C][/ROW]
[ROW][C]31[/C][C]-0.02629[/C][C]-0.2231[/C][C]0.412052[/C][/ROW]
[ROW][C]32[/C][C]-0.091847[/C][C]-0.7794[/C][C]0.219164[/C][/ROW]
[ROW][C]33[/C][C]0.125203[/C][C]1.0624[/C][C]0.145805[/C][/ROW]
[ROW][C]34[/C][C]-0.173259[/C][C]-1.4701[/C][C]0.072939[/C][/ROW]
[ROW][C]35[/C][C]-0.056212[/C][C]-0.477[/C][C]0.317411[/C][/ROW]
[ROW][C]36[/C][C]-0.137543[/C][C]-1.1671[/C][C]0.123513[/C][/ROW]
[ROW][C]37[/C][C]-0.035345[/C][C]-0.2999[/C][C]0.382554[/C][/ROW]
[ROW][C]38[/C][C]0.016807[/C][C]0.1426[/C][C]0.443499[/C][/ROW]
[ROW][C]39[/C][C]0.084511[/C][C]0.7171[/C][C]0.237815[/C][/ROW]
[ROW][C]40[/C][C]-0.050647[/C][C]-0.4298[/C][C]0.334329[/C][/ROW]
[ROW][C]41[/C][C]-0.036089[/C][C]-0.3062[/C][C]0.380158[/C][/ROW]
[ROW][C]42[/C][C]0.006568[/C][C]0.0557[/C][C]0.477854[/C][/ROW]
[ROW][C]43[/C][C]-0.038631[/C][C]-0.3278[/C][C]0.372009[/C][/ROW]
[ROW][C]44[/C][C]-0.040142[/C][C]-0.3406[/C][C]0.367191[/C][/ROW]
[ROW][C]45[/C][C]0.023339[/C][C]0.198[/C][C]0.421787[/C][/ROW]
[ROW][C]46[/C][C]-0.040439[/C][C]-0.3431[/C][C]0.366248[/C][/ROW]
[ROW][C]47[/C][C]-0.02911[/C][C]-0.247[/C][C]0.402803[/C][/ROW]
[ROW][C]48[/C][C]-0.120224[/C][C]-1.0201[/C][C]0.155539[/C][/ROW]
[/TABLE]
Source: https://freestatistics.org/blog/index.php?pk=226013&T=2

Globally Unique Identifier (entire table): ba.freestatistics.org/blog/index.php?pk=226013&T=2

As an alternative you can also use a QR Code:  

The GUIDs for individual cells are displayed in the table below:

Partial Autocorrelation Function
Time lag kPACF(k)T-STATP-value
10.5511464.67667e-06
2-0.326107-2.76710.003592
3-0.11666-0.98990.16277
4-0.109798-0.93170.17731
5-0.108799-0.92320.179496
6-0.447984-3.80130.000149
70.0403690.34250.36647
8-0.420784-3.57050.00032
9-0.222106-1.88460.031758
100.1054250.89460.187001
110.368883.13010.001262
120.2777032.35640.010589
13-0.098505-0.83580.203004
14-0.083343-0.70720.240867
15-0.154213-1.30850.097426
160.0168730.14320.443277
17-0.024846-0.21080.416808
18-0.062841-0.53320.29776
190.1395331.1840.120158
20-0.059921-0.50840.306349
21-0.05679-0.48190.315676
22-0.237388-2.01430.023857
230.0381270.32350.373621
24-0.004551-0.03860.484651
25-0.109423-0.92850.178129
26-0.043426-0.36850.356799
270.0611110.51850.302835
28-0.018864-0.16010.436637
29-0.012733-0.1080.45713
300.0042130.03580.48579
31-0.02629-0.22310.412052
32-0.091847-0.77940.219164
330.1252031.06240.145805
34-0.173259-1.47010.072939
35-0.056212-0.4770.317411
36-0.137543-1.16710.123513
37-0.035345-0.29990.382554
380.0168070.14260.443499
390.0845110.71710.237815
40-0.050647-0.42980.334329
41-0.036089-0.30620.380158
420.0065680.05570.477854
43-0.038631-0.32780.372009
44-0.040142-0.34060.367191
450.0233390.1980.421787
46-0.040439-0.34310.366248
47-0.02911-0.2470.402803
48-0.120224-1.02010.155539


Parameters (Session):
par1 = 48 ; par2 = 1 ; par3 = 0 ; par4 = 0 ; par5 = 12 ; par6 = White Noise ; par7 = 0.95 ;
Parameters (R input):
par1 = 48 ; par2 = 1 ; par3 = 0 ; par4 = 0 ; par5 = 12 ; par6 = White Noise ; par7 = 0.95 ; par8 = ;
R code (references can be found in the software module):
if (par1 == 'Default') {
par1 = 10*log10(length(x))
} else {
par1 <- as.numeric(par1)
}
par2 <- as.numeric(par2)
par3 <- as.numeric(par3)
par4 <- as.numeric(par4)
par5 <- as.numeric(par5)
if (par6 == 'White Noise') par6 <- 'white' else par6 <- 'ma'
par7 <- as.numeric(par7)
if (par8 != '') par8 <- as.numeric(par8)
ox <- x
if (par8 == '') {
if (par2 == 0) {
x <- log(x)
} else {
x <- (x ^ par2 - 1) / par2
}
} else {
x <- log(x,base=par8)
}
if (par3 > 0) x <- diff(x,lag=1,difference=par3)
if (par4 > 0) x <- diff(x,lag=par5,difference=par4)
bitmap(file='picts.png')
op <- par(mfrow=c(2,1))
plot(ox,type='l',main='Original Time Series',xlab='time',ylab='value')
if (par8=='') {
mytitle <- paste('Working Time Series (lambda=',par2,', d=',par3,', D=',par4,')',sep='')
mysub <- paste('(lambda=',par2,', d=',par3,', D=',par4,', CI=', par7, ', CI type=',par6,')',sep='')
} else {
mytitle <- paste('Working Time Series (base=',par8,', d=',par3,', D=',par4,')',sep='')
mysub <- paste('(base=',par8,', d=',par3,', D=',par4,', CI=', par7, ', CI type=',par6,')',sep='')
}
plot(x,type='l', main=mytitle,xlab='time',ylab='value')
par(op)
dev.off()
bitmap(file='pic1.png')
racf <- acf(x, par1, main='Autocorrelation', xlab='time lag', ylab='ACF', ci.type=par6, ci=par7, sub=mysub)
dev.off()
bitmap(file='pic2.png')
rpacf <- pacf(x,par1,main='Partial Autocorrelation',xlab='lags',ylab='PACF',sub=mysub)
dev.off()
(myacf <- c(racf$acf))
(mypacf <- c(rpacf$acf))
lengthx <- length(x)
sqrtn <- sqrt(lengthx)
load(file='createtable')
a<-table.start()
a<-table.row.start(a)
a<-table.element(a,'Autocorrelation Function',4,TRUE)
a<-table.row.end(a)
a<-table.row.start(a)
a<-table.element(a,'Time lag k',header=TRUE)
a<-table.element(a,hyperlink('basics.htm','ACF(k)','click here for more information about the Autocorrelation Function'),header=TRUE)
a<-table.element(a,'T-STAT',header=TRUE)
a<-table.element(a,'P-value',header=TRUE)
a<-table.row.end(a)
for (i in 2:(par1+1)) {
a<-table.row.start(a)
a<-table.element(a,i-1,header=TRUE)
a<-table.element(a,round(myacf[i],6))
mytstat <- myacf[i]*sqrtn
a<-table.element(a,round(mytstat,4))
a<-table.element(a,round(1-pt(abs(mytstat),lengthx),6))
a<-table.row.end(a)
}
a<-table.end(a)
table.save(a,file='mytable.tab')
a<-table.start()
a<-table.row.start(a)
a<-table.element(a,'Partial Autocorrelation Function',4,TRUE)
a<-table.row.end(a)
a<-table.row.start(a)
a<-table.element(a,'Time lag k',header=TRUE)
a<-table.element(a,hyperlink('basics.htm','PACF(k)','click here for more information about the Partial Autocorrelation Function'),header=TRUE)
a<-table.element(a,'T-STAT',header=TRUE)
a<-table.element(a,'P-value',header=TRUE)
a<-table.row.end(a)
for (i in 1:par1) {
a<-table.row.start(a)
a<-table.element(a,i,header=TRUE)
a<-table.element(a,round(mypacf[i],6))
mytstat <- mypacf[i]*sqrtn
a<-table.element(a,round(mytstat,4))
a<-table.element(a,round(1-pt(abs(mytstat),lengthx),6))
a<-table.row.end(a)
}
a<-table.end(a)
table.save(a,file='mytable1.tab')