Free Statistics

of Irreproducible Research!

Author's title

Author*Unverified author*
R Software Modulerwasp_autocorrelation.wasp
Title produced by software(Partial) Autocorrelation Function
Date of computationMon, 18 Nov 2013 06:24:41 -0500
Cite this page as followsStatistical Computations at FreeStatistics.org, Office for Research Development and Education, URL https://freestatistics.org/blog/index.php?v=date/2013/Nov/18/t1384773932vtna04ndgs8ya7p.htm/, Retrieved Sat, 27 Apr 2024 13:04:34 +0000
Statistical Computations at FreeStatistics.org, Office for Research Development and Education, URL https://freestatistics.org/blog/index.php?pk=226027, Retrieved Sat, 27 Apr 2024 13:04:34 +0000
QR Codes:

Original text written by user:
IsPrivate?No (this computation is public)
User-defined keywords
Estimated Impact50
Family? (F = Feedback message, R = changed R code, M = changed R Module, P = changed Parameters, D = changed Data)
-       [(Partial) Autocorrelation Function] [] [2013-11-18 11:24:41] [0f9b748f6fe1dd88ddc67537cf760c5a] [Current]
Feedback Forum

Post a new message
Dataseries X:
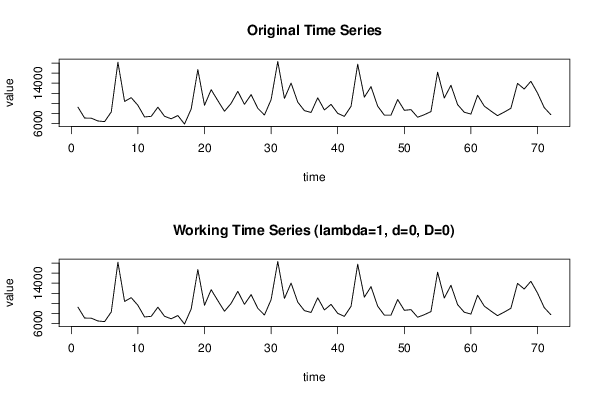
9244
7074
7044
6492
6362
8287
18177
10379
11130
9606
7294
7415
9230
7423
6927
7572
5877
8878
16706
9611
12714
10549
8421
9993
12384
9798
11738
9011
7673
10736
18316
10973
14027
10242
8547
8187
11101
8685
9790
8003
7412
9397
17774
11230
13321
9432
7653
7651
10762
8614
8748
7235
7735
8360
16202
11053
13593
9738
8226
7866
11606
9456
8471
7553
8259
9009
13968
12844
14388
12048
9167
7733


Summary of computational transaction
Raw Inputview raw input (R code)
Raw Outputview raw output of R engine
Computing time4 seconds
R Server'Gwilym Jenkins' @ jenkins.wessa.net

\begin{tabular}{lllllllll}
\hline
Summary of computational transaction \tabularnewline
Raw Input & view raw input (R code)  \tabularnewline
Raw Output & view raw output of R engine  \tabularnewline
Computing time & 4 seconds \tabularnewline
R Server & 'Gwilym Jenkins' @ jenkins.wessa.net \tabularnewline
\hline
\end{tabular}
%Source: https://freestatistics.org/blog/index.php?pk=226027&T=0

[TABLE]
[ROW][C]Summary of computational transaction[/C][/ROW]
[ROW][C]Raw Input[/C][C]view raw input (R code) [/C][/ROW]
[ROW][C]Raw Output[/C][C]view raw output of R engine [/C][/ROW]
[ROW][C]Computing time[/C][C]4 seconds[/C][/ROW]
[ROW][C]R Server[/C][C]'Gwilym Jenkins' @ jenkins.wessa.net[/C][/ROW]
[/TABLE]
Source: https://freestatistics.org/blog/index.php?pk=226027&T=0

Globally Unique Identifier (entire table): ba.freestatistics.org/blog/index.php?pk=226027&T=0

As an alternative you can also use a QR Code:  

The GUIDs for individual cells are displayed in the table below:

Summary of computational transaction
Raw Inputview raw input (R code)
Raw Outputview raw output of R engine
Computing time4 seconds
R Server'Gwilym Jenkins' @ jenkins.wessa.net


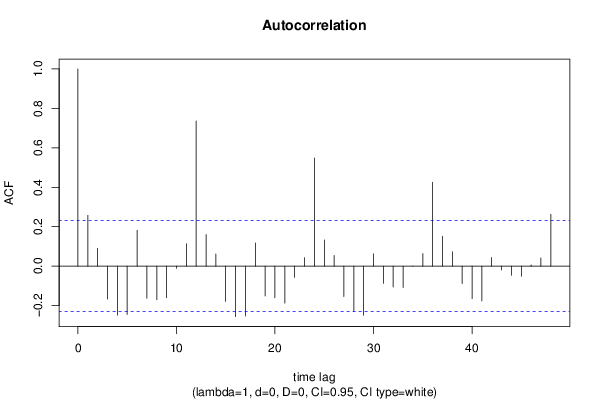
Autocorrelation Function
Time lag kACF(k)T-STATP-value
10.2577372.1870.015997
20.0902620.76590.22312
3-0.16705-1.41750.08033
4-0.248304-2.10690.019304
5-0.245015-2.0790.020589
60.181461.53970.064004
7-0.162868-1.3820.085625
8-0.17082-1.44950.075777
9-0.160688-1.36350.08849
10-0.010882-0.09230.463345
110.1133310.96160.169722
120.7362656.24740
130.1600541.35810.089336
140.0617810.52420.300865
15-0.178477-1.51440.067147
16-0.256066-2.17280.016544
17-0.252803-2.14510.017659
180.1172840.99520.161489
19-0.151065-1.28180.102008
20-0.159953-1.35720.089471
21-0.187411-1.59020.058081
22-0.056799-0.4820.315651
230.0433390.36770.357072
240.5486544.65557e-06
250.1328791.12750.131634
260.0536580.45530.32513
27-0.154329-1.30950.09726
28-0.229516-1.94750.027687
29-0.248682-2.11010.019161
300.0622880.52850.299377
31-0.08751-0.74250.230087
32-0.105632-0.89630.186534
33-0.108073-0.9170.181095
348.3e-057e-040.49972
350.0635850.53950.295591
360.4252053.6080.000283
370.1517731.28780.100964
380.0732210.62130.268182
39-0.088058-0.74720.228689
40-0.164577-1.39650.083429
41-0.176005-1.49350.069844
420.0443590.37640.353865
43-0.019047-0.16160.436028
44-0.045962-0.390.348844
45-0.05152-0.43720.331651
460.005850.04960.480275
470.0412030.34960.363822
480.262812.230.014432

\begin{tabular}{lllllllll}
\hline
Autocorrelation Function \tabularnewline
Time lag k & ACF(k) & T-STAT & P-value \tabularnewline
1 & 0.257737 & 2.187 & 0.015997 \tabularnewline
2 & 0.090262 & 0.7659 & 0.22312 \tabularnewline
3 & -0.16705 & -1.4175 & 0.08033 \tabularnewline
4 & -0.248304 & -2.1069 & 0.019304 \tabularnewline
5 & -0.245015 & -2.079 & 0.020589 \tabularnewline
6 & 0.18146 & 1.5397 & 0.064004 \tabularnewline
7 & -0.162868 & -1.382 & 0.085625 \tabularnewline
8 & -0.17082 & -1.4495 & 0.075777 \tabularnewline
9 & -0.160688 & -1.3635 & 0.08849 \tabularnewline
10 & -0.010882 & -0.0923 & 0.463345 \tabularnewline
11 & 0.113331 & 0.9616 & 0.169722 \tabularnewline
12 & 0.736265 & 6.2474 & 0 \tabularnewline
13 & 0.160054 & 1.3581 & 0.089336 \tabularnewline
14 & 0.061781 & 0.5242 & 0.300865 \tabularnewline
15 & -0.178477 & -1.5144 & 0.067147 \tabularnewline
16 & -0.256066 & -2.1728 & 0.016544 \tabularnewline
17 & -0.252803 & -2.1451 & 0.017659 \tabularnewline
18 & 0.117284 & 0.9952 & 0.161489 \tabularnewline
19 & -0.151065 & -1.2818 & 0.102008 \tabularnewline
20 & -0.159953 & -1.3572 & 0.089471 \tabularnewline
21 & -0.187411 & -1.5902 & 0.058081 \tabularnewline
22 & -0.056799 & -0.482 & 0.315651 \tabularnewline
23 & 0.043339 & 0.3677 & 0.357072 \tabularnewline
24 & 0.548654 & 4.6555 & 7e-06 \tabularnewline
25 & 0.132879 & 1.1275 & 0.131634 \tabularnewline
26 & 0.053658 & 0.4553 & 0.32513 \tabularnewline
27 & -0.154329 & -1.3095 & 0.09726 \tabularnewline
28 & -0.229516 & -1.9475 & 0.027687 \tabularnewline
29 & -0.248682 & -2.1101 & 0.019161 \tabularnewline
30 & 0.062288 & 0.5285 & 0.299377 \tabularnewline
31 & -0.08751 & -0.7425 & 0.230087 \tabularnewline
32 & -0.105632 & -0.8963 & 0.186534 \tabularnewline
33 & -0.108073 & -0.917 & 0.181095 \tabularnewline
34 & 8.3e-05 & 7e-04 & 0.49972 \tabularnewline
35 & 0.063585 & 0.5395 & 0.295591 \tabularnewline
36 & 0.425205 & 3.608 & 0.000283 \tabularnewline
37 & 0.151773 & 1.2878 & 0.100964 \tabularnewline
38 & 0.073221 & 0.6213 & 0.268182 \tabularnewline
39 & -0.088058 & -0.7472 & 0.228689 \tabularnewline
40 & -0.164577 & -1.3965 & 0.083429 \tabularnewline
41 & -0.176005 & -1.4935 & 0.069844 \tabularnewline
42 & 0.044359 & 0.3764 & 0.353865 \tabularnewline
43 & -0.019047 & -0.1616 & 0.436028 \tabularnewline
44 & -0.045962 & -0.39 & 0.348844 \tabularnewline
45 & -0.05152 & -0.4372 & 0.331651 \tabularnewline
46 & 0.00585 & 0.0496 & 0.480275 \tabularnewline
47 & 0.041203 & 0.3496 & 0.363822 \tabularnewline
48 & 0.26281 & 2.23 & 0.014432 \tabularnewline
\hline
\end{tabular}
%Source: https://freestatistics.org/blog/index.php?pk=226027&T=1

[TABLE]
[ROW][C]Autocorrelation Function[/C][/ROW]
[ROW][C]Time lag k[/C][C]ACF(k)[/C][C]T-STAT[/C][C]P-value[/C][/ROW]
[ROW][C]1[/C][C]0.257737[/C][C]2.187[/C][C]0.015997[/C][/ROW]
[ROW][C]2[/C][C]0.090262[/C][C]0.7659[/C][C]0.22312[/C][/ROW]
[ROW][C]3[/C][C]-0.16705[/C][C]-1.4175[/C][C]0.08033[/C][/ROW]
[ROW][C]4[/C][C]-0.248304[/C][C]-2.1069[/C][C]0.019304[/C][/ROW]
[ROW][C]5[/C][C]-0.245015[/C][C]-2.079[/C][C]0.020589[/C][/ROW]
[ROW][C]6[/C][C]0.18146[/C][C]1.5397[/C][C]0.064004[/C][/ROW]
[ROW][C]7[/C][C]-0.162868[/C][C]-1.382[/C][C]0.085625[/C][/ROW]
[ROW][C]8[/C][C]-0.17082[/C][C]-1.4495[/C][C]0.075777[/C][/ROW]
[ROW][C]9[/C][C]-0.160688[/C][C]-1.3635[/C][C]0.08849[/C][/ROW]
[ROW][C]10[/C][C]-0.010882[/C][C]-0.0923[/C][C]0.463345[/C][/ROW]
[ROW][C]11[/C][C]0.113331[/C][C]0.9616[/C][C]0.169722[/C][/ROW]
[ROW][C]12[/C][C]0.736265[/C][C]6.2474[/C][C]0[/C][/ROW]
[ROW][C]13[/C][C]0.160054[/C][C]1.3581[/C][C]0.089336[/C][/ROW]
[ROW][C]14[/C][C]0.061781[/C][C]0.5242[/C][C]0.300865[/C][/ROW]
[ROW][C]15[/C][C]-0.178477[/C][C]-1.5144[/C][C]0.067147[/C][/ROW]
[ROW][C]16[/C][C]-0.256066[/C][C]-2.1728[/C][C]0.016544[/C][/ROW]
[ROW][C]17[/C][C]-0.252803[/C][C]-2.1451[/C][C]0.017659[/C][/ROW]
[ROW][C]18[/C][C]0.117284[/C][C]0.9952[/C][C]0.161489[/C][/ROW]
[ROW][C]19[/C][C]-0.151065[/C][C]-1.2818[/C][C]0.102008[/C][/ROW]
[ROW][C]20[/C][C]-0.159953[/C][C]-1.3572[/C][C]0.089471[/C][/ROW]
[ROW][C]21[/C][C]-0.187411[/C][C]-1.5902[/C][C]0.058081[/C][/ROW]
[ROW][C]22[/C][C]-0.056799[/C][C]-0.482[/C][C]0.315651[/C][/ROW]
[ROW][C]23[/C][C]0.043339[/C][C]0.3677[/C][C]0.357072[/C][/ROW]
[ROW][C]24[/C][C]0.548654[/C][C]4.6555[/C][C]7e-06[/C][/ROW]
[ROW][C]25[/C][C]0.132879[/C][C]1.1275[/C][C]0.131634[/C][/ROW]
[ROW][C]26[/C][C]0.053658[/C][C]0.4553[/C][C]0.32513[/C][/ROW]
[ROW][C]27[/C][C]-0.154329[/C][C]-1.3095[/C][C]0.09726[/C][/ROW]
[ROW][C]28[/C][C]-0.229516[/C][C]-1.9475[/C][C]0.027687[/C][/ROW]
[ROW][C]29[/C][C]-0.248682[/C][C]-2.1101[/C][C]0.019161[/C][/ROW]
[ROW][C]30[/C][C]0.062288[/C][C]0.5285[/C][C]0.299377[/C][/ROW]
[ROW][C]31[/C][C]-0.08751[/C][C]-0.7425[/C][C]0.230087[/C][/ROW]
[ROW][C]32[/C][C]-0.105632[/C][C]-0.8963[/C][C]0.186534[/C][/ROW]
[ROW][C]33[/C][C]-0.108073[/C][C]-0.917[/C][C]0.181095[/C][/ROW]
[ROW][C]34[/C][C]8.3e-05[/C][C]7e-04[/C][C]0.49972[/C][/ROW]
[ROW][C]35[/C][C]0.063585[/C][C]0.5395[/C][C]0.295591[/C][/ROW]
[ROW][C]36[/C][C]0.425205[/C][C]3.608[/C][C]0.000283[/C][/ROW]
[ROW][C]37[/C][C]0.151773[/C][C]1.2878[/C][C]0.100964[/C][/ROW]
[ROW][C]38[/C][C]0.073221[/C][C]0.6213[/C][C]0.268182[/C][/ROW]
[ROW][C]39[/C][C]-0.088058[/C][C]-0.7472[/C][C]0.228689[/C][/ROW]
[ROW][C]40[/C][C]-0.164577[/C][C]-1.3965[/C][C]0.083429[/C][/ROW]
[ROW][C]41[/C][C]-0.176005[/C][C]-1.4935[/C][C]0.069844[/C][/ROW]
[ROW][C]42[/C][C]0.044359[/C][C]0.3764[/C][C]0.353865[/C][/ROW]
[ROW][C]43[/C][C]-0.019047[/C][C]-0.1616[/C][C]0.436028[/C][/ROW]
[ROW][C]44[/C][C]-0.045962[/C][C]-0.39[/C][C]0.348844[/C][/ROW]
[ROW][C]45[/C][C]-0.05152[/C][C]-0.4372[/C][C]0.331651[/C][/ROW]
[ROW][C]46[/C][C]0.00585[/C][C]0.0496[/C][C]0.480275[/C][/ROW]
[ROW][C]47[/C][C]0.041203[/C][C]0.3496[/C][C]0.363822[/C][/ROW]
[ROW][C]48[/C][C]0.26281[/C][C]2.23[/C][C]0.014432[/C][/ROW]
[/TABLE]
Source: https://freestatistics.org/blog/index.php?pk=226027&T=1

Globally Unique Identifier (entire table): ba.freestatistics.org/blog/index.php?pk=226027&T=1

As an alternative you can also use a QR Code:  

The GUIDs for individual cells are displayed in the table below:

Autocorrelation Function
Time lag kACF(k)T-STATP-value
10.2577372.1870.015997
20.0902620.76590.22312
3-0.16705-1.41750.08033
4-0.248304-2.10690.019304
5-0.245015-2.0790.020589
60.181461.53970.064004
7-0.162868-1.3820.085625
8-0.17082-1.44950.075777
9-0.160688-1.36350.08849
10-0.010882-0.09230.463345
110.1133310.96160.169722
120.7362656.24740
130.1600541.35810.089336
140.0617810.52420.300865
15-0.178477-1.51440.067147
16-0.256066-2.17280.016544
17-0.252803-2.14510.017659
180.1172840.99520.161489
19-0.151065-1.28180.102008
20-0.159953-1.35720.089471
21-0.187411-1.59020.058081
22-0.056799-0.4820.315651
230.0433390.36770.357072
240.5486544.65557e-06
250.1328791.12750.131634
260.0536580.45530.32513
27-0.154329-1.30950.09726
28-0.229516-1.94750.027687
29-0.248682-2.11010.019161
300.0622880.52850.299377
31-0.08751-0.74250.230087
32-0.105632-0.89630.186534
33-0.108073-0.9170.181095
348.3e-057e-040.49972
350.0635850.53950.295591
360.4252053.6080.000283
370.1517731.28780.100964
380.0732210.62130.268182
39-0.088058-0.74720.228689
40-0.164577-1.39650.083429
41-0.176005-1.49350.069844
420.0443590.37640.353865
43-0.019047-0.16160.436028
44-0.045962-0.390.348844
45-0.05152-0.43720.331651
460.005850.04960.480275
470.0412030.34960.363822
480.262812.230.014432


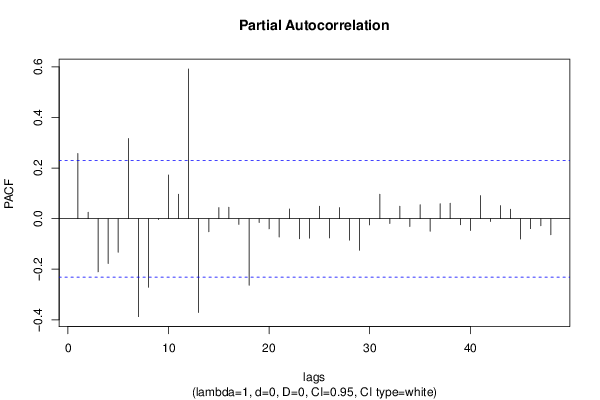
Partial Autocorrelation Function
Time lag kPACF(k)T-STATP-value
10.2577372.1870.015997
20.025530.21660.414556
3-0.210405-1.78530.039209
4-0.177529-1.50640.068172
5-0.132636-1.12550.132067
60.3170422.69020.004435
7-0.387588-3.28880.000779
8-0.271209-2.30130.012136
9-0.003054-0.02590.489698
100.172741.46570.073535
110.0964050.8180.208022
120.5921395.02452e-06
13-0.371405-3.15150.001184
14-0.051641-0.43820.331281
150.0438170.37180.355567
160.0452020.38350.351222
17-0.022595-0.19170.424249
18-0.263413-2.23510.014256
19-0.015278-0.12960.448607
20-0.04032-0.34210.366625
21-0.0723-0.61350.270746
220.0379970.32240.374036
23-0.079446-0.67410.251195
24-0.07692-0.65270.258019
250.0491550.41710.338925
26-0.076041-0.64520.260414
270.0436650.37050.356045
28-0.0849-0.72040.236806
29-0.12496-1.06030.146272
30-0.024651-0.20920.417452
310.0962610.81680.208367
32-0.01932-0.16390.43512
330.0493190.41850.338418
34-0.030772-0.26110.397376
350.0548120.46510.321632
36-0.049697-0.42170.337254
370.0592790.5030.30825
380.0611710.51910.302659
39-0.023948-0.20320.419775
40-0.047164-0.40020.345097
410.0912960.77470.220534
42-0.011591-0.09840.460962
430.0515970.43780.331417
440.0372240.31590.376514
45-0.080833-0.68590.247491
46-0.039381-0.33420.369614
47-0.02812-0.23860.406044
48-0.063902-0.54220.294669

\begin{tabular}{lllllllll}
\hline
Partial Autocorrelation Function \tabularnewline
Time lag k & PACF(k) & T-STAT & P-value \tabularnewline
1 & 0.257737 & 2.187 & 0.015997 \tabularnewline
2 & 0.02553 & 0.2166 & 0.414556 \tabularnewline
3 & -0.210405 & -1.7853 & 0.039209 \tabularnewline
4 & -0.177529 & -1.5064 & 0.068172 \tabularnewline
5 & -0.132636 & -1.1255 & 0.132067 \tabularnewline
6 & 0.317042 & 2.6902 & 0.004435 \tabularnewline
7 & -0.387588 & -3.2888 & 0.000779 \tabularnewline
8 & -0.271209 & -2.3013 & 0.012136 \tabularnewline
9 & -0.003054 & -0.0259 & 0.489698 \tabularnewline
10 & 0.17274 & 1.4657 & 0.073535 \tabularnewline
11 & 0.096405 & 0.818 & 0.208022 \tabularnewline
12 & 0.592139 & 5.0245 & 2e-06 \tabularnewline
13 & -0.371405 & -3.1515 & 0.001184 \tabularnewline
14 & -0.051641 & -0.4382 & 0.331281 \tabularnewline
15 & 0.043817 & 0.3718 & 0.355567 \tabularnewline
16 & 0.045202 & 0.3835 & 0.351222 \tabularnewline
17 & -0.022595 & -0.1917 & 0.424249 \tabularnewline
18 & -0.263413 & -2.2351 & 0.014256 \tabularnewline
19 & -0.015278 & -0.1296 & 0.448607 \tabularnewline
20 & -0.04032 & -0.3421 & 0.366625 \tabularnewline
21 & -0.0723 & -0.6135 & 0.270746 \tabularnewline
22 & 0.037997 & 0.3224 & 0.374036 \tabularnewline
23 & -0.079446 & -0.6741 & 0.251195 \tabularnewline
24 & -0.07692 & -0.6527 & 0.258019 \tabularnewline
25 & 0.049155 & 0.4171 & 0.338925 \tabularnewline
26 & -0.076041 & -0.6452 & 0.260414 \tabularnewline
27 & 0.043665 & 0.3705 & 0.356045 \tabularnewline
28 & -0.0849 & -0.7204 & 0.236806 \tabularnewline
29 & -0.12496 & -1.0603 & 0.146272 \tabularnewline
30 & -0.024651 & -0.2092 & 0.417452 \tabularnewline
31 & 0.096261 & 0.8168 & 0.208367 \tabularnewline
32 & -0.01932 & -0.1639 & 0.43512 \tabularnewline
33 & 0.049319 & 0.4185 & 0.338418 \tabularnewline
34 & -0.030772 & -0.2611 & 0.397376 \tabularnewline
35 & 0.054812 & 0.4651 & 0.321632 \tabularnewline
36 & -0.049697 & -0.4217 & 0.337254 \tabularnewline
37 & 0.059279 & 0.503 & 0.30825 \tabularnewline
38 & 0.061171 & 0.5191 & 0.302659 \tabularnewline
39 & -0.023948 & -0.2032 & 0.419775 \tabularnewline
40 & -0.047164 & -0.4002 & 0.345097 \tabularnewline
41 & 0.091296 & 0.7747 & 0.220534 \tabularnewline
42 & -0.011591 & -0.0984 & 0.460962 \tabularnewline
43 & 0.051597 & 0.4378 & 0.331417 \tabularnewline
44 & 0.037224 & 0.3159 & 0.376514 \tabularnewline
45 & -0.080833 & -0.6859 & 0.247491 \tabularnewline
46 & -0.039381 & -0.3342 & 0.369614 \tabularnewline
47 & -0.02812 & -0.2386 & 0.406044 \tabularnewline
48 & -0.063902 & -0.5422 & 0.294669 \tabularnewline
\hline
\end{tabular}
%Source: https://freestatistics.org/blog/index.php?pk=226027&T=2

[TABLE]
[ROW][C]Partial Autocorrelation Function[/C][/ROW]
[ROW][C]Time lag k[/C][C]PACF(k)[/C][C]T-STAT[/C][C]P-value[/C][/ROW]
[ROW][C]1[/C][C]0.257737[/C][C]2.187[/C][C]0.015997[/C][/ROW]
[ROW][C]2[/C][C]0.02553[/C][C]0.2166[/C][C]0.414556[/C][/ROW]
[ROW][C]3[/C][C]-0.210405[/C][C]-1.7853[/C][C]0.039209[/C][/ROW]
[ROW][C]4[/C][C]-0.177529[/C][C]-1.5064[/C][C]0.068172[/C][/ROW]
[ROW][C]5[/C][C]-0.132636[/C][C]-1.1255[/C][C]0.132067[/C][/ROW]
[ROW][C]6[/C][C]0.317042[/C][C]2.6902[/C][C]0.004435[/C][/ROW]
[ROW][C]7[/C][C]-0.387588[/C][C]-3.2888[/C][C]0.000779[/C][/ROW]
[ROW][C]8[/C][C]-0.271209[/C][C]-2.3013[/C][C]0.012136[/C][/ROW]
[ROW][C]9[/C][C]-0.003054[/C][C]-0.0259[/C][C]0.489698[/C][/ROW]
[ROW][C]10[/C][C]0.17274[/C][C]1.4657[/C][C]0.073535[/C][/ROW]
[ROW][C]11[/C][C]0.096405[/C][C]0.818[/C][C]0.208022[/C][/ROW]
[ROW][C]12[/C][C]0.592139[/C][C]5.0245[/C][C]2e-06[/C][/ROW]
[ROW][C]13[/C][C]-0.371405[/C][C]-3.1515[/C][C]0.001184[/C][/ROW]
[ROW][C]14[/C][C]-0.051641[/C][C]-0.4382[/C][C]0.331281[/C][/ROW]
[ROW][C]15[/C][C]0.043817[/C][C]0.3718[/C][C]0.355567[/C][/ROW]
[ROW][C]16[/C][C]0.045202[/C][C]0.3835[/C][C]0.351222[/C][/ROW]
[ROW][C]17[/C][C]-0.022595[/C][C]-0.1917[/C][C]0.424249[/C][/ROW]
[ROW][C]18[/C][C]-0.263413[/C][C]-2.2351[/C][C]0.014256[/C][/ROW]
[ROW][C]19[/C][C]-0.015278[/C][C]-0.1296[/C][C]0.448607[/C][/ROW]
[ROW][C]20[/C][C]-0.04032[/C][C]-0.3421[/C][C]0.366625[/C][/ROW]
[ROW][C]21[/C][C]-0.0723[/C][C]-0.6135[/C][C]0.270746[/C][/ROW]
[ROW][C]22[/C][C]0.037997[/C][C]0.3224[/C][C]0.374036[/C][/ROW]
[ROW][C]23[/C][C]-0.079446[/C][C]-0.6741[/C][C]0.251195[/C][/ROW]
[ROW][C]24[/C][C]-0.07692[/C][C]-0.6527[/C][C]0.258019[/C][/ROW]
[ROW][C]25[/C][C]0.049155[/C][C]0.4171[/C][C]0.338925[/C][/ROW]
[ROW][C]26[/C][C]-0.076041[/C][C]-0.6452[/C][C]0.260414[/C][/ROW]
[ROW][C]27[/C][C]0.043665[/C][C]0.3705[/C][C]0.356045[/C][/ROW]
[ROW][C]28[/C][C]-0.0849[/C][C]-0.7204[/C][C]0.236806[/C][/ROW]
[ROW][C]29[/C][C]-0.12496[/C][C]-1.0603[/C][C]0.146272[/C][/ROW]
[ROW][C]30[/C][C]-0.024651[/C][C]-0.2092[/C][C]0.417452[/C][/ROW]
[ROW][C]31[/C][C]0.096261[/C][C]0.8168[/C][C]0.208367[/C][/ROW]
[ROW][C]32[/C][C]-0.01932[/C][C]-0.1639[/C][C]0.43512[/C][/ROW]
[ROW][C]33[/C][C]0.049319[/C][C]0.4185[/C][C]0.338418[/C][/ROW]
[ROW][C]34[/C][C]-0.030772[/C][C]-0.2611[/C][C]0.397376[/C][/ROW]
[ROW][C]35[/C][C]0.054812[/C][C]0.4651[/C][C]0.321632[/C][/ROW]
[ROW][C]36[/C][C]-0.049697[/C][C]-0.4217[/C][C]0.337254[/C][/ROW]
[ROW][C]37[/C][C]0.059279[/C][C]0.503[/C][C]0.30825[/C][/ROW]
[ROW][C]38[/C][C]0.061171[/C][C]0.5191[/C][C]0.302659[/C][/ROW]
[ROW][C]39[/C][C]-0.023948[/C][C]-0.2032[/C][C]0.419775[/C][/ROW]
[ROW][C]40[/C][C]-0.047164[/C][C]-0.4002[/C][C]0.345097[/C][/ROW]
[ROW][C]41[/C][C]0.091296[/C][C]0.7747[/C][C]0.220534[/C][/ROW]
[ROW][C]42[/C][C]-0.011591[/C][C]-0.0984[/C][C]0.460962[/C][/ROW]
[ROW][C]43[/C][C]0.051597[/C][C]0.4378[/C][C]0.331417[/C][/ROW]
[ROW][C]44[/C][C]0.037224[/C][C]0.3159[/C][C]0.376514[/C][/ROW]
[ROW][C]45[/C][C]-0.080833[/C][C]-0.6859[/C][C]0.247491[/C][/ROW]
[ROW][C]46[/C][C]-0.039381[/C][C]-0.3342[/C][C]0.369614[/C][/ROW]
[ROW][C]47[/C][C]-0.02812[/C][C]-0.2386[/C][C]0.406044[/C][/ROW]
[ROW][C]48[/C][C]-0.063902[/C][C]-0.5422[/C][C]0.294669[/C][/ROW]
[/TABLE]
Source: https://freestatistics.org/blog/index.php?pk=226027&T=2

Globally Unique Identifier (entire table): ba.freestatistics.org/blog/index.php?pk=226027&T=2

As an alternative you can also use a QR Code:  

The GUIDs for individual cells are displayed in the table below:

Partial Autocorrelation Function
Time lag kPACF(k)T-STATP-value
10.2577372.1870.015997
20.025530.21660.414556
3-0.210405-1.78530.039209
4-0.177529-1.50640.068172
5-0.132636-1.12550.132067
60.3170422.69020.004435
7-0.387588-3.28880.000779
8-0.271209-2.30130.012136
9-0.003054-0.02590.489698
100.172741.46570.073535
110.0964050.8180.208022
120.5921395.02452e-06
13-0.371405-3.15150.001184
14-0.051641-0.43820.331281
150.0438170.37180.355567
160.0452020.38350.351222
17-0.022595-0.19170.424249
18-0.263413-2.23510.014256
19-0.015278-0.12960.448607
20-0.04032-0.34210.366625
21-0.0723-0.61350.270746
220.0379970.32240.374036
23-0.079446-0.67410.251195
24-0.07692-0.65270.258019
250.0491550.41710.338925
26-0.076041-0.64520.260414
270.0436650.37050.356045
28-0.0849-0.72040.236806
29-0.12496-1.06030.146272
30-0.024651-0.20920.417452
310.0962610.81680.208367
32-0.01932-0.16390.43512
330.0493190.41850.338418
34-0.030772-0.26110.397376
350.0548120.46510.321632
36-0.049697-0.42170.337254
370.0592790.5030.30825
380.0611710.51910.302659
39-0.023948-0.20320.419775
40-0.047164-0.40020.345097
410.0912960.77470.220534
42-0.011591-0.09840.460962
430.0515970.43780.331417
440.0372240.31590.376514
45-0.080833-0.68590.247491
46-0.039381-0.33420.369614
47-0.02812-0.23860.406044
48-0.063902-0.54220.294669


Parameters (Session):
par1 = 48 ; par2 = 1 ; par3 = 0 ; par4 = 0 ; par5 = 12 ; par6 = White Noise ; par7 = 0.95 ;
Parameters (R input):
par1 = 48 ; par2 = 1 ; par3 = 0 ; par4 = 0 ; par5 = 12 ; par6 = White Noise ; par7 = 0.95 ; par8 = ;
R code (references can be found in the software module):
par8 <- ''
par7 <- '0.95'
par6 <- 'White Noise'
par5 <- '12'
par4 <- '0'
par3 <- '0'
par2 <- '1'
par1 <- 'Default'
if (par1 == 'Default') {
par1 = 10*log10(length(x))
} else {
par1 <- as.numeric(par1)
}
par2 <- as.numeric(par2)
par3 <- as.numeric(par3)
par4 <- as.numeric(par4)
par5 <- as.numeric(par5)
if (par6 == 'White Noise') par6 <- 'white' else par6 <- 'ma'
par7 <- as.numeric(par7)
if (par8 != '') par8 <- as.numeric(par8)
ox <- x
if (par8 == '') {
if (par2 == 0) {
x <- log(x)
} else {
x <- (x ^ par2 - 1) / par2
}
} else {
x <- log(x,base=par8)
}
if (par3 > 0) x <- diff(x,lag=1,difference=par3)
if (par4 > 0) x <- diff(x,lag=par5,difference=par4)
bitmap(file='picts.png')
op <- par(mfrow=c(2,1))
plot(ox,type='l',main='Original Time Series',xlab='time',ylab='value')
if (par8=='') {
mytitle <- paste('Working Time Series (lambda=',par2,', d=',par3,', D=',par4,')',sep='')
mysub <- paste('(lambda=',par2,', d=',par3,', D=',par4,', CI=', par7, ', CI type=',par6,')',sep='')
} else {
mytitle <- paste('Working Time Series (base=',par8,', d=',par3,', D=',par4,')',sep='')
mysub <- paste('(base=',par8,', d=',par3,', D=',par4,', CI=', par7, ', CI type=',par6,')',sep='')
}
plot(x,type='l', main=mytitle,xlab='time',ylab='value')
par(op)
dev.off()
bitmap(file='pic1.png')
racf <- acf(x, par1, main='Autocorrelation', xlab='time lag', ylab='ACF', ci.type=par6, ci=par7, sub=mysub)
dev.off()
bitmap(file='pic2.png')
rpacf <- pacf(x,par1,main='Partial Autocorrelation',xlab='lags',ylab='PACF',sub=mysub)
dev.off()
(myacf <- c(racf$acf))
(mypacf <- c(rpacf$acf))
lengthx <- length(x)
sqrtn <- sqrt(lengthx)
load(file='createtable')
a<-table.start()
a<-table.row.start(a)
a<-table.element(a,'Autocorrelation Function',4,TRUE)
a<-table.row.end(a)
a<-table.row.start(a)
a<-table.element(a,'Time lag k',header=TRUE)
a<-table.element(a,hyperlink('basics.htm','ACF(k)','click here for more information about the Autocorrelation Function'),header=TRUE)
a<-table.element(a,'T-STAT',header=TRUE)
a<-table.element(a,'P-value',header=TRUE)
a<-table.row.end(a)
for (i in 2:(par1+1)) {
a<-table.row.start(a)
a<-table.element(a,i-1,header=TRUE)
a<-table.element(a,round(myacf[i],6))
mytstat <- myacf[i]*sqrtn
a<-table.element(a,round(mytstat,4))
a<-table.element(a,round(1-pt(abs(mytstat),lengthx),6))
a<-table.row.end(a)
}
a<-table.end(a)
table.save(a,file='mytable.tab')
a<-table.start()
a<-table.row.start(a)
a<-table.element(a,'Partial Autocorrelation Function',4,TRUE)
a<-table.row.end(a)
a<-table.row.start(a)
a<-table.element(a,'Time lag k',header=TRUE)
a<-table.element(a,hyperlink('basics.htm','PACF(k)','click here for more information about the Partial Autocorrelation Function'),header=TRUE)
a<-table.element(a,'T-STAT',header=TRUE)
a<-table.element(a,'P-value',header=TRUE)
a<-table.row.end(a)
for (i in 1:par1) {
a<-table.row.start(a)
a<-table.element(a,i,header=TRUE)
a<-table.element(a,round(mypacf[i],6))
mytstat <- mypacf[i]*sqrtn
a<-table.element(a,round(mytstat,4))
a<-table.element(a,round(1-pt(abs(mytstat),lengthx),6))
a<-table.row.end(a)
}
a<-table.end(a)
table.save(a,file='mytable1.tab')