Free Statistics

of Irreproducible Research!

Author's title

Author*Unverified author*
R Software Modulerwasp_autocorrelation.wasp
Title produced by software(Partial) Autocorrelation Function
Date of computationMon, 18 Nov 2013 06:28:54 -0500
Cite this page as followsStatistical Computations at FreeStatistics.org, Office for Research Development and Education, URL https://freestatistics.org/blog/index.php?v=date/2013/Nov/18/t1384774204hbosyn7uzibzghn.htm/, Retrieved Sat, 27 Apr 2024 12:26:25 +0000
Statistical Computations at FreeStatistics.org, Office for Research Development and Education, URL https://freestatistics.org/blog/index.php?pk=226035, Retrieved Sat, 27 Apr 2024 12:26:25 +0000
QR Codes:

Original text written by user:
IsPrivate?No (this computation is public)
User-defined keywords
Estimated Impact74
Family? (F = Feedback message, R = changed R code, M = changed R Module, P = changed Parameters, D = changed Data)
-       [(Partial) Autocorrelation Function] [] [2013-11-18 11:28:54] [0f9b748f6fe1dd88ddc67537cf760c5a] [Current]
Feedback Forum

Post a new message
Dataseries X:
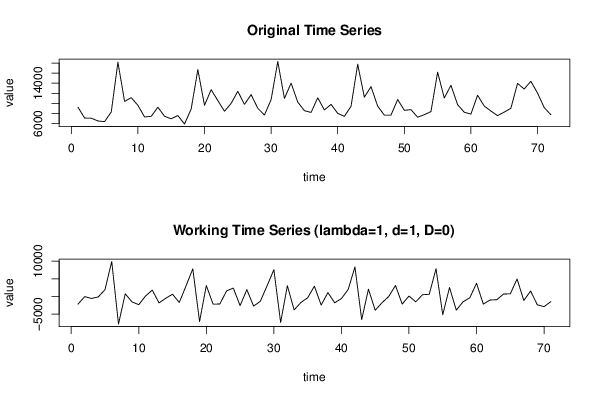
9244
7074
7044
6492
6362
8287
18177
10379
11130
9606
7294
7415
9230
7423
6927
7572
5877
8878
16706
9611
12714
10549
8421
9993
12384
9798
11738
9011
7673
10736
18316
10973
14027
10242
8547
8187
11101
8685
9790
8003
7412
9397
17774
11230
13321
9432
7653
7651
10762
8614
8748
7235
7735
8360
16202
11053
13593
9738
8226
7866
11606
9456
8471
7553
8259
9009
13968
12844
14388
12048
9167
7733


Summary of computational transaction
Raw Inputview raw input (R code)
Raw Outputview raw output of R engine
Computing time3 seconds
R Server'Gwilym Jenkins' @ jenkins.wessa.net

\begin{tabular}{lllllllll}
\hline
Summary of computational transaction \tabularnewline
Raw Input & view raw input (R code)  \tabularnewline
Raw Output & view raw output of R engine  \tabularnewline
Computing time & 3 seconds \tabularnewline
R Server & 'Gwilym Jenkins' @ jenkins.wessa.net \tabularnewline
\hline
\end{tabular}
%Source: https://freestatistics.org/blog/index.php?pk=226035&T=0

[TABLE]
[ROW][C]Summary of computational transaction[/C][/ROW]
[ROW][C]Raw Input[/C][C]view raw input (R code) [/C][/ROW]
[ROW][C]Raw Output[/C][C]view raw output of R engine [/C][/ROW]
[ROW][C]Computing time[/C][C]3 seconds[/C][/ROW]
[ROW][C]R Server[/C][C]'Gwilym Jenkins' @ jenkins.wessa.net[/C][/ROW]
[/TABLE]
Source: https://freestatistics.org/blog/index.php?pk=226035&T=0

Globally Unique Identifier (entire table): ba.freestatistics.org/blog/index.php?pk=226035&T=0

As an alternative you can also use a QR Code:  

The GUIDs for individual cells are displayed in the table below:

Summary of computational transaction
Raw Inputview raw input (R code)
Raw Outputview raw output of R engine
Computing time3 seconds
R Server'Gwilym Jenkins' @ jenkins.wessa.net


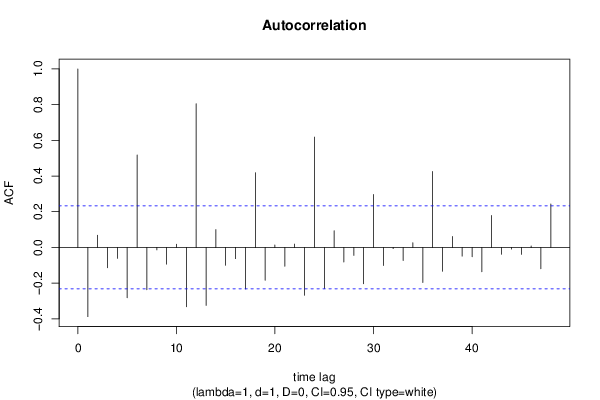
Autocorrelation Function
Time lag kACF(k)T-STATP-value
1-0.38776-3.26730.000837
20.0685730.57780.282612
3-0.113506-0.95640.171054
4-0.061327-0.51670.303469
5-0.282194-2.37780.010056
60.5178294.36332.1e-05
7-0.236764-1.9950.02494
8-0.013566-0.11430.454658
9-0.093629-0.78890.21639
100.018010.15180.439905
11-0.332298-2.80.003289
120.8047426.78090
13-0.32464-2.73550.003931
140.0998770.84160.201425
15-0.09948-0.83820.202356
16-0.062816-0.52930.299126
17-0.232459-1.95870.027036
180.4187643.52860.000369
19-0.183684-1.54770.063064
200.0137840.11610.453933
21-0.105111-0.88570.189389
220.0184850.15580.438333
23-0.26773-2.25590.013578
240.6182675.20961e-06
25-0.230464-1.94190.028057
260.0935640.78840.216548
27-0.082071-0.69150.24574
28-0.044543-0.37530.354268
29-0.203883-1.71790.045083
300.2966642.49970.007371
31-0.100873-0.850.199099
32-0.006637-0.05590.477778
33-0.073561-0.61980.268675
340.0259120.21830.413896
35-0.196043-1.65190.051487
360.4253313.58390.000308
37-0.133278-1.1230.132607
380.0614770.5180.30303
39-0.048932-0.41230.340679
40-0.052588-0.44310.329514
41-0.135986-1.14580.127854
420.1794691.51220.067456
43-0.03849-0.32430.373325
44-0.009311-0.07850.468845
45-0.0388-0.32690.372341
460.0083430.07030.472077
47-0.119404-1.00610.158888
480.2432972.05010.022026

\begin{tabular}{lllllllll}
\hline
Autocorrelation Function \tabularnewline
Time lag k & ACF(k) & T-STAT & P-value \tabularnewline
1 & -0.38776 & -3.2673 & 0.000837 \tabularnewline
2 & 0.068573 & 0.5778 & 0.282612 \tabularnewline
3 & -0.113506 & -0.9564 & 0.171054 \tabularnewline
4 & -0.061327 & -0.5167 & 0.303469 \tabularnewline
5 & -0.282194 & -2.3778 & 0.010056 \tabularnewline
6 & 0.517829 & 4.3633 & 2.1e-05 \tabularnewline
7 & -0.236764 & -1.995 & 0.02494 \tabularnewline
8 & -0.013566 & -0.1143 & 0.454658 \tabularnewline
9 & -0.093629 & -0.7889 & 0.21639 \tabularnewline
10 & 0.01801 & 0.1518 & 0.439905 \tabularnewline
11 & -0.332298 & -2.8 & 0.003289 \tabularnewline
12 & 0.804742 & 6.7809 & 0 \tabularnewline
13 & -0.32464 & -2.7355 & 0.003931 \tabularnewline
14 & 0.099877 & 0.8416 & 0.201425 \tabularnewline
15 & -0.09948 & -0.8382 & 0.202356 \tabularnewline
16 & -0.062816 & -0.5293 & 0.299126 \tabularnewline
17 & -0.232459 & -1.9587 & 0.027036 \tabularnewline
18 & 0.418764 & 3.5286 & 0.000369 \tabularnewline
19 & -0.183684 & -1.5477 & 0.063064 \tabularnewline
20 & 0.013784 & 0.1161 & 0.453933 \tabularnewline
21 & -0.105111 & -0.8857 & 0.189389 \tabularnewline
22 & 0.018485 & 0.1558 & 0.438333 \tabularnewline
23 & -0.26773 & -2.2559 & 0.013578 \tabularnewline
24 & 0.618267 & 5.2096 & 1e-06 \tabularnewline
25 & -0.230464 & -1.9419 & 0.028057 \tabularnewline
26 & 0.093564 & 0.7884 & 0.216548 \tabularnewline
27 & -0.082071 & -0.6915 & 0.24574 \tabularnewline
28 & -0.044543 & -0.3753 & 0.354268 \tabularnewline
29 & -0.203883 & -1.7179 & 0.045083 \tabularnewline
30 & 0.296664 & 2.4997 & 0.007371 \tabularnewline
31 & -0.100873 & -0.85 & 0.199099 \tabularnewline
32 & -0.006637 & -0.0559 & 0.477778 \tabularnewline
33 & -0.073561 & -0.6198 & 0.268675 \tabularnewline
34 & 0.025912 & 0.2183 & 0.413896 \tabularnewline
35 & -0.196043 & -1.6519 & 0.051487 \tabularnewline
36 & 0.425331 & 3.5839 & 0.000308 \tabularnewline
37 & -0.133278 & -1.123 & 0.132607 \tabularnewline
38 & 0.061477 & 0.518 & 0.30303 \tabularnewline
39 & -0.048932 & -0.4123 & 0.340679 \tabularnewline
40 & -0.052588 & -0.4431 & 0.329514 \tabularnewline
41 & -0.135986 & -1.1458 & 0.127854 \tabularnewline
42 & 0.179469 & 1.5122 & 0.067456 \tabularnewline
43 & -0.03849 & -0.3243 & 0.373325 \tabularnewline
44 & -0.009311 & -0.0785 & 0.468845 \tabularnewline
45 & -0.0388 & -0.3269 & 0.372341 \tabularnewline
46 & 0.008343 & 0.0703 & 0.472077 \tabularnewline
47 & -0.119404 & -1.0061 & 0.158888 \tabularnewline
48 & 0.243297 & 2.0501 & 0.022026 \tabularnewline
\hline
\end{tabular}
%Source: https://freestatistics.org/blog/index.php?pk=226035&T=1

[TABLE]
[ROW][C]Autocorrelation Function[/C][/ROW]
[ROW][C]Time lag k[/C][C]ACF(k)[/C][C]T-STAT[/C][C]P-value[/C][/ROW]
[ROW][C]1[/C][C]-0.38776[/C][C]-3.2673[/C][C]0.000837[/C][/ROW]
[ROW][C]2[/C][C]0.068573[/C][C]0.5778[/C][C]0.282612[/C][/ROW]
[ROW][C]3[/C][C]-0.113506[/C][C]-0.9564[/C][C]0.171054[/C][/ROW]
[ROW][C]4[/C][C]-0.061327[/C][C]-0.5167[/C][C]0.303469[/C][/ROW]
[ROW][C]5[/C][C]-0.282194[/C][C]-2.3778[/C][C]0.010056[/C][/ROW]
[ROW][C]6[/C][C]0.517829[/C][C]4.3633[/C][C]2.1e-05[/C][/ROW]
[ROW][C]7[/C][C]-0.236764[/C][C]-1.995[/C][C]0.02494[/C][/ROW]
[ROW][C]8[/C][C]-0.013566[/C][C]-0.1143[/C][C]0.454658[/C][/ROW]
[ROW][C]9[/C][C]-0.093629[/C][C]-0.7889[/C][C]0.21639[/C][/ROW]
[ROW][C]10[/C][C]0.01801[/C][C]0.1518[/C][C]0.439905[/C][/ROW]
[ROW][C]11[/C][C]-0.332298[/C][C]-2.8[/C][C]0.003289[/C][/ROW]
[ROW][C]12[/C][C]0.804742[/C][C]6.7809[/C][C]0[/C][/ROW]
[ROW][C]13[/C][C]-0.32464[/C][C]-2.7355[/C][C]0.003931[/C][/ROW]
[ROW][C]14[/C][C]0.099877[/C][C]0.8416[/C][C]0.201425[/C][/ROW]
[ROW][C]15[/C][C]-0.09948[/C][C]-0.8382[/C][C]0.202356[/C][/ROW]
[ROW][C]16[/C][C]-0.062816[/C][C]-0.5293[/C][C]0.299126[/C][/ROW]
[ROW][C]17[/C][C]-0.232459[/C][C]-1.9587[/C][C]0.027036[/C][/ROW]
[ROW][C]18[/C][C]0.418764[/C][C]3.5286[/C][C]0.000369[/C][/ROW]
[ROW][C]19[/C][C]-0.183684[/C][C]-1.5477[/C][C]0.063064[/C][/ROW]
[ROW][C]20[/C][C]0.013784[/C][C]0.1161[/C][C]0.453933[/C][/ROW]
[ROW][C]21[/C][C]-0.105111[/C][C]-0.8857[/C][C]0.189389[/C][/ROW]
[ROW][C]22[/C][C]0.018485[/C][C]0.1558[/C][C]0.438333[/C][/ROW]
[ROW][C]23[/C][C]-0.26773[/C][C]-2.2559[/C][C]0.013578[/C][/ROW]
[ROW][C]24[/C][C]0.618267[/C][C]5.2096[/C][C]1e-06[/C][/ROW]
[ROW][C]25[/C][C]-0.230464[/C][C]-1.9419[/C][C]0.028057[/C][/ROW]
[ROW][C]26[/C][C]0.093564[/C][C]0.7884[/C][C]0.216548[/C][/ROW]
[ROW][C]27[/C][C]-0.082071[/C][C]-0.6915[/C][C]0.24574[/C][/ROW]
[ROW][C]28[/C][C]-0.044543[/C][C]-0.3753[/C][C]0.354268[/C][/ROW]
[ROW][C]29[/C][C]-0.203883[/C][C]-1.7179[/C][C]0.045083[/C][/ROW]
[ROW][C]30[/C][C]0.296664[/C][C]2.4997[/C][C]0.007371[/C][/ROW]
[ROW][C]31[/C][C]-0.100873[/C][C]-0.85[/C][C]0.199099[/C][/ROW]
[ROW][C]32[/C][C]-0.006637[/C][C]-0.0559[/C][C]0.477778[/C][/ROW]
[ROW][C]33[/C][C]-0.073561[/C][C]-0.6198[/C][C]0.268675[/C][/ROW]
[ROW][C]34[/C][C]0.025912[/C][C]0.2183[/C][C]0.413896[/C][/ROW]
[ROW][C]35[/C][C]-0.196043[/C][C]-1.6519[/C][C]0.051487[/C][/ROW]
[ROW][C]36[/C][C]0.425331[/C][C]3.5839[/C][C]0.000308[/C][/ROW]
[ROW][C]37[/C][C]-0.133278[/C][C]-1.123[/C][C]0.132607[/C][/ROW]
[ROW][C]38[/C][C]0.061477[/C][C]0.518[/C][C]0.30303[/C][/ROW]
[ROW][C]39[/C][C]-0.048932[/C][C]-0.4123[/C][C]0.340679[/C][/ROW]
[ROW][C]40[/C][C]-0.052588[/C][C]-0.4431[/C][C]0.329514[/C][/ROW]
[ROW][C]41[/C][C]-0.135986[/C][C]-1.1458[/C][C]0.127854[/C][/ROW]
[ROW][C]42[/C][C]0.179469[/C][C]1.5122[/C][C]0.067456[/C][/ROW]
[ROW][C]43[/C][C]-0.03849[/C][C]-0.3243[/C][C]0.373325[/C][/ROW]
[ROW][C]44[/C][C]-0.009311[/C][C]-0.0785[/C][C]0.468845[/C][/ROW]
[ROW][C]45[/C][C]-0.0388[/C][C]-0.3269[/C][C]0.372341[/C][/ROW]
[ROW][C]46[/C][C]0.008343[/C][C]0.0703[/C][C]0.472077[/C][/ROW]
[ROW][C]47[/C][C]-0.119404[/C][C]-1.0061[/C][C]0.158888[/C][/ROW]
[ROW][C]48[/C][C]0.243297[/C][C]2.0501[/C][C]0.022026[/C][/ROW]
[/TABLE]
Source: https://freestatistics.org/blog/index.php?pk=226035&T=1

Globally Unique Identifier (entire table): ba.freestatistics.org/blog/index.php?pk=226035&T=1

As an alternative you can also use a QR Code:  

The GUIDs for individual cells are displayed in the table below:

Autocorrelation Function
Time lag kACF(k)T-STATP-value
1-0.38776-3.26730.000837
20.0685730.57780.282612
3-0.113506-0.95640.171054
4-0.061327-0.51670.303469
5-0.282194-2.37780.010056
60.5178294.36332.1e-05
7-0.236764-1.9950.02494
8-0.013566-0.11430.454658
9-0.093629-0.78890.21639
100.018010.15180.439905
11-0.332298-2.80.003289
120.8047426.78090
13-0.32464-2.73550.003931
140.0998770.84160.201425
15-0.09948-0.83820.202356
16-0.062816-0.52930.299126
17-0.232459-1.95870.027036
180.4187643.52860.000369
19-0.183684-1.54770.063064
200.0137840.11610.453933
21-0.105111-0.88570.189389
220.0184850.15580.438333
23-0.26773-2.25590.013578
240.6182675.20961e-06
25-0.230464-1.94190.028057
260.0935640.78840.216548
27-0.082071-0.69150.24574
28-0.044543-0.37530.354268
29-0.203883-1.71790.045083
300.2966642.49970.007371
31-0.100873-0.850.199099
32-0.006637-0.05590.477778
33-0.073561-0.61980.268675
340.0259120.21830.413896
35-0.196043-1.65190.051487
360.4253313.58390.000308
37-0.133278-1.1230.132607
380.0614770.5180.30303
39-0.048932-0.41230.340679
40-0.052588-0.44310.329514
41-0.135986-1.14580.127854
420.1794691.51220.067456
43-0.03849-0.32430.373325
44-0.009311-0.07850.468845
45-0.0388-0.32690.372341
460.0083430.07030.472077
47-0.119404-1.00610.158888
480.2432972.05010.022026


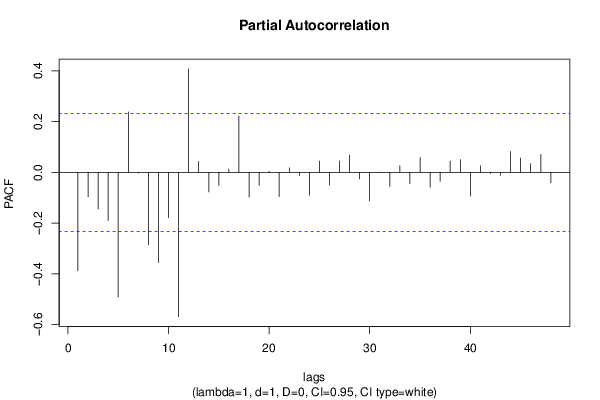
Partial Autocorrelation Function
Time lag kPACF(k)T-STATP-value
1-0.38776-3.26730.000837
2-0.096258-0.81110.210014
3-0.144554-1.2180.113622
4-0.189757-1.59890.05714
5-0.490937-4.13674.8e-05
60.2381042.00630.024317
7-0.002523-0.02130.491551
8-0.285831-2.40850.009309
9-0.355236-2.99330.001898
10-0.178593-1.50490.068399
11-0.568943-4.7944e-06
120.4077053.43540.000496
130.0428950.36140.359421
14-0.07693-0.64820.259465
15-0.051235-0.43170.333628
160.0128060.10790.457189
170.2219511.87020.03279
18-0.097705-0.82330.206554
19-0.051006-0.42980.334328
200.0042950.03620.485616
21-0.095677-0.80620.211412
220.017630.14860.441164
23-0.012757-0.10750.457352
24-0.090216-0.76020.224833
250.0443370.37360.354911
26-0.049874-0.42020.337787
270.0449870.37910.352886
280.0684190.57650.283048
29-0.0259-0.21820.413934
30-0.112441-0.94740.173313
310.0003790.00320.498731
32-0.055981-0.47170.319293
330.0262060.22080.412935
34-0.045009-0.37930.352816
350.0575370.48480.31465
36-0.058358-0.49170.312212
37-0.035365-0.2980.383291
380.0449610.37880.352965
390.0503380.42420.336368
40-0.093301-0.78620.217192
410.0255170.2150.415189
42-0.004226-0.03560.485846
43-0.011619-0.09790.461141
440.0822980.69350.245144
450.0569150.47960.316502
460.0342050.28820.387011
470.070350.59280.277606
48-0.040741-0.34330.366198

\begin{tabular}{lllllllll}
\hline
Partial Autocorrelation Function \tabularnewline
Time lag k & PACF(k) & T-STAT & P-value \tabularnewline
1 & -0.38776 & -3.2673 & 0.000837 \tabularnewline
2 & -0.096258 & -0.8111 & 0.210014 \tabularnewline
3 & -0.144554 & -1.218 & 0.113622 \tabularnewline
4 & -0.189757 & -1.5989 & 0.05714 \tabularnewline
5 & -0.490937 & -4.1367 & 4.8e-05 \tabularnewline
6 & 0.238104 & 2.0063 & 0.024317 \tabularnewline
7 & -0.002523 & -0.0213 & 0.491551 \tabularnewline
8 & -0.285831 & -2.4085 & 0.009309 \tabularnewline
9 & -0.355236 & -2.9933 & 0.001898 \tabularnewline
10 & -0.178593 & -1.5049 & 0.068399 \tabularnewline
11 & -0.568943 & -4.794 & 4e-06 \tabularnewline
12 & 0.407705 & 3.4354 & 0.000496 \tabularnewline
13 & 0.042895 & 0.3614 & 0.359421 \tabularnewline
14 & -0.07693 & -0.6482 & 0.259465 \tabularnewline
15 & -0.051235 & -0.4317 & 0.333628 \tabularnewline
16 & 0.012806 & 0.1079 & 0.457189 \tabularnewline
17 & 0.221951 & 1.8702 & 0.03279 \tabularnewline
18 & -0.097705 & -0.8233 & 0.206554 \tabularnewline
19 & -0.051006 & -0.4298 & 0.334328 \tabularnewline
20 & 0.004295 & 0.0362 & 0.485616 \tabularnewline
21 & -0.095677 & -0.8062 & 0.211412 \tabularnewline
22 & 0.01763 & 0.1486 & 0.441164 \tabularnewline
23 & -0.012757 & -0.1075 & 0.457352 \tabularnewline
24 & -0.090216 & -0.7602 & 0.224833 \tabularnewline
25 & 0.044337 & 0.3736 & 0.354911 \tabularnewline
26 & -0.049874 & -0.4202 & 0.337787 \tabularnewline
27 & 0.044987 & 0.3791 & 0.352886 \tabularnewline
28 & 0.068419 & 0.5765 & 0.283048 \tabularnewline
29 & -0.0259 & -0.2182 & 0.413934 \tabularnewline
30 & -0.112441 & -0.9474 & 0.173313 \tabularnewline
31 & 0.000379 & 0.0032 & 0.498731 \tabularnewline
32 & -0.055981 & -0.4717 & 0.319293 \tabularnewline
33 & 0.026206 & 0.2208 & 0.412935 \tabularnewline
34 & -0.045009 & -0.3793 & 0.352816 \tabularnewline
35 & 0.057537 & 0.4848 & 0.31465 \tabularnewline
36 & -0.058358 & -0.4917 & 0.312212 \tabularnewline
37 & -0.035365 & -0.298 & 0.383291 \tabularnewline
38 & 0.044961 & 0.3788 & 0.352965 \tabularnewline
39 & 0.050338 & 0.4242 & 0.336368 \tabularnewline
40 & -0.093301 & -0.7862 & 0.217192 \tabularnewline
41 & 0.025517 & 0.215 & 0.415189 \tabularnewline
42 & -0.004226 & -0.0356 & 0.485846 \tabularnewline
43 & -0.011619 & -0.0979 & 0.461141 \tabularnewline
44 & 0.082298 & 0.6935 & 0.245144 \tabularnewline
45 & 0.056915 & 0.4796 & 0.316502 \tabularnewline
46 & 0.034205 & 0.2882 & 0.387011 \tabularnewline
47 & 0.07035 & 0.5928 & 0.277606 \tabularnewline
48 & -0.040741 & -0.3433 & 0.366198 \tabularnewline
\hline
\end{tabular}
%Source: https://freestatistics.org/blog/index.php?pk=226035&T=2

[TABLE]
[ROW][C]Partial Autocorrelation Function[/C][/ROW]
[ROW][C]Time lag k[/C][C]PACF(k)[/C][C]T-STAT[/C][C]P-value[/C][/ROW]
[ROW][C]1[/C][C]-0.38776[/C][C]-3.2673[/C][C]0.000837[/C][/ROW]
[ROW][C]2[/C][C]-0.096258[/C][C]-0.8111[/C][C]0.210014[/C][/ROW]
[ROW][C]3[/C][C]-0.144554[/C][C]-1.218[/C][C]0.113622[/C][/ROW]
[ROW][C]4[/C][C]-0.189757[/C][C]-1.5989[/C][C]0.05714[/C][/ROW]
[ROW][C]5[/C][C]-0.490937[/C][C]-4.1367[/C][C]4.8e-05[/C][/ROW]
[ROW][C]6[/C][C]0.238104[/C][C]2.0063[/C][C]0.024317[/C][/ROW]
[ROW][C]7[/C][C]-0.002523[/C][C]-0.0213[/C][C]0.491551[/C][/ROW]
[ROW][C]8[/C][C]-0.285831[/C][C]-2.4085[/C][C]0.009309[/C][/ROW]
[ROW][C]9[/C][C]-0.355236[/C][C]-2.9933[/C][C]0.001898[/C][/ROW]
[ROW][C]10[/C][C]-0.178593[/C][C]-1.5049[/C][C]0.068399[/C][/ROW]
[ROW][C]11[/C][C]-0.568943[/C][C]-4.794[/C][C]4e-06[/C][/ROW]
[ROW][C]12[/C][C]0.407705[/C][C]3.4354[/C][C]0.000496[/C][/ROW]
[ROW][C]13[/C][C]0.042895[/C][C]0.3614[/C][C]0.359421[/C][/ROW]
[ROW][C]14[/C][C]-0.07693[/C][C]-0.6482[/C][C]0.259465[/C][/ROW]
[ROW][C]15[/C][C]-0.051235[/C][C]-0.4317[/C][C]0.333628[/C][/ROW]
[ROW][C]16[/C][C]0.012806[/C][C]0.1079[/C][C]0.457189[/C][/ROW]
[ROW][C]17[/C][C]0.221951[/C][C]1.8702[/C][C]0.03279[/C][/ROW]
[ROW][C]18[/C][C]-0.097705[/C][C]-0.8233[/C][C]0.206554[/C][/ROW]
[ROW][C]19[/C][C]-0.051006[/C][C]-0.4298[/C][C]0.334328[/C][/ROW]
[ROW][C]20[/C][C]0.004295[/C][C]0.0362[/C][C]0.485616[/C][/ROW]
[ROW][C]21[/C][C]-0.095677[/C][C]-0.8062[/C][C]0.211412[/C][/ROW]
[ROW][C]22[/C][C]0.01763[/C][C]0.1486[/C][C]0.441164[/C][/ROW]
[ROW][C]23[/C][C]-0.012757[/C][C]-0.1075[/C][C]0.457352[/C][/ROW]
[ROW][C]24[/C][C]-0.090216[/C][C]-0.7602[/C][C]0.224833[/C][/ROW]
[ROW][C]25[/C][C]0.044337[/C][C]0.3736[/C][C]0.354911[/C][/ROW]
[ROW][C]26[/C][C]-0.049874[/C][C]-0.4202[/C][C]0.337787[/C][/ROW]
[ROW][C]27[/C][C]0.044987[/C][C]0.3791[/C][C]0.352886[/C][/ROW]
[ROW][C]28[/C][C]0.068419[/C][C]0.5765[/C][C]0.283048[/C][/ROW]
[ROW][C]29[/C][C]-0.0259[/C][C]-0.2182[/C][C]0.413934[/C][/ROW]
[ROW][C]30[/C][C]-0.112441[/C][C]-0.9474[/C][C]0.173313[/C][/ROW]
[ROW][C]31[/C][C]0.000379[/C][C]0.0032[/C][C]0.498731[/C][/ROW]
[ROW][C]32[/C][C]-0.055981[/C][C]-0.4717[/C][C]0.319293[/C][/ROW]
[ROW][C]33[/C][C]0.026206[/C][C]0.2208[/C][C]0.412935[/C][/ROW]
[ROW][C]34[/C][C]-0.045009[/C][C]-0.3793[/C][C]0.352816[/C][/ROW]
[ROW][C]35[/C][C]0.057537[/C][C]0.4848[/C][C]0.31465[/C][/ROW]
[ROW][C]36[/C][C]-0.058358[/C][C]-0.4917[/C][C]0.312212[/C][/ROW]
[ROW][C]37[/C][C]-0.035365[/C][C]-0.298[/C][C]0.383291[/C][/ROW]
[ROW][C]38[/C][C]0.044961[/C][C]0.3788[/C][C]0.352965[/C][/ROW]
[ROW][C]39[/C][C]0.050338[/C][C]0.4242[/C][C]0.336368[/C][/ROW]
[ROW][C]40[/C][C]-0.093301[/C][C]-0.7862[/C][C]0.217192[/C][/ROW]
[ROW][C]41[/C][C]0.025517[/C][C]0.215[/C][C]0.415189[/C][/ROW]
[ROW][C]42[/C][C]-0.004226[/C][C]-0.0356[/C][C]0.485846[/C][/ROW]
[ROW][C]43[/C][C]-0.011619[/C][C]-0.0979[/C][C]0.461141[/C][/ROW]
[ROW][C]44[/C][C]0.082298[/C][C]0.6935[/C][C]0.245144[/C][/ROW]
[ROW][C]45[/C][C]0.056915[/C][C]0.4796[/C][C]0.316502[/C][/ROW]
[ROW][C]46[/C][C]0.034205[/C][C]0.2882[/C][C]0.387011[/C][/ROW]
[ROW][C]47[/C][C]0.07035[/C][C]0.5928[/C][C]0.277606[/C][/ROW]
[ROW][C]48[/C][C]-0.040741[/C][C]-0.3433[/C][C]0.366198[/C][/ROW]
[/TABLE]
Source: https://freestatistics.org/blog/index.php?pk=226035&T=2

Globally Unique Identifier (entire table): ba.freestatistics.org/blog/index.php?pk=226035&T=2

As an alternative you can also use a QR Code:  

The GUIDs for individual cells are displayed in the table below:

Partial Autocorrelation Function
Time lag kPACF(k)T-STATP-value
1-0.38776-3.26730.000837
2-0.096258-0.81110.210014
3-0.144554-1.2180.113622
4-0.189757-1.59890.05714
5-0.490937-4.13674.8e-05
60.2381042.00630.024317
7-0.002523-0.02130.491551
8-0.285831-2.40850.009309
9-0.355236-2.99330.001898
10-0.178593-1.50490.068399
11-0.568943-4.7944e-06
120.4077053.43540.000496
130.0428950.36140.359421
14-0.07693-0.64820.259465
15-0.051235-0.43170.333628
160.0128060.10790.457189
170.2219511.87020.03279
18-0.097705-0.82330.206554
19-0.051006-0.42980.334328
200.0042950.03620.485616
21-0.095677-0.80620.211412
220.017630.14860.441164
23-0.012757-0.10750.457352
24-0.090216-0.76020.224833
250.0443370.37360.354911
26-0.049874-0.42020.337787
270.0449870.37910.352886
280.0684190.57650.283048
29-0.0259-0.21820.413934
30-0.112441-0.94740.173313
310.0003790.00320.498731
32-0.055981-0.47170.319293
330.0262060.22080.412935
34-0.045009-0.37930.352816
350.0575370.48480.31465
36-0.058358-0.49170.312212
37-0.035365-0.2980.383291
380.0449610.37880.352965
390.0503380.42420.336368
40-0.093301-0.78620.217192
410.0255170.2150.415189
42-0.004226-0.03560.485846
43-0.011619-0.09790.461141
440.0822980.69350.245144
450.0569150.47960.316502
460.0342050.28820.387011
470.070350.59280.277606
48-0.040741-0.34330.366198


Parameters (Session):
par1 = 48 ; par2 = 1 ; par3 = 1 ; par4 = 0 ; par5 = 12 ; par6 = White Noise ; par7 = 0.95 ;
Parameters (R input):
par1 = 48 ; par2 = 1 ; par3 = 1 ; par4 = 0 ; par5 = 12 ; par6 = White Noise ; par7 = 0.95 ; par8 = ;
R code (references can be found in the software module):
if (par1 == 'Default') {
par1 = 10*log10(length(x))
} else {
par1 <- as.numeric(par1)
}
par2 <- as.numeric(par2)
par3 <- as.numeric(par3)
par4 <- as.numeric(par4)
par5 <- as.numeric(par5)
if (par6 == 'White Noise') par6 <- 'white' else par6 <- 'ma'
par7 <- as.numeric(par7)
if (par8 != '') par8 <- as.numeric(par8)
ox <- x
if (par8 == '') {
if (par2 == 0) {
x <- log(x)
} else {
x <- (x ^ par2 - 1) / par2
}
} else {
x <- log(x,base=par8)
}
if (par3 > 0) x <- diff(x,lag=1,difference=par3)
if (par4 > 0) x <- diff(x,lag=par5,difference=par4)
bitmap(file='picts.png')
op <- par(mfrow=c(2,1))
plot(ox,type='l',main='Original Time Series',xlab='time',ylab='value')
if (par8=='') {
mytitle <- paste('Working Time Series (lambda=',par2,', d=',par3,', D=',par4,')',sep='')
mysub <- paste('(lambda=',par2,', d=',par3,', D=',par4,', CI=', par7, ', CI type=',par6,')',sep='')
} else {
mytitle <- paste('Working Time Series (base=',par8,', d=',par3,', D=',par4,')',sep='')
mysub <- paste('(base=',par8,', d=',par3,', D=',par4,', CI=', par7, ', CI type=',par6,')',sep='')
}
plot(x,type='l', main=mytitle,xlab='time',ylab='value')
par(op)
dev.off()
bitmap(file='pic1.png')
racf <- acf(x, par1, main='Autocorrelation', xlab='time lag', ylab='ACF', ci.type=par6, ci=par7, sub=mysub)
dev.off()
bitmap(file='pic2.png')
rpacf <- pacf(x,par1,main='Partial Autocorrelation',xlab='lags',ylab='PACF',sub=mysub)
dev.off()
(myacf <- c(racf$acf))
(mypacf <- c(rpacf$acf))
lengthx <- length(x)
sqrtn <- sqrt(lengthx)
load(file='createtable')
a<-table.start()
a<-table.row.start(a)
a<-table.element(a,'Autocorrelation Function',4,TRUE)
a<-table.row.end(a)
a<-table.row.start(a)
a<-table.element(a,'Time lag k',header=TRUE)
a<-table.element(a,hyperlink('basics.htm','ACF(k)','click here for more information about the Autocorrelation Function'),header=TRUE)
a<-table.element(a,'T-STAT',header=TRUE)
a<-table.element(a,'P-value',header=TRUE)
a<-table.row.end(a)
for (i in 2:(par1+1)) {
a<-table.row.start(a)
a<-table.element(a,i-1,header=TRUE)
a<-table.element(a,round(myacf[i],6))
mytstat <- myacf[i]*sqrtn
a<-table.element(a,round(mytstat,4))
a<-table.element(a,round(1-pt(abs(mytstat),lengthx),6))
a<-table.row.end(a)
}
a<-table.end(a)
table.save(a,file='mytable.tab')
a<-table.start()
a<-table.row.start(a)
a<-table.element(a,'Partial Autocorrelation Function',4,TRUE)
a<-table.row.end(a)
a<-table.row.start(a)
a<-table.element(a,'Time lag k',header=TRUE)
a<-table.element(a,hyperlink('basics.htm','PACF(k)','click here for more information about the Partial Autocorrelation Function'),header=TRUE)
a<-table.element(a,'T-STAT',header=TRUE)
a<-table.element(a,'P-value',header=TRUE)
a<-table.row.end(a)
for (i in 1:par1) {
a<-table.row.start(a)
a<-table.element(a,i,header=TRUE)
a<-table.element(a,round(mypacf[i],6))
mytstat <- mypacf[i]*sqrtn
a<-table.element(a,round(mytstat,4))
a<-table.element(a,round(1-pt(abs(mytstat),lengthx),6))
a<-table.row.end(a)
}
a<-table.end(a)
table.save(a,file='mytable1.tab')