Free Statistics

of Irreproducible Research!

Author's title

Author*Unverified author*
R Software Modulerwasp_autocorrelation.wasp
Title produced by software(Partial) Autocorrelation Function
Date of computationMon, 18 Nov 2013 06:30:21 -0500
Cite this page as followsStatistical Computations at FreeStatistics.org, Office for Research Development and Education, URL https://freestatistics.org/blog/index.php?v=date/2013/Nov/18/t1384774230zguny7adm9zs7oq.htm/, Retrieved Sat, 27 Apr 2024 09:45:00 +0000
Statistical Computations at FreeStatistics.org, Office for Research Development and Education, URL https://freestatistics.org/blog/index.php?pk=226037, Retrieved Sat, 27 Apr 2024 09:45:00 +0000
QR Codes:

Original text written by user:
IsPrivate?No (this computation is public)
User-defined keywords
Estimated Impact60
Family? (F = Feedback message, R = changed R code, M = changed R Module, P = changed Parameters, D = changed Data)
-       [(Partial) Autocorrelation Function] [] [2013-11-18 11:30:21] [764249a9cc4864d99a8b0ce95556daaa] [Current]
Feedback Forum

Post a new message
Dataseries X:
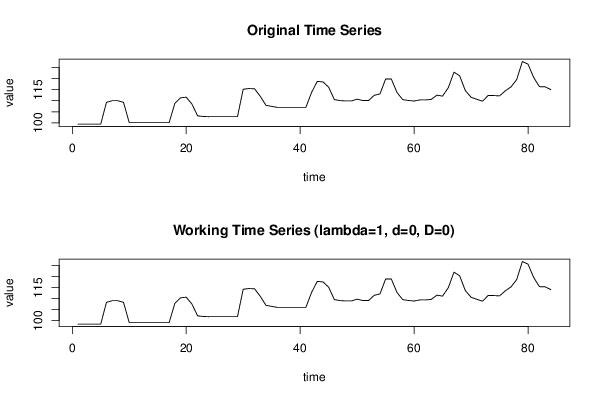
99.42
99.42
99.42
99.42
99.42
109.26
110
110
109.26
100.07
100.07
100.05
100.05
100.05
100.05
100.05
100.05
108.77
111.32
111.6
108.52
103.13
102.87
102.75
102.75
102.75
102.75
102.75
102.75
115.22
115.53
115.4
111.99
107.93
107.43
106.98
106.98
106.98
106.98
106.98
106.98
113.71
118.77
118.54
116.16
110.52
110.06
109.9
109.9
110.72
110.09
110.07
112.45
113.06
119.83
119.84
113.73
110.5
110.12
109.86
110.36
110.36
110.59
112.52
112.1
115.9
122.96
121.26
114.55
111.57
110.65
109.77
112.38
112.35
112.2
114.46
116.26
119.57
127.77
126.59
120.45
116.38
116.3
115.05


Summary of computational transaction
Raw Inputview raw input (R code)
Raw Outputview raw output of R engine
Computing time4 seconds
R Server'Gwilym Jenkins' @ jenkins.wessa.net

\begin{tabular}{lllllllll}
\hline
Summary of computational transaction \tabularnewline
Raw Input & view raw input (R code)  \tabularnewline
Raw Output & view raw output of R engine  \tabularnewline
Computing time & 4 seconds \tabularnewline
R Server & 'Gwilym Jenkins' @ jenkins.wessa.net \tabularnewline
\hline
\end{tabular}
%Source: https://freestatistics.org/blog/index.php?pk=226037&T=0

[TABLE]
[ROW][C]Summary of computational transaction[/C][/ROW]
[ROW][C]Raw Input[/C][C]view raw input (R code) [/C][/ROW]
[ROW][C]Raw Output[/C][C]view raw output of R engine [/C][/ROW]
[ROW][C]Computing time[/C][C]4 seconds[/C][/ROW]
[ROW][C]R Server[/C][C]'Gwilym Jenkins' @ jenkins.wessa.net[/C][/ROW]
[/TABLE]
Source: https://freestatistics.org/blog/index.php?pk=226037&T=0

Globally Unique Identifier (entire table): ba.freestatistics.org/blog/index.php?pk=226037&T=0

As an alternative you can also use a QR Code:  

The GUIDs for individual cells are displayed in the table below:

Summary of computational transaction
Raw Inputview raw input (R code)
Raw Outputview raw output of R engine
Computing time4 seconds
R Server'Gwilym Jenkins' @ jenkins.wessa.net


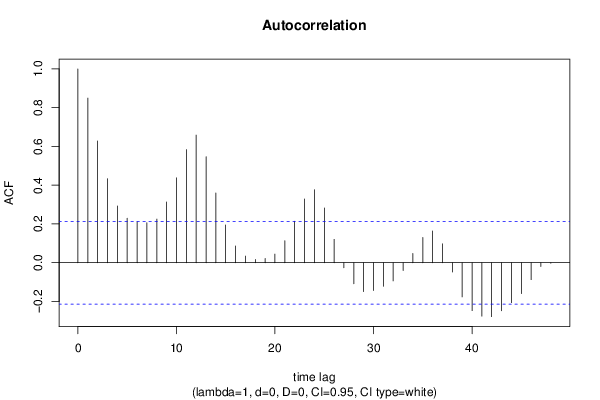
Autocorrelation Function
Time lag kACF(k)T-STATP-value
10.8494757.78560
20.6280675.75630
30.4333713.97197.5e-05
40.2925642.68140.004412
50.2292572.10120.019311
60.2106141.93030.028472
70.2066031.89350.030864
80.2247562.05990.021251
90.312952.86820.002609
100.4379144.01356.5e-05
110.5834825.34770
120.658516.03530
130.5471115.01441e-06
140.3597553.29720.000716
150.1949631.78690.038783
160.0864760.79260.215131
170.0340190.31180.377986
180.0166210.15230.439644
190.021290.19510.422884
200.0442760.40580.342963
210.113551.04070.150499
220.2141211.96240.02651
230.3289083.01450.001702
240.3764183.44990.00044
250.2827032.5910.005641
260.1202251.10190.136831
27-0.02588-0.23720.406543
28-0.10892-0.99830.160507
29-0.149257-1.3680.087485
30-0.143802-1.3180.095549
31-0.122121-1.11930.133109
32-0.093998-0.86150.195706
33-0.040623-0.37230.355296
340.0472190.43280.333147
350.1301281.19260.118183
360.1637951.50120.068526
370.0972580.89140.187634
38-0.048111-0.44090.330193
39-0.176652-1.6190.054594
40-0.24749-2.26830.012939
41-0.275864-2.52830.006666
42-0.278567-2.55310.006242
43-0.248201-2.27480.012733
44-0.206379-1.89150.031002
45-0.159601-1.46280.073631
46-0.087419-0.80120.212636
47-0.020043-0.18370.427345
48-0.002887-0.02650.489478

\begin{tabular}{lllllllll}
\hline
Autocorrelation Function \tabularnewline
Time lag k & ACF(k) & T-STAT & P-value \tabularnewline
1 & 0.849475 & 7.7856 & 0 \tabularnewline
2 & 0.628067 & 5.7563 & 0 \tabularnewline
3 & 0.433371 & 3.9719 & 7.5e-05 \tabularnewline
4 & 0.292564 & 2.6814 & 0.004412 \tabularnewline
5 & 0.229257 & 2.1012 & 0.019311 \tabularnewline
6 & 0.210614 & 1.9303 & 0.028472 \tabularnewline
7 & 0.206603 & 1.8935 & 0.030864 \tabularnewline
8 & 0.224756 & 2.0599 & 0.021251 \tabularnewline
9 & 0.31295 & 2.8682 & 0.002609 \tabularnewline
10 & 0.437914 & 4.0135 & 6.5e-05 \tabularnewline
11 & 0.583482 & 5.3477 & 0 \tabularnewline
12 & 0.65851 & 6.0353 & 0 \tabularnewline
13 & 0.547111 & 5.0144 & 1e-06 \tabularnewline
14 & 0.359755 & 3.2972 & 0.000716 \tabularnewline
15 & 0.194963 & 1.7869 & 0.038783 \tabularnewline
16 & 0.086476 & 0.7926 & 0.215131 \tabularnewline
17 & 0.034019 & 0.3118 & 0.377986 \tabularnewline
18 & 0.016621 & 0.1523 & 0.439644 \tabularnewline
19 & 0.02129 & 0.1951 & 0.422884 \tabularnewline
20 & 0.044276 & 0.4058 & 0.342963 \tabularnewline
21 & 0.11355 & 1.0407 & 0.150499 \tabularnewline
22 & 0.214121 & 1.9624 & 0.02651 \tabularnewline
23 & 0.328908 & 3.0145 & 0.001702 \tabularnewline
24 & 0.376418 & 3.4499 & 0.00044 \tabularnewline
25 & 0.282703 & 2.591 & 0.005641 \tabularnewline
26 & 0.120225 & 1.1019 & 0.136831 \tabularnewline
27 & -0.02588 & -0.2372 & 0.406543 \tabularnewline
28 & -0.10892 & -0.9983 & 0.160507 \tabularnewline
29 & -0.149257 & -1.368 & 0.087485 \tabularnewline
30 & -0.143802 & -1.318 & 0.095549 \tabularnewline
31 & -0.122121 & -1.1193 & 0.133109 \tabularnewline
32 & -0.093998 & -0.8615 & 0.195706 \tabularnewline
33 & -0.040623 & -0.3723 & 0.355296 \tabularnewline
34 & 0.047219 & 0.4328 & 0.333147 \tabularnewline
35 & 0.130128 & 1.1926 & 0.118183 \tabularnewline
36 & 0.163795 & 1.5012 & 0.068526 \tabularnewline
37 & 0.097258 & 0.8914 & 0.187634 \tabularnewline
38 & -0.048111 & -0.4409 & 0.330193 \tabularnewline
39 & -0.176652 & -1.619 & 0.054594 \tabularnewline
40 & -0.24749 & -2.2683 & 0.012939 \tabularnewline
41 & -0.275864 & -2.5283 & 0.006666 \tabularnewline
42 & -0.278567 & -2.5531 & 0.006242 \tabularnewline
43 & -0.248201 & -2.2748 & 0.012733 \tabularnewline
44 & -0.206379 & -1.8915 & 0.031002 \tabularnewline
45 & -0.159601 & -1.4628 & 0.073631 \tabularnewline
46 & -0.087419 & -0.8012 & 0.212636 \tabularnewline
47 & -0.020043 & -0.1837 & 0.427345 \tabularnewline
48 & -0.002887 & -0.0265 & 0.489478 \tabularnewline
\hline
\end{tabular}
%Source: https://freestatistics.org/blog/index.php?pk=226037&T=1

[TABLE]
[ROW][C]Autocorrelation Function[/C][/ROW]
[ROW][C]Time lag k[/C][C]ACF(k)[/C][C]T-STAT[/C][C]P-value[/C][/ROW]
[ROW][C]1[/C][C]0.849475[/C][C]7.7856[/C][C]0[/C][/ROW]
[ROW][C]2[/C][C]0.628067[/C][C]5.7563[/C][C]0[/C][/ROW]
[ROW][C]3[/C][C]0.433371[/C][C]3.9719[/C][C]7.5e-05[/C][/ROW]
[ROW][C]4[/C][C]0.292564[/C][C]2.6814[/C][C]0.004412[/C][/ROW]
[ROW][C]5[/C][C]0.229257[/C][C]2.1012[/C][C]0.019311[/C][/ROW]
[ROW][C]6[/C][C]0.210614[/C][C]1.9303[/C][C]0.028472[/C][/ROW]
[ROW][C]7[/C][C]0.206603[/C][C]1.8935[/C][C]0.030864[/C][/ROW]
[ROW][C]8[/C][C]0.224756[/C][C]2.0599[/C][C]0.021251[/C][/ROW]
[ROW][C]9[/C][C]0.31295[/C][C]2.8682[/C][C]0.002609[/C][/ROW]
[ROW][C]10[/C][C]0.437914[/C][C]4.0135[/C][C]6.5e-05[/C][/ROW]
[ROW][C]11[/C][C]0.583482[/C][C]5.3477[/C][C]0[/C][/ROW]
[ROW][C]12[/C][C]0.65851[/C][C]6.0353[/C][C]0[/C][/ROW]
[ROW][C]13[/C][C]0.547111[/C][C]5.0144[/C][C]1e-06[/C][/ROW]
[ROW][C]14[/C][C]0.359755[/C][C]3.2972[/C][C]0.000716[/C][/ROW]
[ROW][C]15[/C][C]0.194963[/C][C]1.7869[/C][C]0.038783[/C][/ROW]
[ROW][C]16[/C][C]0.086476[/C][C]0.7926[/C][C]0.215131[/C][/ROW]
[ROW][C]17[/C][C]0.034019[/C][C]0.3118[/C][C]0.377986[/C][/ROW]
[ROW][C]18[/C][C]0.016621[/C][C]0.1523[/C][C]0.439644[/C][/ROW]
[ROW][C]19[/C][C]0.02129[/C][C]0.1951[/C][C]0.422884[/C][/ROW]
[ROW][C]20[/C][C]0.044276[/C][C]0.4058[/C][C]0.342963[/C][/ROW]
[ROW][C]21[/C][C]0.11355[/C][C]1.0407[/C][C]0.150499[/C][/ROW]
[ROW][C]22[/C][C]0.214121[/C][C]1.9624[/C][C]0.02651[/C][/ROW]
[ROW][C]23[/C][C]0.328908[/C][C]3.0145[/C][C]0.001702[/C][/ROW]
[ROW][C]24[/C][C]0.376418[/C][C]3.4499[/C][C]0.00044[/C][/ROW]
[ROW][C]25[/C][C]0.282703[/C][C]2.591[/C][C]0.005641[/C][/ROW]
[ROW][C]26[/C][C]0.120225[/C][C]1.1019[/C][C]0.136831[/C][/ROW]
[ROW][C]27[/C][C]-0.02588[/C][C]-0.2372[/C][C]0.406543[/C][/ROW]
[ROW][C]28[/C][C]-0.10892[/C][C]-0.9983[/C][C]0.160507[/C][/ROW]
[ROW][C]29[/C][C]-0.149257[/C][C]-1.368[/C][C]0.087485[/C][/ROW]
[ROW][C]30[/C][C]-0.143802[/C][C]-1.318[/C][C]0.095549[/C][/ROW]
[ROW][C]31[/C][C]-0.122121[/C][C]-1.1193[/C][C]0.133109[/C][/ROW]
[ROW][C]32[/C][C]-0.093998[/C][C]-0.8615[/C][C]0.195706[/C][/ROW]
[ROW][C]33[/C][C]-0.040623[/C][C]-0.3723[/C][C]0.355296[/C][/ROW]
[ROW][C]34[/C][C]0.047219[/C][C]0.4328[/C][C]0.333147[/C][/ROW]
[ROW][C]35[/C][C]0.130128[/C][C]1.1926[/C][C]0.118183[/C][/ROW]
[ROW][C]36[/C][C]0.163795[/C][C]1.5012[/C][C]0.068526[/C][/ROW]
[ROW][C]37[/C][C]0.097258[/C][C]0.8914[/C][C]0.187634[/C][/ROW]
[ROW][C]38[/C][C]-0.048111[/C][C]-0.4409[/C][C]0.330193[/C][/ROW]
[ROW][C]39[/C][C]-0.176652[/C][C]-1.619[/C][C]0.054594[/C][/ROW]
[ROW][C]40[/C][C]-0.24749[/C][C]-2.2683[/C][C]0.012939[/C][/ROW]
[ROW][C]41[/C][C]-0.275864[/C][C]-2.5283[/C][C]0.006666[/C][/ROW]
[ROW][C]42[/C][C]-0.278567[/C][C]-2.5531[/C][C]0.006242[/C][/ROW]
[ROW][C]43[/C][C]-0.248201[/C][C]-2.2748[/C][C]0.012733[/C][/ROW]
[ROW][C]44[/C][C]-0.206379[/C][C]-1.8915[/C][C]0.031002[/C][/ROW]
[ROW][C]45[/C][C]-0.159601[/C][C]-1.4628[/C][C]0.073631[/C][/ROW]
[ROW][C]46[/C][C]-0.087419[/C][C]-0.8012[/C][C]0.212636[/C][/ROW]
[ROW][C]47[/C][C]-0.020043[/C][C]-0.1837[/C][C]0.427345[/C][/ROW]
[ROW][C]48[/C][C]-0.002887[/C][C]-0.0265[/C][C]0.489478[/C][/ROW]
[/TABLE]
Source: https://freestatistics.org/blog/index.php?pk=226037&T=1

Globally Unique Identifier (entire table): ba.freestatistics.org/blog/index.php?pk=226037&T=1

As an alternative you can also use a QR Code:  

The GUIDs for individual cells are displayed in the table below:

Autocorrelation Function
Time lag kACF(k)T-STATP-value
10.8494757.78560
20.6280675.75630
30.4333713.97197.5e-05
40.2925642.68140.004412
50.2292572.10120.019311
60.2106141.93030.028472
70.2066031.89350.030864
80.2247562.05990.021251
90.312952.86820.002609
100.4379144.01356.5e-05
110.5834825.34770
120.658516.03530
130.5471115.01441e-06
140.3597553.29720.000716
150.1949631.78690.038783
160.0864760.79260.215131
170.0340190.31180.377986
180.0166210.15230.439644
190.021290.19510.422884
200.0442760.40580.342963
210.113551.04070.150499
220.2141211.96240.02651
230.3289083.01450.001702
240.3764183.44990.00044
250.2827032.5910.005641
260.1202251.10190.136831
27-0.02588-0.23720.406543
28-0.10892-0.99830.160507
29-0.149257-1.3680.087485
30-0.143802-1.3180.095549
31-0.122121-1.11930.133109
32-0.093998-0.86150.195706
33-0.040623-0.37230.355296
340.0472190.43280.333147
350.1301281.19260.118183
360.1637951.50120.068526
370.0972580.89140.187634
38-0.048111-0.44090.330193
39-0.176652-1.6190.054594
40-0.24749-2.26830.012939
41-0.275864-2.52830.006666
42-0.278567-2.55310.006242
43-0.248201-2.27480.012733
44-0.206379-1.89150.031002
45-0.159601-1.46280.073631
46-0.087419-0.80120.212636
47-0.020043-0.18370.427345
48-0.002887-0.02650.489478


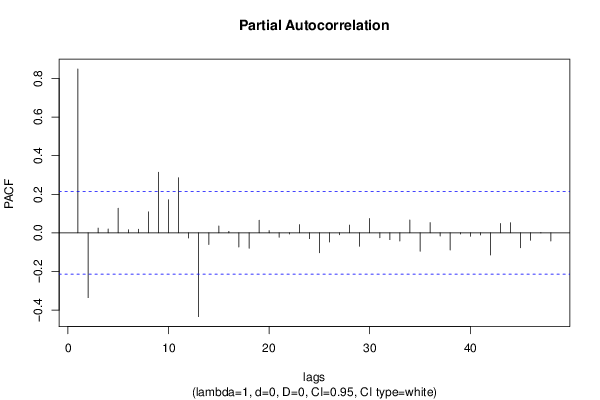
Partial Autocorrelation Function
Time lag kPACF(k)T-STATP-value
10.8494757.78560
2-0.336004-3.07950.001401
30.0243080.22280.412121
40.019860.1820.428002
50.127831.17160.122339
60.0156750.14370.443054
70.0186210.17070.43245
80.1085170.99460.161399
90.3138092.87610.002551
100.1715621.57240.05981
110.2854472.61620.005271
12-0.026796-0.24560.403298
13-0.434489-3.98227.2e-05
14-0.060668-0.5560.289833
150.0356950.32710.372185
160.0075120.06890.472636
17-0.073188-0.67080.252101
18-0.079666-0.73010.233665
190.0649050.59490.276767
200.0114490.10490.458341
21-0.022757-0.20860.417644
22-0.006511-0.05970.476278
230.0425890.39030.348638
24-0.030072-0.27560.391761
25-0.103302-0.94680.173233
26-0.04739-0.43430.332579
27-0.009577-0.08780.465131
280.0400460.3670.357261
29-0.069527-0.63720.262855
300.0743080.6810.248859
31-0.025904-0.23740.406457
32-0.035356-0.3240.373355
33-0.042282-0.38750.349674
340.0665530.610.271765
35-0.095862-0.87860.191064
360.0529710.48550.314297
37-0.016536-0.15160.439952
38-0.088842-0.81430.208901
39-0.006287-0.05760.477095
40-0.01767-0.1620.435866
41-0.011469-0.10510.458266
42-0.115305-1.05680.146819
430.0486090.44550.328551
440.052330.47960.316374
45-0.076955-0.70530.241286
46-0.038345-0.35140.363068
470.0007320.00670.49733
48-0.04213-0.38610.350191

\begin{tabular}{lllllllll}
\hline
Partial Autocorrelation Function \tabularnewline
Time lag k & PACF(k) & T-STAT & P-value \tabularnewline
1 & 0.849475 & 7.7856 & 0 \tabularnewline
2 & -0.336004 & -3.0795 & 0.001401 \tabularnewline
3 & 0.024308 & 0.2228 & 0.412121 \tabularnewline
4 & 0.01986 & 0.182 & 0.428002 \tabularnewline
5 & 0.12783 & 1.1716 & 0.122339 \tabularnewline
6 & 0.015675 & 0.1437 & 0.443054 \tabularnewline
7 & 0.018621 & 0.1707 & 0.43245 \tabularnewline
8 & 0.108517 & 0.9946 & 0.161399 \tabularnewline
9 & 0.313809 & 2.8761 & 0.002551 \tabularnewline
10 & 0.171562 & 1.5724 & 0.05981 \tabularnewline
11 & 0.285447 & 2.6162 & 0.005271 \tabularnewline
12 & -0.026796 & -0.2456 & 0.403298 \tabularnewline
13 & -0.434489 & -3.9822 & 7.2e-05 \tabularnewline
14 & -0.060668 & -0.556 & 0.289833 \tabularnewline
15 & 0.035695 & 0.3271 & 0.372185 \tabularnewline
16 & 0.007512 & 0.0689 & 0.472636 \tabularnewline
17 & -0.073188 & -0.6708 & 0.252101 \tabularnewline
18 & -0.079666 & -0.7301 & 0.233665 \tabularnewline
19 & 0.064905 & 0.5949 & 0.276767 \tabularnewline
20 & 0.011449 & 0.1049 & 0.458341 \tabularnewline
21 & -0.022757 & -0.2086 & 0.417644 \tabularnewline
22 & -0.006511 & -0.0597 & 0.476278 \tabularnewline
23 & 0.042589 & 0.3903 & 0.348638 \tabularnewline
24 & -0.030072 & -0.2756 & 0.391761 \tabularnewline
25 & -0.103302 & -0.9468 & 0.173233 \tabularnewline
26 & -0.04739 & -0.4343 & 0.332579 \tabularnewline
27 & -0.009577 & -0.0878 & 0.465131 \tabularnewline
28 & 0.040046 & 0.367 & 0.357261 \tabularnewline
29 & -0.069527 & -0.6372 & 0.262855 \tabularnewline
30 & 0.074308 & 0.681 & 0.248859 \tabularnewline
31 & -0.025904 & -0.2374 & 0.406457 \tabularnewline
32 & -0.035356 & -0.324 & 0.373355 \tabularnewline
33 & -0.042282 & -0.3875 & 0.349674 \tabularnewline
34 & 0.066553 & 0.61 & 0.271765 \tabularnewline
35 & -0.095862 & -0.8786 & 0.191064 \tabularnewline
36 & 0.052971 & 0.4855 & 0.314297 \tabularnewline
37 & -0.016536 & -0.1516 & 0.439952 \tabularnewline
38 & -0.088842 & -0.8143 & 0.208901 \tabularnewline
39 & -0.006287 & -0.0576 & 0.477095 \tabularnewline
40 & -0.01767 & -0.162 & 0.435866 \tabularnewline
41 & -0.011469 & -0.1051 & 0.458266 \tabularnewline
42 & -0.115305 & -1.0568 & 0.146819 \tabularnewline
43 & 0.048609 & 0.4455 & 0.328551 \tabularnewline
44 & 0.05233 & 0.4796 & 0.316374 \tabularnewline
45 & -0.076955 & -0.7053 & 0.241286 \tabularnewline
46 & -0.038345 & -0.3514 & 0.363068 \tabularnewline
47 & 0.000732 & 0.0067 & 0.49733 \tabularnewline
48 & -0.04213 & -0.3861 & 0.350191 \tabularnewline
\hline
\end{tabular}
%Source: https://freestatistics.org/blog/index.php?pk=226037&T=2

[TABLE]
[ROW][C]Partial Autocorrelation Function[/C][/ROW]
[ROW][C]Time lag k[/C][C]PACF(k)[/C][C]T-STAT[/C][C]P-value[/C][/ROW]
[ROW][C]1[/C][C]0.849475[/C][C]7.7856[/C][C]0[/C][/ROW]
[ROW][C]2[/C][C]-0.336004[/C][C]-3.0795[/C][C]0.001401[/C][/ROW]
[ROW][C]3[/C][C]0.024308[/C][C]0.2228[/C][C]0.412121[/C][/ROW]
[ROW][C]4[/C][C]0.01986[/C][C]0.182[/C][C]0.428002[/C][/ROW]
[ROW][C]5[/C][C]0.12783[/C][C]1.1716[/C][C]0.122339[/C][/ROW]
[ROW][C]6[/C][C]0.015675[/C][C]0.1437[/C][C]0.443054[/C][/ROW]
[ROW][C]7[/C][C]0.018621[/C][C]0.1707[/C][C]0.43245[/C][/ROW]
[ROW][C]8[/C][C]0.108517[/C][C]0.9946[/C][C]0.161399[/C][/ROW]
[ROW][C]9[/C][C]0.313809[/C][C]2.8761[/C][C]0.002551[/C][/ROW]
[ROW][C]10[/C][C]0.171562[/C][C]1.5724[/C][C]0.05981[/C][/ROW]
[ROW][C]11[/C][C]0.285447[/C][C]2.6162[/C][C]0.005271[/C][/ROW]
[ROW][C]12[/C][C]-0.026796[/C][C]-0.2456[/C][C]0.403298[/C][/ROW]
[ROW][C]13[/C][C]-0.434489[/C][C]-3.9822[/C][C]7.2e-05[/C][/ROW]
[ROW][C]14[/C][C]-0.060668[/C][C]-0.556[/C][C]0.289833[/C][/ROW]
[ROW][C]15[/C][C]0.035695[/C][C]0.3271[/C][C]0.372185[/C][/ROW]
[ROW][C]16[/C][C]0.007512[/C][C]0.0689[/C][C]0.472636[/C][/ROW]
[ROW][C]17[/C][C]-0.073188[/C][C]-0.6708[/C][C]0.252101[/C][/ROW]
[ROW][C]18[/C][C]-0.079666[/C][C]-0.7301[/C][C]0.233665[/C][/ROW]
[ROW][C]19[/C][C]0.064905[/C][C]0.5949[/C][C]0.276767[/C][/ROW]
[ROW][C]20[/C][C]0.011449[/C][C]0.1049[/C][C]0.458341[/C][/ROW]
[ROW][C]21[/C][C]-0.022757[/C][C]-0.2086[/C][C]0.417644[/C][/ROW]
[ROW][C]22[/C][C]-0.006511[/C][C]-0.0597[/C][C]0.476278[/C][/ROW]
[ROW][C]23[/C][C]0.042589[/C][C]0.3903[/C][C]0.348638[/C][/ROW]
[ROW][C]24[/C][C]-0.030072[/C][C]-0.2756[/C][C]0.391761[/C][/ROW]
[ROW][C]25[/C][C]-0.103302[/C][C]-0.9468[/C][C]0.173233[/C][/ROW]
[ROW][C]26[/C][C]-0.04739[/C][C]-0.4343[/C][C]0.332579[/C][/ROW]
[ROW][C]27[/C][C]-0.009577[/C][C]-0.0878[/C][C]0.465131[/C][/ROW]
[ROW][C]28[/C][C]0.040046[/C][C]0.367[/C][C]0.357261[/C][/ROW]
[ROW][C]29[/C][C]-0.069527[/C][C]-0.6372[/C][C]0.262855[/C][/ROW]
[ROW][C]30[/C][C]0.074308[/C][C]0.681[/C][C]0.248859[/C][/ROW]
[ROW][C]31[/C][C]-0.025904[/C][C]-0.2374[/C][C]0.406457[/C][/ROW]
[ROW][C]32[/C][C]-0.035356[/C][C]-0.324[/C][C]0.373355[/C][/ROW]
[ROW][C]33[/C][C]-0.042282[/C][C]-0.3875[/C][C]0.349674[/C][/ROW]
[ROW][C]34[/C][C]0.066553[/C][C]0.61[/C][C]0.271765[/C][/ROW]
[ROW][C]35[/C][C]-0.095862[/C][C]-0.8786[/C][C]0.191064[/C][/ROW]
[ROW][C]36[/C][C]0.052971[/C][C]0.4855[/C][C]0.314297[/C][/ROW]
[ROW][C]37[/C][C]-0.016536[/C][C]-0.1516[/C][C]0.439952[/C][/ROW]
[ROW][C]38[/C][C]-0.088842[/C][C]-0.8143[/C][C]0.208901[/C][/ROW]
[ROW][C]39[/C][C]-0.006287[/C][C]-0.0576[/C][C]0.477095[/C][/ROW]
[ROW][C]40[/C][C]-0.01767[/C][C]-0.162[/C][C]0.435866[/C][/ROW]
[ROW][C]41[/C][C]-0.011469[/C][C]-0.1051[/C][C]0.458266[/C][/ROW]
[ROW][C]42[/C][C]-0.115305[/C][C]-1.0568[/C][C]0.146819[/C][/ROW]
[ROW][C]43[/C][C]0.048609[/C][C]0.4455[/C][C]0.328551[/C][/ROW]
[ROW][C]44[/C][C]0.05233[/C][C]0.4796[/C][C]0.316374[/C][/ROW]
[ROW][C]45[/C][C]-0.076955[/C][C]-0.7053[/C][C]0.241286[/C][/ROW]
[ROW][C]46[/C][C]-0.038345[/C][C]-0.3514[/C][C]0.363068[/C][/ROW]
[ROW][C]47[/C][C]0.000732[/C][C]0.0067[/C][C]0.49733[/C][/ROW]
[ROW][C]48[/C][C]-0.04213[/C][C]-0.3861[/C][C]0.350191[/C][/ROW]
[/TABLE]
Source: https://freestatistics.org/blog/index.php?pk=226037&T=2

Globally Unique Identifier (entire table): ba.freestatistics.org/blog/index.php?pk=226037&T=2

As an alternative you can also use a QR Code:  

The GUIDs for individual cells are displayed in the table below:

Partial Autocorrelation Function
Time lag kPACF(k)T-STATP-value
10.8494757.78560
2-0.336004-3.07950.001401
30.0243080.22280.412121
40.019860.1820.428002
50.127831.17160.122339
60.0156750.14370.443054
70.0186210.17070.43245
80.1085170.99460.161399
90.3138092.87610.002551
100.1715621.57240.05981
110.2854472.61620.005271
12-0.026796-0.24560.403298
13-0.434489-3.98227.2e-05
14-0.060668-0.5560.289833
150.0356950.32710.372185
160.0075120.06890.472636
17-0.073188-0.67080.252101
18-0.079666-0.73010.233665
190.0649050.59490.276767
200.0114490.10490.458341
21-0.022757-0.20860.417644
22-0.006511-0.05970.476278
230.0425890.39030.348638
24-0.030072-0.27560.391761
25-0.103302-0.94680.173233
26-0.04739-0.43430.332579
27-0.009577-0.08780.465131
280.0400460.3670.357261
29-0.069527-0.63720.262855
300.0743080.6810.248859
31-0.025904-0.23740.406457
32-0.035356-0.3240.373355
33-0.042282-0.38750.349674
340.0665530.610.271765
35-0.095862-0.87860.191064
360.0529710.48550.314297
37-0.016536-0.15160.439952
38-0.088842-0.81430.208901
39-0.006287-0.05760.477095
40-0.01767-0.1620.435866
41-0.011469-0.10510.458266
42-0.115305-1.05680.146819
430.0486090.44550.328551
440.052330.47960.316374
45-0.076955-0.70530.241286
46-0.038345-0.35140.363068
470.0007320.00670.49733
48-0.04213-0.38610.350191


Parameters (Session):
par1 = 48 ; par2 = 1 ; par3 = 0 ; par4 = 0 ; par5 = 12 ; par6 = White Noise ; par7 = 0.95 ;
Parameters (R input):
par1 = 48 ; par2 = 1 ; par3 = 0 ; par4 = 0 ; par5 = 12 ; par6 = White Noise ; par7 = 0.95 ; par8 = ;
R code (references can be found in the software module):
if (par1 == 'Default') {
par1 = 10*log10(length(x))
} else {
par1 <- as.numeric(par1)
}
par2 <- as.numeric(par2)
par3 <- as.numeric(par3)
par4 <- as.numeric(par4)
par5 <- as.numeric(par5)
if (par6 == 'White Noise') par6 <- 'white' else par6 <- 'ma'
par7 <- as.numeric(par7)
if (par8 != '') par8 <- as.numeric(par8)
ox <- x
if (par8 == '') {
if (par2 == 0) {
x <- log(x)
} else {
x <- (x ^ par2 - 1) / par2
}
} else {
x <- log(x,base=par8)
}
if (par3 > 0) x <- diff(x,lag=1,difference=par3)
if (par4 > 0) x <- diff(x,lag=par5,difference=par4)
bitmap(file='picts.png')
op <- par(mfrow=c(2,1))
plot(ox,type='l',main='Original Time Series',xlab='time',ylab='value')
if (par8=='') {
mytitle <- paste('Working Time Series (lambda=',par2,', d=',par3,', D=',par4,')',sep='')
mysub <- paste('(lambda=',par2,', d=',par3,', D=',par4,', CI=', par7, ', CI type=',par6,')',sep='')
} else {
mytitle <- paste('Working Time Series (base=',par8,', d=',par3,', D=',par4,')',sep='')
mysub <- paste('(base=',par8,', d=',par3,', D=',par4,', CI=', par7, ', CI type=',par6,')',sep='')
}
plot(x,type='l', main=mytitle,xlab='time',ylab='value')
par(op)
dev.off()
bitmap(file='pic1.png')
racf <- acf(x, par1, main='Autocorrelation', xlab='time lag', ylab='ACF', ci.type=par6, ci=par7, sub=mysub)
dev.off()
bitmap(file='pic2.png')
rpacf <- pacf(x,par1,main='Partial Autocorrelation',xlab='lags',ylab='PACF',sub=mysub)
dev.off()
(myacf <- c(racf$acf))
(mypacf <- c(rpacf$acf))
lengthx <- length(x)
sqrtn <- sqrt(lengthx)
load(file='createtable')
a<-table.start()
a<-table.row.start(a)
a<-table.element(a,'Autocorrelation Function',4,TRUE)
a<-table.row.end(a)
a<-table.row.start(a)
a<-table.element(a,'Time lag k',header=TRUE)
a<-table.element(a,hyperlink('basics.htm','ACF(k)','click here for more information about the Autocorrelation Function'),header=TRUE)
a<-table.element(a,'T-STAT',header=TRUE)
a<-table.element(a,'P-value',header=TRUE)
a<-table.row.end(a)
for (i in 2:(par1+1)) {
a<-table.row.start(a)
a<-table.element(a,i-1,header=TRUE)
a<-table.element(a,round(myacf[i],6))
mytstat <- myacf[i]*sqrtn
a<-table.element(a,round(mytstat,4))
a<-table.element(a,round(1-pt(abs(mytstat),lengthx),6))
a<-table.row.end(a)
}
a<-table.end(a)
table.save(a,file='mytable.tab')
a<-table.start()
a<-table.row.start(a)
a<-table.element(a,'Partial Autocorrelation Function',4,TRUE)
a<-table.row.end(a)
a<-table.row.start(a)
a<-table.element(a,'Time lag k',header=TRUE)
a<-table.element(a,hyperlink('basics.htm','PACF(k)','click here for more information about the Partial Autocorrelation Function'),header=TRUE)
a<-table.element(a,'T-STAT',header=TRUE)
a<-table.element(a,'P-value',header=TRUE)
a<-table.row.end(a)
for (i in 1:par1) {
a<-table.row.start(a)
a<-table.element(a,i,header=TRUE)
a<-table.element(a,round(mypacf[i],6))
mytstat <- mypacf[i]*sqrtn
a<-table.element(a,round(mytstat,4))
a<-table.element(a,round(1-pt(abs(mytstat),lengthx),6))
a<-table.row.end(a)
}
a<-table.end(a)
table.save(a,file='mytable1.tab')