Free Statistics

of Irreproducible Research!

Author's title

Author*Unverified author*
R Software Modulerwasp_autocorrelation.wasp
Title produced by software(Partial) Autocorrelation Function
Date of computationMon, 18 Nov 2013 06:40:17 -0500
Cite this page as followsStatistical Computations at FreeStatistics.org, Office for Research Development and Education, URL https://freestatistics.org/blog/index.php?v=date/2013/Nov/18/t1384774840injzax91wjouygu.htm/, Retrieved Sat, 27 Apr 2024 08:07:23 +0000
Statistical Computations at FreeStatistics.org, Office for Research Development and Education, URL https://freestatistics.org/blog/index.php?pk=226047, Retrieved Sat, 27 Apr 2024 08:07:23 +0000
QR Codes:

Original text written by user:
IsPrivate?No (this computation is public)
User-defined keywords
Estimated Impact62
Family? (F = Feedback message, R = changed R code, M = changed R Module, P = changed Parameters, D = changed Data)
-       [(Partial) Autocorrelation Function] [] [2013-11-18 11:40:17] [764249a9cc4864d99a8b0ce95556daaa] [Current]
Feedback Forum

Post a new message
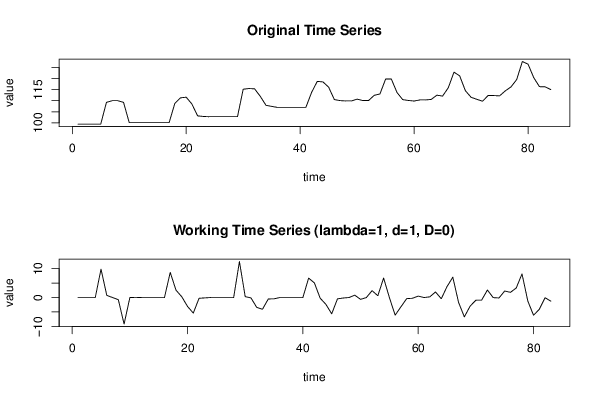
Dataseries X:
99.42
99.42
99.42
99.42
99.42
109.26
110
110
109.26
100.07
100.07
100.05
100.05
100.05
100.05
100.05
100.05
108.77
111.32
111.6
108.52
103.13
102.87
102.75
102.75
102.75
102.75
102.75
102.75
115.22
115.53
115.4
111.99
107.93
107.43
106.98
106.98
106.98
106.98
106.98
106.98
113.71
118.77
118.54
116.16
110.52
110.06
109.9
109.9
110.72
110.09
110.07
112.45
113.06
119.83
119.84
113.73
110.5
110.12
109.86
110.36
110.36
110.59
112.52
112.1
115.9
122.96
121.26
114.55
111.57
110.65
109.77
112.38
112.35
112.2
114.46
116.26
119.57
127.77
126.59
120.45
116.38
116.3
115.05


Summary of computational transaction
Raw Inputview raw input (R code)
Raw Outputview raw output of R engine
Computing time4 seconds
R Server'Gwilym Jenkins' @ jenkins.wessa.net

\begin{tabular}{lllllllll}
\hline
Summary of computational transaction \tabularnewline
Raw Input & view raw input (R code)  \tabularnewline
Raw Output & view raw output of R engine  \tabularnewline
Computing time & 4 seconds \tabularnewline
R Server & 'Gwilym Jenkins' @ jenkins.wessa.net \tabularnewline
\hline
\end{tabular}
%Source: https://freestatistics.org/blog/index.php?pk=226047&T=0

[TABLE]
[ROW][C]Summary of computational transaction[/C][/ROW]
[ROW][C]Raw Input[/C][C]view raw input (R code) [/C][/ROW]
[ROW][C]Raw Output[/C][C]view raw output of R engine [/C][/ROW]
[ROW][C]Computing time[/C][C]4 seconds[/C][/ROW]
[ROW][C]R Server[/C][C]'Gwilym Jenkins' @ jenkins.wessa.net[/C][/ROW]
[/TABLE]
Source: https://freestatistics.org/blog/index.php?pk=226047&T=0

Globally Unique Identifier (entire table): ba.freestatistics.org/blog/index.php?pk=226047&T=0

As an alternative you can also use a QR Code:  

The GUIDs for individual cells are displayed in the table below:

Summary of computational transaction
Raw Inputview raw input (R code)
Raw Outputview raw output of R engine
Computing time4 seconds
R Server'Gwilym Jenkins' @ jenkins.wessa.net


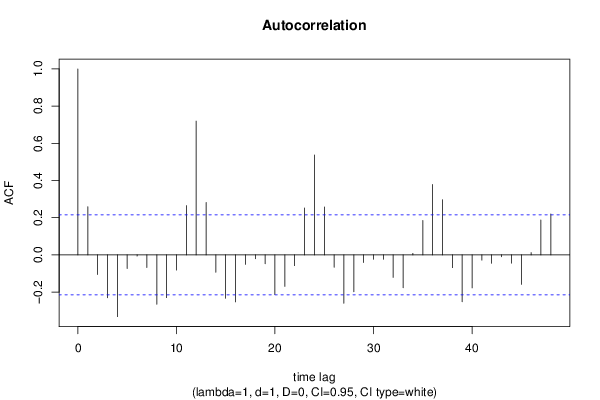
Autocorrelation Function
Time lag kACF(k)T-STATP-value
10.2593942.36320.010228
2-0.105257-0.95890.170188
3-0.230339-2.09850.019451
4-0.332157-3.02610.001649
5-0.073228-0.66710.253268
6-0.006483-0.05910.476522
7-0.06824-0.62170.267922
8-0.265907-2.42250.008795
9-0.229866-2.09420.019647
10-0.081807-0.74530.229098
110.2648112.41250.009023
120.7196526.55630
130.28142.56370.00608
14-0.093311-0.85010.198857
15-0.232947-2.12220.018399
16-0.252877-2.30380.011866
17-0.051193-0.46640.321078
18-0.020621-0.18790.42572
19-0.047341-0.43130.333685
20-0.212878-1.93940.027924
21-0.169238-1.54180.063459
22-0.057867-0.52720.299732
230.2519772.29560.01211
240.5368844.89122e-06
250.2575222.34610.010677
26-0.066654-0.60730.272671
27-0.259697-2.36590.010157
28-0.198733-1.81050.036915
29-0.040986-0.37340.354902
30-0.023258-0.21190.416358
31-0.023229-0.21160.416457
32-0.121075-1.1030.136597
33-0.176581-1.60870.055737
340.0081340.07410.470554
350.1846821.68250.048112
360.3787873.45090.000441
370.2966952.7030.004166
38-0.068427-0.62340.267366
39-0.252107-2.29680.012075
40-0.17755-1.61760.054776
41-0.028418-0.25890.398176
42-0.044807-0.40820.342084
43-0.009906-0.09020.464154
44-0.044395-0.40450.343457
45-0.158466-1.44370.076294
460.0122020.11120.455878
470.18791.71180.045329
480.2200172.00440.024141

\begin{tabular}{lllllllll}
\hline
Autocorrelation Function \tabularnewline
Time lag k & ACF(k) & T-STAT & P-value \tabularnewline
1 & 0.259394 & 2.3632 & 0.010228 \tabularnewline
2 & -0.105257 & -0.9589 & 0.170188 \tabularnewline
3 & -0.230339 & -2.0985 & 0.019451 \tabularnewline
4 & -0.332157 & -3.0261 & 0.001649 \tabularnewline
5 & -0.073228 & -0.6671 & 0.253268 \tabularnewline
6 & -0.006483 & -0.0591 & 0.476522 \tabularnewline
7 & -0.06824 & -0.6217 & 0.267922 \tabularnewline
8 & -0.265907 & -2.4225 & 0.008795 \tabularnewline
9 & -0.229866 & -2.0942 & 0.019647 \tabularnewline
10 & -0.081807 & -0.7453 & 0.229098 \tabularnewline
11 & 0.264811 & 2.4125 & 0.009023 \tabularnewline
12 & 0.719652 & 6.5563 & 0 \tabularnewline
13 & 0.2814 & 2.5637 & 0.00608 \tabularnewline
14 & -0.093311 & -0.8501 & 0.198857 \tabularnewline
15 & -0.232947 & -2.1222 & 0.018399 \tabularnewline
16 & -0.252877 & -2.3038 & 0.011866 \tabularnewline
17 & -0.051193 & -0.4664 & 0.321078 \tabularnewline
18 & -0.020621 & -0.1879 & 0.42572 \tabularnewline
19 & -0.047341 & -0.4313 & 0.333685 \tabularnewline
20 & -0.212878 & -1.9394 & 0.027924 \tabularnewline
21 & -0.169238 & -1.5418 & 0.063459 \tabularnewline
22 & -0.057867 & -0.5272 & 0.299732 \tabularnewline
23 & 0.251977 & 2.2956 & 0.01211 \tabularnewline
24 & 0.536884 & 4.8912 & 2e-06 \tabularnewline
25 & 0.257522 & 2.3461 & 0.010677 \tabularnewline
26 & -0.066654 & -0.6073 & 0.272671 \tabularnewline
27 & -0.259697 & -2.3659 & 0.010157 \tabularnewline
28 & -0.198733 & -1.8105 & 0.036915 \tabularnewline
29 & -0.040986 & -0.3734 & 0.354902 \tabularnewline
30 & -0.023258 & -0.2119 & 0.416358 \tabularnewline
31 & -0.023229 & -0.2116 & 0.416457 \tabularnewline
32 & -0.121075 & -1.103 & 0.136597 \tabularnewline
33 & -0.176581 & -1.6087 & 0.055737 \tabularnewline
34 & 0.008134 & 0.0741 & 0.470554 \tabularnewline
35 & 0.184682 & 1.6825 & 0.048112 \tabularnewline
36 & 0.378787 & 3.4509 & 0.000441 \tabularnewline
37 & 0.296695 & 2.703 & 0.004166 \tabularnewline
38 & -0.068427 & -0.6234 & 0.267366 \tabularnewline
39 & -0.252107 & -2.2968 & 0.012075 \tabularnewline
40 & -0.17755 & -1.6176 & 0.054776 \tabularnewline
41 & -0.028418 & -0.2589 & 0.398176 \tabularnewline
42 & -0.044807 & -0.4082 & 0.342084 \tabularnewline
43 & -0.009906 & -0.0902 & 0.464154 \tabularnewline
44 & -0.044395 & -0.4045 & 0.343457 \tabularnewline
45 & -0.158466 & -1.4437 & 0.076294 \tabularnewline
46 & 0.012202 & 0.1112 & 0.455878 \tabularnewline
47 & 0.1879 & 1.7118 & 0.045329 \tabularnewline
48 & 0.220017 & 2.0044 & 0.024141 \tabularnewline
\hline
\end{tabular}
%Source: https://freestatistics.org/blog/index.php?pk=226047&T=1

[TABLE]
[ROW][C]Autocorrelation Function[/C][/ROW]
[ROW][C]Time lag k[/C][C]ACF(k)[/C][C]T-STAT[/C][C]P-value[/C][/ROW]
[ROW][C]1[/C][C]0.259394[/C][C]2.3632[/C][C]0.010228[/C][/ROW]
[ROW][C]2[/C][C]-0.105257[/C][C]-0.9589[/C][C]0.170188[/C][/ROW]
[ROW][C]3[/C][C]-0.230339[/C][C]-2.0985[/C][C]0.019451[/C][/ROW]
[ROW][C]4[/C][C]-0.332157[/C][C]-3.0261[/C][C]0.001649[/C][/ROW]
[ROW][C]5[/C][C]-0.073228[/C][C]-0.6671[/C][C]0.253268[/C][/ROW]
[ROW][C]6[/C][C]-0.006483[/C][C]-0.0591[/C][C]0.476522[/C][/ROW]
[ROW][C]7[/C][C]-0.06824[/C][C]-0.6217[/C][C]0.267922[/C][/ROW]
[ROW][C]8[/C][C]-0.265907[/C][C]-2.4225[/C][C]0.008795[/C][/ROW]
[ROW][C]9[/C][C]-0.229866[/C][C]-2.0942[/C][C]0.019647[/C][/ROW]
[ROW][C]10[/C][C]-0.081807[/C][C]-0.7453[/C][C]0.229098[/C][/ROW]
[ROW][C]11[/C][C]0.264811[/C][C]2.4125[/C][C]0.009023[/C][/ROW]
[ROW][C]12[/C][C]0.719652[/C][C]6.5563[/C][C]0[/C][/ROW]
[ROW][C]13[/C][C]0.2814[/C][C]2.5637[/C][C]0.00608[/C][/ROW]
[ROW][C]14[/C][C]-0.093311[/C][C]-0.8501[/C][C]0.198857[/C][/ROW]
[ROW][C]15[/C][C]-0.232947[/C][C]-2.1222[/C][C]0.018399[/C][/ROW]
[ROW][C]16[/C][C]-0.252877[/C][C]-2.3038[/C][C]0.011866[/C][/ROW]
[ROW][C]17[/C][C]-0.051193[/C][C]-0.4664[/C][C]0.321078[/C][/ROW]
[ROW][C]18[/C][C]-0.020621[/C][C]-0.1879[/C][C]0.42572[/C][/ROW]
[ROW][C]19[/C][C]-0.047341[/C][C]-0.4313[/C][C]0.333685[/C][/ROW]
[ROW][C]20[/C][C]-0.212878[/C][C]-1.9394[/C][C]0.027924[/C][/ROW]
[ROW][C]21[/C][C]-0.169238[/C][C]-1.5418[/C][C]0.063459[/C][/ROW]
[ROW][C]22[/C][C]-0.057867[/C][C]-0.5272[/C][C]0.299732[/C][/ROW]
[ROW][C]23[/C][C]0.251977[/C][C]2.2956[/C][C]0.01211[/C][/ROW]
[ROW][C]24[/C][C]0.536884[/C][C]4.8912[/C][C]2e-06[/C][/ROW]
[ROW][C]25[/C][C]0.257522[/C][C]2.3461[/C][C]0.010677[/C][/ROW]
[ROW][C]26[/C][C]-0.066654[/C][C]-0.6073[/C][C]0.272671[/C][/ROW]
[ROW][C]27[/C][C]-0.259697[/C][C]-2.3659[/C][C]0.010157[/C][/ROW]
[ROW][C]28[/C][C]-0.198733[/C][C]-1.8105[/C][C]0.036915[/C][/ROW]
[ROW][C]29[/C][C]-0.040986[/C][C]-0.3734[/C][C]0.354902[/C][/ROW]
[ROW][C]30[/C][C]-0.023258[/C][C]-0.2119[/C][C]0.416358[/C][/ROW]
[ROW][C]31[/C][C]-0.023229[/C][C]-0.2116[/C][C]0.416457[/C][/ROW]
[ROW][C]32[/C][C]-0.121075[/C][C]-1.103[/C][C]0.136597[/C][/ROW]
[ROW][C]33[/C][C]-0.176581[/C][C]-1.6087[/C][C]0.055737[/C][/ROW]
[ROW][C]34[/C][C]0.008134[/C][C]0.0741[/C][C]0.470554[/C][/ROW]
[ROW][C]35[/C][C]0.184682[/C][C]1.6825[/C][C]0.048112[/C][/ROW]
[ROW][C]36[/C][C]0.378787[/C][C]3.4509[/C][C]0.000441[/C][/ROW]
[ROW][C]37[/C][C]0.296695[/C][C]2.703[/C][C]0.004166[/C][/ROW]
[ROW][C]38[/C][C]-0.068427[/C][C]-0.6234[/C][C]0.267366[/C][/ROW]
[ROW][C]39[/C][C]-0.252107[/C][C]-2.2968[/C][C]0.012075[/C][/ROW]
[ROW][C]40[/C][C]-0.17755[/C][C]-1.6176[/C][C]0.054776[/C][/ROW]
[ROW][C]41[/C][C]-0.028418[/C][C]-0.2589[/C][C]0.398176[/C][/ROW]
[ROW][C]42[/C][C]-0.044807[/C][C]-0.4082[/C][C]0.342084[/C][/ROW]
[ROW][C]43[/C][C]-0.009906[/C][C]-0.0902[/C][C]0.464154[/C][/ROW]
[ROW][C]44[/C][C]-0.044395[/C][C]-0.4045[/C][C]0.343457[/C][/ROW]
[ROW][C]45[/C][C]-0.158466[/C][C]-1.4437[/C][C]0.076294[/C][/ROW]
[ROW][C]46[/C][C]0.012202[/C][C]0.1112[/C][C]0.455878[/C][/ROW]
[ROW][C]47[/C][C]0.1879[/C][C]1.7118[/C][C]0.045329[/C][/ROW]
[ROW][C]48[/C][C]0.220017[/C][C]2.0044[/C][C]0.024141[/C][/ROW]
[/TABLE]
Source: https://freestatistics.org/blog/index.php?pk=226047&T=1

Globally Unique Identifier (entire table): ba.freestatistics.org/blog/index.php?pk=226047&T=1

As an alternative you can also use a QR Code:  

The GUIDs for individual cells are displayed in the table below:

Autocorrelation Function
Time lag kACF(k)T-STATP-value
10.2593942.36320.010228
2-0.105257-0.95890.170188
3-0.230339-2.09850.019451
4-0.332157-3.02610.001649
5-0.073228-0.66710.253268
6-0.006483-0.05910.476522
7-0.06824-0.62170.267922
8-0.265907-2.42250.008795
9-0.229866-2.09420.019647
10-0.081807-0.74530.229098
110.2648112.41250.009023
120.7196526.55630
130.28142.56370.00608
14-0.093311-0.85010.198857
15-0.232947-2.12220.018399
16-0.252877-2.30380.011866
17-0.051193-0.46640.321078
18-0.020621-0.18790.42572
19-0.047341-0.43130.333685
20-0.212878-1.93940.027924
21-0.169238-1.54180.063459
22-0.057867-0.52720.299732
230.2519772.29560.01211
240.5368844.89122e-06
250.2575222.34610.010677
26-0.066654-0.60730.272671
27-0.259697-2.36590.010157
28-0.198733-1.81050.036915
29-0.040986-0.37340.354902
30-0.023258-0.21190.416358
31-0.023229-0.21160.416457
32-0.121075-1.1030.136597
33-0.176581-1.60870.055737
340.0081340.07410.470554
350.1846821.68250.048112
360.3787873.45090.000441
370.2966952.7030.004166
38-0.068427-0.62340.267366
39-0.252107-2.29680.012075
40-0.17755-1.61760.054776
41-0.028418-0.25890.398176
42-0.044807-0.40820.342084
43-0.009906-0.09020.464154
44-0.044395-0.40450.343457
45-0.158466-1.44370.076294
460.0122020.11120.455878
470.18791.71180.045329
480.2200172.00440.024141


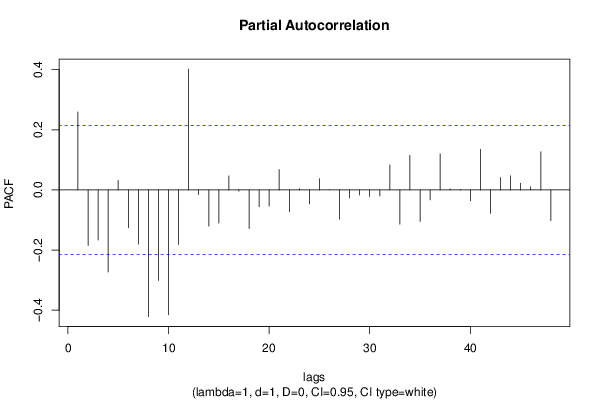
Partial Autocorrelation Function
Time lag kPACF(k)T-STATP-value
10.2593942.36320.010228
2-0.184989-1.68530.047841
3-0.166519-1.51710.066526
4-0.273277-2.48970.007391
50.0315830.28770.387132
6-0.125985-1.14780.127178
7-0.180505-1.64450.05193
8-0.421783-3.84260.000119
9-0.301406-2.74590.003698
10-0.415269-3.78330.000146
11-0.180872-1.64780.051585
120.4025173.66710.000216
13-0.015747-0.14350.443138
14-0.120567-1.09840.1376
15-0.110288-1.00480.158964
160.0466060.42460.336114
17-0.004042-0.03680.485356
18-0.128559-1.17120.12243
19-0.056218-0.51220.304946
20-0.054115-0.4930.311654
210.0675790.61570.269896
22-0.072492-0.66040.255402
230.0036780.03350.486675
24-0.046544-0.4240.336317
250.0370440.33750.368302
260.0003630.00330.498686
27-0.097367-0.88710.188807
28-0.026593-0.24230.404584
29-0.016898-0.15390.439014
30-0.021929-0.19980.42107
31-0.020418-0.1860.426442
320.0827960.75430.2264
33-0.113835-1.03710.151354
340.1148141.0460.149298
35-0.104972-0.95630.170839
36-0.033162-0.30210.381657
370.1199671.0930.138789
380.0033290.03030.487939
390.0013280.01210.49519
40-0.035996-0.32790.371891
410.1349111.22910.111253
42-0.078086-0.71140.239417
430.0411020.37450.354508
440.0468320.42670.335367
450.0221260.20160.420371
460.0102410.09330.462945
470.1268371.15550.125593
48-0.102255-0.93160.177125

\begin{tabular}{lllllllll}
\hline
Partial Autocorrelation Function \tabularnewline
Time lag k & PACF(k) & T-STAT & P-value \tabularnewline
1 & 0.259394 & 2.3632 & 0.010228 \tabularnewline
2 & -0.184989 & -1.6853 & 0.047841 \tabularnewline
3 & -0.166519 & -1.5171 & 0.066526 \tabularnewline
4 & -0.273277 & -2.4897 & 0.007391 \tabularnewline
5 & 0.031583 & 0.2877 & 0.387132 \tabularnewline
6 & -0.125985 & -1.1478 & 0.127178 \tabularnewline
7 & -0.180505 & -1.6445 & 0.05193 \tabularnewline
8 & -0.421783 & -3.8426 & 0.000119 \tabularnewline
9 & -0.301406 & -2.7459 & 0.003698 \tabularnewline
10 & -0.415269 & -3.7833 & 0.000146 \tabularnewline
11 & -0.180872 & -1.6478 & 0.051585 \tabularnewline
12 & 0.402517 & 3.6671 & 0.000216 \tabularnewline
13 & -0.015747 & -0.1435 & 0.443138 \tabularnewline
14 & -0.120567 & -1.0984 & 0.1376 \tabularnewline
15 & -0.110288 & -1.0048 & 0.158964 \tabularnewline
16 & 0.046606 & 0.4246 & 0.336114 \tabularnewline
17 & -0.004042 & -0.0368 & 0.485356 \tabularnewline
18 & -0.128559 & -1.1712 & 0.12243 \tabularnewline
19 & -0.056218 & -0.5122 & 0.304946 \tabularnewline
20 & -0.054115 & -0.493 & 0.311654 \tabularnewline
21 & 0.067579 & 0.6157 & 0.269896 \tabularnewline
22 & -0.072492 & -0.6604 & 0.255402 \tabularnewline
23 & 0.003678 & 0.0335 & 0.486675 \tabularnewline
24 & -0.046544 & -0.424 & 0.336317 \tabularnewline
25 & 0.037044 & 0.3375 & 0.368302 \tabularnewline
26 & 0.000363 & 0.0033 & 0.498686 \tabularnewline
27 & -0.097367 & -0.8871 & 0.188807 \tabularnewline
28 & -0.026593 & -0.2423 & 0.404584 \tabularnewline
29 & -0.016898 & -0.1539 & 0.439014 \tabularnewline
30 & -0.021929 & -0.1998 & 0.42107 \tabularnewline
31 & -0.020418 & -0.186 & 0.426442 \tabularnewline
32 & 0.082796 & 0.7543 & 0.2264 \tabularnewline
33 & -0.113835 & -1.0371 & 0.151354 \tabularnewline
34 & 0.114814 & 1.046 & 0.149298 \tabularnewline
35 & -0.104972 & -0.9563 & 0.170839 \tabularnewline
36 & -0.033162 & -0.3021 & 0.381657 \tabularnewline
37 & 0.119967 & 1.093 & 0.138789 \tabularnewline
38 & 0.003329 & 0.0303 & 0.487939 \tabularnewline
39 & 0.001328 & 0.0121 & 0.49519 \tabularnewline
40 & -0.035996 & -0.3279 & 0.371891 \tabularnewline
41 & 0.134911 & 1.2291 & 0.111253 \tabularnewline
42 & -0.078086 & -0.7114 & 0.239417 \tabularnewline
43 & 0.041102 & 0.3745 & 0.354508 \tabularnewline
44 & 0.046832 & 0.4267 & 0.335367 \tabularnewline
45 & 0.022126 & 0.2016 & 0.420371 \tabularnewline
46 & 0.010241 & 0.0933 & 0.462945 \tabularnewline
47 & 0.126837 & 1.1555 & 0.125593 \tabularnewline
48 & -0.102255 & -0.9316 & 0.177125 \tabularnewline
\hline
\end{tabular}
%Source: https://freestatistics.org/blog/index.php?pk=226047&T=2

[TABLE]
[ROW][C]Partial Autocorrelation Function[/C][/ROW]
[ROW][C]Time lag k[/C][C]PACF(k)[/C][C]T-STAT[/C][C]P-value[/C][/ROW]
[ROW][C]1[/C][C]0.259394[/C][C]2.3632[/C][C]0.010228[/C][/ROW]
[ROW][C]2[/C][C]-0.184989[/C][C]-1.6853[/C][C]0.047841[/C][/ROW]
[ROW][C]3[/C][C]-0.166519[/C][C]-1.5171[/C][C]0.066526[/C][/ROW]
[ROW][C]4[/C][C]-0.273277[/C][C]-2.4897[/C][C]0.007391[/C][/ROW]
[ROW][C]5[/C][C]0.031583[/C][C]0.2877[/C][C]0.387132[/C][/ROW]
[ROW][C]6[/C][C]-0.125985[/C][C]-1.1478[/C][C]0.127178[/C][/ROW]
[ROW][C]7[/C][C]-0.180505[/C][C]-1.6445[/C][C]0.05193[/C][/ROW]
[ROW][C]8[/C][C]-0.421783[/C][C]-3.8426[/C][C]0.000119[/C][/ROW]
[ROW][C]9[/C][C]-0.301406[/C][C]-2.7459[/C][C]0.003698[/C][/ROW]
[ROW][C]10[/C][C]-0.415269[/C][C]-3.7833[/C][C]0.000146[/C][/ROW]
[ROW][C]11[/C][C]-0.180872[/C][C]-1.6478[/C][C]0.051585[/C][/ROW]
[ROW][C]12[/C][C]0.402517[/C][C]3.6671[/C][C]0.000216[/C][/ROW]
[ROW][C]13[/C][C]-0.015747[/C][C]-0.1435[/C][C]0.443138[/C][/ROW]
[ROW][C]14[/C][C]-0.120567[/C][C]-1.0984[/C][C]0.1376[/C][/ROW]
[ROW][C]15[/C][C]-0.110288[/C][C]-1.0048[/C][C]0.158964[/C][/ROW]
[ROW][C]16[/C][C]0.046606[/C][C]0.4246[/C][C]0.336114[/C][/ROW]
[ROW][C]17[/C][C]-0.004042[/C][C]-0.0368[/C][C]0.485356[/C][/ROW]
[ROW][C]18[/C][C]-0.128559[/C][C]-1.1712[/C][C]0.12243[/C][/ROW]
[ROW][C]19[/C][C]-0.056218[/C][C]-0.5122[/C][C]0.304946[/C][/ROW]
[ROW][C]20[/C][C]-0.054115[/C][C]-0.493[/C][C]0.311654[/C][/ROW]
[ROW][C]21[/C][C]0.067579[/C][C]0.6157[/C][C]0.269896[/C][/ROW]
[ROW][C]22[/C][C]-0.072492[/C][C]-0.6604[/C][C]0.255402[/C][/ROW]
[ROW][C]23[/C][C]0.003678[/C][C]0.0335[/C][C]0.486675[/C][/ROW]
[ROW][C]24[/C][C]-0.046544[/C][C]-0.424[/C][C]0.336317[/C][/ROW]
[ROW][C]25[/C][C]0.037044[/C][C]0.3375[/C][C]0.368302[/C][/ROW]
[ROW][C]26[/C][C]0.000363[/C][C]0.0033[/C][C]0.498686[/C][/ROW]
[ROW][C]27[/C][C]-0.097367[/C][C]-0.8871[/C][C]0.188807[/C][/ROW]
[ROW][C]28[/C][C]-0.026593[/C][C]-0.2423[/C][C]0.404584[/C][/ROW]
[ROW][C]29[/C][C]-0.016898[/C][C]-0.1539[/C][C]0.439014[/C][/ROW]
[ROW][C]30[/C][C]-0.021929[/C][C]-0.1998[/C][C]0.42107[/C][/ROW]
[ROW][C]31[/C][C]-0.020418[/C][C]-0.186[/C][C]0.426442[/C][/ROW]
[ROW][C]32[/C][C]0.082796[/C][C]0.7543[/C][C]0.2264[/C][/ROW]
[ROW][C]33[/C][C]-0.113835[/C][C]-1.0371[/C][C]0.151354[/C][/ROW]
[ROW][C]34[/C][C]0.114814[/C][C]1.046[/C][C]0.149298[/C][/ROW]
[ROW][C]35[/C][C]-0.104972[/C][C]-0.9563[/C][C]0.170839[/C][/ROW]
[ROW][C]36[/C][C]-0.033162[/C][C]-0.3021[/C][C]0.381657[/C][/ROW]
[ROW][C]37[/C][C]0.119967[/C][C]1.093[/C][C]0.138789[/C][/ROW]
[ROW][C]38[/C][C]0.003329[/C][C]0.0303[/C][C]0.487939[/C][/ROW]
[ROW][C]39[/C][C]0.001328[/C][C]0.0121[/C][C]0.49519[/C][/ROW]
[ROW][C]40[/C][C]-0.035996[/C][C]-0.3279[/C][C]0.371891[/C][/ROW]
[ROW][C]41[/C][C]0.134911[/C][C]1.2291[/C][C]0.111253[/C][/ROW]
[ROW][C]42[/C][C]-0.078086[/C][C]-0.7114[/C][C]0.239417[/C][/ROW]
[ROW][C]43[/C][C]0.041102[/C][C]0.3745[/C][C]0.354508[/C][/ROW]
[ROW][C]44[/C][C]0.046832[/C][C]0.4267[/C][C]0.335367[/C][/ROW]
[ROW][C]45[/C][C]0.022126[/C][C]0.2016[/C][C]0.420371[/C][/ROW]
[ROW][C]46[/C][C]0.010241[/C][C]0.0933[/C][C]0.462945[/C][/ROW]
[ROW][C]47[/C][C]0.126837[/C][C]1.1555[/C][C]0.125593[/C][/ROW]
[ROW][C]48[/C][C]-0.102255[/C][C]-0.9316[/C][C]0.177125[/C][/ROW]
[/TABLE]
Source: https://freestatistics.org/blog/index.php?pk=226047&T=2

Globally Unique Identifier (entire table): ba.freestatistics.org/blog/index.php?pk=226047&T=2

As an alternative you can also use a QR Code:  

The GUIDs for individual cells are displayed in the table below:

Partial Autocorrelation Function
Time lag kPACF(k)T-STATP-value
10.2593942.36320.010228
2-0.184989-1.68530.047841
3-0.166519-1.51710.066526
4-0.273277-2.48970.007391
50.0315830.28770.387132
6-0.125985-1.14780.127178
7-0.180505-1.64450.05193
8-0.421783-3.84260.000119
9-0.301406-2.74590.003698
10-0.415269-3.78330.000146
11-0.180872-1.64780.051585
120.4025173.66710.000216
13-0.015747-0.14350.443138
14-0.120567-1.09840.1376
15-0.110288-1.00480.158964
160.0466060.42460.336114
17-0.004042-0.03680.485356
18-0.128559-1.17120.12243
19-0.056218-0.51220.304946
20-0.054115-0.4930.311654
210.0675790.61570.269896
22-0.072492-0.66040.255402
230.0036780.03350.486675
24-0.046544-0.4240.336317
250.0370440.33750.368302
260.0003630.00330.498686
27-0.097367-0.88710.188807
28-0.026593-0.24230.404584
29-0.016898-0.15390.439014
30-0.021929-0.19980.42107
31-0.020418-0.1860.426442
320.0827960.75430.2264
33-0.113835-1.03710.151354
340.1148141.0460.149298
35-0.104972-0.95630.170839
36-0.033162-0.30210.381657
370.1199671.0930.138789
380.0033290.03030.487939
390.0013280.01210.49519
40-0.035996-0.32790.371891
410.1349111.22910.111253
42-0.078086-0.71140.239417
430.0411020.37450.354508
440.0468320.42670.335367
450.0221260.20160.420371
460.0102410.09330.462945
470.1268371.15550.125593
48-0.102255-0.93160.177125


Parameters (Session):
par1 = 48 ; par2 = 1 ; par3 = 1 ; par4 = 0 ; par5 = 12 ; par6 = White Noise ; par7 = 0.95 ;
Parameters (R input):
par1 = 48 ; par2 = 1 ; par3 = 1 ; par4 = 0 ; par5 = 12 ; par6 = White Noise ; par7 = 0.95 ; par8 = ;
R code (references can be found in the software module):
if (par1 == 'Default') {
par1 = 10*log10(length(x))
} else {
par1 <- as.numeric(par1)
}
par2 <- as.numeric(par2)
par3 <- as.numeric(par3)
par4 <- as.numeric(par4)
par5 <- as.numeric(par5)
if (par6 == 'White Noise') par6 <- 'white' else par6 <- 'ma'
par7 <- as.numeric(par7)
if (par8 != '') par8 <- as.numeric(par8)
ox <- x
if (par8 == '') {
if (par2 == 0) {
x <- log(x)
} else {
x <- (x ^ par2 - 1) / par2
}
} else {
x <- log(x,base=par8)
}
if (par3 > 0) x <- diff(x,lag=1,difference=par3)
if (par4 > 0) x <- diff(x,lag=par5,difference=par4)
bitmap(file='picts.png')
op <- par(mfrow=c(2,1))
plot(ox,type='l',main='Original Time Series',xlab='time',ylab='value')
if (par8=='') {
mytitle <- paste('Working Time Series (lambda=',par2,', d=',par3,', D=',par4,')',sep='')
mysub <- paste('(lambda=',par2,', d=',par3,', D=',par4,', CI=', par7, ', CI type=',par6,')',sep='')
} else {
mytitle <- paste('Working Time Series (base=',par8,', d=',par3,', D=',par4,')',sep='')
mysub <- paste('(base=',par8,', d=',par3,', D=',par4,', CI=', par7, ', CI type=',par6,')',sep='')
}
plot(x,type='l', main=mytitle,xlab='time',ylab='value')
par(op)
dev.off()
bitmap(file='pic1.png')
racf <- acf(x, par1, main='Autocorrelation', xlab='time lag', ylab='ACF', ci.type=par6, ci=par7, sub=mysub)
dev.off()
bitmap(file='pic2.png')
rpacf <- pacf(x,par1,main='Partial Autocorrelation',xlab='lags',ylab='PACF',sub=mysub)
dev.off()
(myacf <- c(racf$acf))
(mypacf <- c(rpacf$acf))
lengthx <- length(x)
sqrtn <- sqrt(lengthx)
load(file='createtable')
a<-table.start()
a<-table.row.start(a)
a<-table.element(a,'Autocorrelation Function',4,TRUE)
a<-table.row.end(a)
a<-table.row.start(a)
a<-table.element(a,'Time lag k',header=TRUE)
a<-table.element(a,hyperlink('basics.htm','ACF(k)','click here for more information about the Autocorrelation Function'),header=TRUE)
a<-table.element(a,'T-STAT',header=TRUE)
a<-table.element(a,'P-value',header=TRUE)
a<-table.row.end(a)
for (i in 2:(par1+1)) {
a<-table.row.start(a)
a<-table.element(a,i-1,header=TRUE)
a<-table.element(a,round(myacf[i],6))
mytstat <- myacf[i]*sqrtn
a<-table.element(a,round(mytstat,4))
a<-table.element(a,round(1-pt(abs(mytstat),lengthx),6))
a<-table.row.end(a)
}
a<-table.end(a)
table.save(a,file='mytable.tab')
a<-table.start()
a<-table.row.start(a)
a<-table.element(a,'Partial Autocorrelation Function',4,TRUE)
a<-table.row.end(a)
a<-table.row.start(a)
a<-table.element(a,'Time lag k',header=TRUE)
a<-table.element(a,hyperlink('basics.htm','PACF(k)','click here for more information about the Partial Autocorrelation Function'),header=TRUE)
a<-table.element(a,'T-STAT',header=TRUE)
a<-table.element(a,'P-value',header=TRUE)
a<-table.row.end(a)
for (i in 1:par1) {
a<-table.row.start(a)
a<-table.element(a,i,header=TRUE)
a<-table.element(a,round(mypacf[i],6))
mytstat <- mypacf[i]*sqrtn
a<-table.element(a,round(mytstat,4))
a<-table.element(a,round(1-pt(abs(mytstat),lengthx),6))
a<-table.row.end(a)
}
a<-table.end(a)
table.save(a,file='mytable1.tab')