Free Statistics

of Irreproducible Research!

Author's title

Author*Unverified author*
R Software Modulerwasp_autocorrelation.wasp
Title produced by software(Partial) Autocorrelation Function
Date of computationMon, 18 Nov 2013 10:38:20 -0500
Cite this page as followsStatistical Computations at FreeStatistics.org, Office for Research Development and Education, URL https://freestatistics.org/blog/index.php?v=date/2013/Nov/18/t1384789109jt7l2abm4pfadql.htm/, Retrieved Sat, 27 Apr 2024 11:58:21 +0000
Statistical Computations at FreeStatistics.org, Office for Research Development and Education, URL https://freestatistics.org/blog/index.php?pk=226129, Retrieved Sat, 27 Apr 2024 11:58:21 +0000
QR Codes:

Original text written by user:
IsPrivate?No (this computation is public)
User-defined keywords
Estimated Impact58
Family? (F = Feedback message, R = changed R code, M = changed R Module, P = changed Parameters, D = changed Data)
-       [(Partial) Autocorrelation Function] [] [2013-11-18 15:38:20] [629d05b8910d8b56ad89862016f2bc6c] [Current]
Feedback Forum

Post a new message
Dataseries X:
120,6
119,9
119,48
117,45
118,37
117,07
114,98
112,59
111,7
112,04
110,79
109,82
109,11
109,84
109,31
108,29
107,42
106,71
105,11
104,43
105,55
106,12
105,78
105,33
104,63
104,62
105,57
107,5
107,52
107,76
106,74
106,21
105,77
105,27
104,35
103,52
102,28
100,93
101,04
99,95
99,55
99,56
99,01
98,64
98,98
100,8
100,32
100,72
280,8
280,4
280,4
280,3
281
280,9
279,7
283,1
290,6
291,6
291,7
291,8
291,7
291,5
291,7
293,4
293,1
293,1
292,6
292,1
292,2
292
292,1
293,4
292,2
292,1
291,6
290,9
290,9
290,8
290,5
290
290,2
290,1
291
291,8


Summary of computational transaction
Raw Inputview raw input (R code)
Raw Outputview raw output of R engine
Computing time3 seconds
R Server'Sir Ronald Aylmer Fisher' @ fisher.wessa.net

\begin{tabular}{lllllllll}
\hline
Summary of computational transaction \tabularnewline
Raw Input & view raw input (R code)  \tabularnewline
Raw Output & view raw output of R engine  \tabularnewline
Computing time & 3 seconds \tabularnewline
R Server & 'Sir Ronald Aylmer Fisher' @ fisher.wessa.net \tabularnewline
\hline
\end{tabular}
%Source: https://freestatistics.org/blog/index.php?pk=226129&T=0

[TABLE]
[ROW][C]Summary of computational transaction[/C][/ROW]
[ROW][C]Raw Input[/C][C]view raw input (R code) [/C][/ROW]
[ROW][C]Raw Output[/C][C]view raw output of R engine [/C][/ROW]
[ROW][C]Computing time[/C][C]3 seconds[/C][/ROW]
[ROW][C]R Server[/C][C]'Sir Ronald Aylmer Fisher' @ fisher.wessa.net[/C][/ROW]
[/TABLE]
Source: https://freestatistics.org/blog/index.php?pk=226129&T=0

Globally Unique Identifier (entire table): ba.freestatistics.org/blog/index.php?pk=226129&T=0

As an alternative you can also use a QR Code:  

The GUIDs for individual cells are displayed in the table below:

Summary of computational transaction
Raw Inputview raw input (R code)
Raw Outputview raw output of R engine
Computing time3 seconds
R Server'Sir Ronald Aylmer Fisher' @ fisher.wessa.net


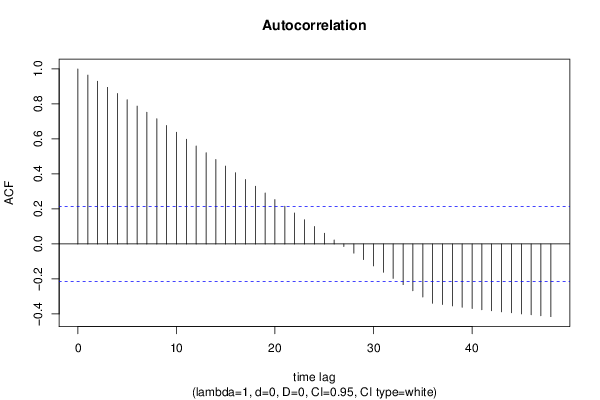
Autocorrelation Function
Time lag kACF(k)T-STATP-value
10.9649088.84350
20.9298058.52180
30.894928.20210
40.8593647.87620
50.823637.54870
60.7878057.22030
70.7521826.89390
80.7153916.55670
90.6766386.20150
100.6378395.84590
110.5987995.48810
120.5599625.13211e-06
130.521214.7774e-06
140.4830044.42681.4e-05
150.4449564.07815.1e-05
160.4064573.72520.000176
170.3680993.37370.000562
180.3297533.02220.001663
190.291572.67230.004524
200.2534142.32260.011311
210.2153091.97330.025872
220.1770841.6230.054168
230.1386021.27030.103741
240.0997160.91390.18169
250.0612480.56130.288028
260.0229340.21020.417013
27-0.015058-0.1380.445281
28-0.052694-0.4830.315193
29-0.089473-0.820.207258
30-0.125528-1.15050.126605
31-0.161391-1.47920.071418
32-0.197011-1.80560.037279
33-0.232391-2.12990.018053
34-0.267536-2.4520.008139
35-0.302865-2.77580.003394
36-0.338752-3.10470.001298
37-0.34657-3.17640.001043
38-0.35419-3.24620.00084
39-0.361526-3.31340.000681
40-0.368756-3.37970.000551
41-0.375717-3.44350.000449
42-0.382091-3.50190.000371
43-0.38805-3.55650.00031
44-0.393713-3.60840.000261
45-0.399638-3.66270.000218
46-0.405002-3.71190.000184
47-0.410264-3.76010.000157
48-0.415508-3.80820.000133

\begin{tabular}{lllllllll}
\hline
Autocorrelation Function \tabularnewline
Time lag k & ACF(k) & T-STAT & P-value \tabularnewline
1 & 0.964908 & 8.8435 & 0 \tabularnewline
2 & 0.929805 & 8.5218 & 0 \tabularnewline
3 & 0.89492 & 8.2021 & 0 \tabularnewline
4 & 0.859364 & 7.8762 & 0 \tabularnewline
5 & 0.82363 & 7.5487 & 0 \tabularnewline
6 & 0.787805 & 7.2203 & 0 \tabularnewline
7 & 0.752182 & 6.8939 & 0 \tabularnewline
8 & 0.715391 & 6.5567 & 0 \tabularnewline
9 & 0.676638 & 6.2015 & 0 \tabularnewline
10 & 0.637839 & 5.8459 & 0 \tabularnewline
11 & 0.598799 & 5.4881 & 0 \tabularnewline
12 & 0.559962 & 5.1321 & 1e-06 \tabularnewline
13 & 0.52121 & 4.777 & 4e-06 \tabularnewline
14 & 0.483004 & 4.4268 & 1.4e-05 \tabularnewline
15 & 0.444956 & 4.0781 & 5.1e-05 \tabularnewline
16 & 0.406457 & 3.7252 & 0.000176 \tabularnewline
17 & 0.368099 & 3.3737 & 0.000562 \tabularnewline
18 & 0.329753 & 3.0222 & 0.001663 \tabularnewline
19 & 0.29157 & 2.6723 & 0.004524 \tabularnewline
20 & 0.253414 & 2.3226 & 0.011311 \tabularnewline
21 & 0.215309 & 1.9733 & 0.025872 \tabularnewline
22 & 0.177084 & 1.623 & 0.054168 \tabularnewline
23 & 0.138602 & 1.2703 & 0.103741 \tabularnewline
24 & 0.099716 & 0.9139 & 0.18169 \tabularnewline
25 & 0.061248 & 0.5613 & 0.288028 \tabularnewline
26 & 0.022934 & 0.2102 & 0.417013 \tabularnewline
27 & -0.015058 & -0.138 & 0.445281 \tabularnewline
28 & -0.052694 & -0.483 & 0.315193 \tabularnewline
29 & -0.089473 & -0.82 & 0.207258 \tabularnewline
30 & -0.125528 & -1.1505 & 0.126605 \tabularnewline
31 & -0.161391 & -1.4792 & 0.071418 \tabularnewline
32 & -0.197011 & -1.8056 & 0.037279 \tabularnewline
33 & -0.232391 & -2.1299 & 0.018053 \tabularnewline
34 & -0.267536 & -2.452 & 0.008139 \tabularnewline
35 & -0.302865 & -2.7758 & 0.003394 \tabularnewline
36 & -0.338752 & -3.1047 & 0.001298 \tabularnewline
37 & -0.34657 & -3.1764 & 0.001043 \tabularnewline
38 & -0.35419 & -3.2462 & 0.00084 \tabularnewline
39 & -0.361526 & -3.3134 & 0.000681 \tabularnewline
40 & -0.368756 & -3.3797 & 0.000551 \tabularnewline
41 & -0.375717 & -3.4435 & 0.000449 \tabularnewline
42 & -0.382091 & -3.5019 & 0.000371 \tabularnewline
43 & -0.38805 & -3.5565 & 0.00031 \tabularnewline
44 & -0.393713 & -3.6084 & 0.000261 \tabularnewline
45 & -0.399638 & -3.6627 & 0.000218 \tabularnewline
46 & -0.405002 & -3.7119 & 0.000184 \tabularnewline
47 & -0.410264 & -3.7601 & 0.000157 \tabularnewline
48 & -0.415508 & -3.8082 & 0.000133 \tabularnewline
\hline
\end{tabular}
%Source: https://freestatistics.org/blog/index.php?pk=226129&T=1

[TABLE]
[ROW][C]Autocorrelation Function[/C][/ROW]
[ROW][C]Time lag k[/C][C]ACF(k)[/C][C]T-STAT[/C][C]P-value[/C][/ROW]
[ROW][C]1[/C][C]0.964908[/C][C]8.8435[/C][C]0[/C][/ROW]
[ROW][C]2[/C][C]0.929805[/C][C]8.5218[/C][C]0[/C][/ROW]
[ROW][C]3[/C][C]0.89492[/C][C]8.2021[/C][C]0[/C][/ROW]
[ROW][C]4[/C][C]0.859364[/C][C]7.8762[/C][C]0[/C][/ROW]
[ROW][C]5[/C][C]0.82363[/C][C]7.5487[/C][C]0[/C][/ROW]
[ROW][C]6[/C][C]0.787805[/C][C]7.2203[/C][C]0[/C][/ROW]
[ROW][C]7[/C][C]0.752182[/C][C]6.8939[/C][C]0[/C][/ROW]
[ROW][C]8[/C][C]0.715391[/C][C]6.5567[/C][C]0[/C][/ROW]
[ROW][C]9[/C][C]0.676638[/C][C]6.2015[/C][C]0[/C][/ROW]
[ROW][C]10[/C][C]0.637839[/C][C]5.8459[/C][C]0[/C][/ROW]
[ROW][C]11[/C][C]0.598799[/C][C]5.4881[/C][C]0[/C][/ROW]
[ROW][C]12[/C][C]0.559962[/C][C]5.1321[/C][C]1e-06[/C][/ROW]
[ROW][C]13[/C][C]0.52121[/C][C]4.777[/C][C]4e-06[/C][/ROW]
[ROW][C]14[/C][C]0.483004[/C][C]4.4268[/C][C]1.4e-05[/C][/ROW]
[ROW][C]15[/C][C]0.444956[/C][C]4.0781[/C][C]5.1e-05[/C][/ROW]
[ROW][C]16[/C][C]0.406457[/C][C]3.7252[/C][C]0.000176[/C][/ROW]
[ROW][C]17[/C][C]0.368099[/C][C]3.3737[/C][C]0.000562[/C][/ROW]
[ROW][C]18[/C][C]0.329753[/C][C]3.0222[/C][C]0.001663[/C][/ROW]
[ROW][C]19[/C][C]0.29157[/C][C]2.6723[/C][C]0.004524[/C][/ROW]
[ROW][C]20[/C][C]0.253414[/C][C]2.3226[/C][C]0.011311[/C][/ROW]
[ROW][C]21[/C][C]0.215309[/C][C]1.9733[/C][C]0.025872[/C][/ROW]
[ROW][C]22[/C][C]0.177084[/C][C]1.623[/C][C]0.054168[/C][/ROW]
[ROW][C]23[/C][C]0.138602[/C][C]1.2703[/C][C]0.103741[/C][/ROW]
[ROW][C]24[/C][C]0.099716[/C][C]0.9139[/C][C]0.18169[/C][/ROW]
[ROW][C]25[/C][C]0.061248[/C][C]0.5613[/C][C]0.288028[/C][/ROW]
[ROW][C]26[/C][C]0.022934[/C][C]0.2102[/C][C]0.417013[/C][/ROW]
[ROW][C]27[/C][C]-0.015058[/C][C]-0.138[/C][C]0.445281[/C][/ROW]
[ROW][C]28[/C][C]-0.052694[/C][C]-0.483[/C][C]0.315193[/C][/ROW]
[ROW][C]29[/C][C]-0.089473[/C][C]-0.82[/C][C]0.207258[/C][/ROW]
[ROW][C]30[/C][C]-0.125528[/C][C]-1.1505[/C][C]0.126605[/C][/ROW]
[ROW][C]31[/C][C]-0.161391[/C][C]-1.4792[/C][C]0.071418[/C][/ROW]
[ROW][C]32[/C][C]-0.197011[/C][C]-1.8056[/C][C]0.037279[/C][/ROW]
[ROW][C]33[/C][C]-0.232391[/C][C]-2.1299[/C][C]0.018053[/C][/ROW]
[ROW][C]34[/C][C]-0.267536[/C][C]-2.452[/C][C]0.008139[/C][/ROW]
[ROW][C]35[/C][C]-0.302865[/C][C]-2.7758[/C][C]0.003394[/C][/ROW]
[ROW][C]36[/C][C]-0.338752[/C][C]-3.1047[/C][C]0.001298[/C][/ROW]
[ROW][C]37[/C][C]-0.34657[/C][C]-3.1764[/C][C]0.001043[/C][/ROW]
[ROW][C]38[/C][C]-0.35419[/C][C]-3.2462[/C][C]0.00084[/C][/ROW]
[ROW][C]39[/C][C]-0.361526[/C][C]-3.3134[/C][C]0.000681[/C][/ROW]
[ROW][C]40[/C][C]-0.368756[/C][C]-3.3797[/C][C]0.000551[/C][/ROW]
[ROW][C]41[/C][C]-0.375717[/C][C]-3.4435[/C][C]0.000449[/C][/ROW]
[ROW][C]42[/C][C]-0.382091[/C][C]-3.5019[/C][C]0.000371[/C][/ROW]
[ROW][C]43[/C][C]-0.38805[/C][C]-3.5565[/C][C]0.00031[/C][/ROW]
[ROW][C]44[/C][C]-0.393713[/C][C]-3.6084[/C][C]0.000261[/C][/ROW]
[ROW][C]45[/C][C]-0.399638[/C][C]-3.6627[/C][C]0.000218[/C][/ROW]
[ROW][C]46[/C][C]-0.405002[/C][C]-3.7119[/C][C]0.000184[/C][/ROW]
[ROW][C]47[/C][C]-0.410264[/C][C]-3.7601[/C][C]0.000157[/C][/ROW]
[ROW][C]48[/C][C]-0.415508[/C][C]-3.8082[/C][C]0.000133[/C][/ROW]
[/TABLE]
Source: https://freestatistics.org/blog/index.php?pk=226129&T=1

Globally Unique Identifier (entire table): ba.freestatistics.org/blog/index.php?pk=226129&T=1

As an alternative you can also use a QR Code:  

The GUIDs for individual cells are displayed in the table below:

Autocorrelation Function
Time lag kACF(k)T-STATP-value
10.9649088.84350
20.9298058.52180
30.894928.20210
40.8593647.87620
50.823637.54870
60.7878057.22030
70.7521826.89390
80.7153916.55670
90.6766386.20150
100.6378395.84590
110.5987995.48810
120.5599625.13211e-06
130.521214.7774e-06
140.4830044.42681.4e-05
150.4449564.07815.1e-05
160.4064573.72520.000176
170.3680993.37370.000562
180.3297533.02220.001663
190.291572.67230.004524
200.2534142.32260.011311
210.2153091.97330.025872
220.1770841.6230.054168
230.1386021.27030.103741
240.0997160.91390.18169
250.0612480.56130.288028
260.0229340.21020.417013
27-0.015058-0.1380.445281
28-0.052694-0.4830.315193
29-0.089473-0.820.207258
30-0.125528-1.15050.126605
31-0.161391-1.47920.071418
32-0.197011-1.80560.037279
33-0.232391-2.12990.018053
34-0.267536-2.4520.008139
35-0.302865-2.77580.003394
36-0.338752-3.10470.001298
37-0.34657-3.17640.001043
38-0.35419-3.24620.00084
39-0.361526-3.31340.000681
40-0.368756-3.37970.000551
41-0.375717-3.44350.000449
42-0.382091-3.50190.000371
43-0.38805-3.55650.00031
44-0.393713-3.60840.000261
45-0.399638-3.66270.000218
46-0.405002-3.71190.000184
47-0.410264-3.76010.000157
48-0.415508-3.80820.000133


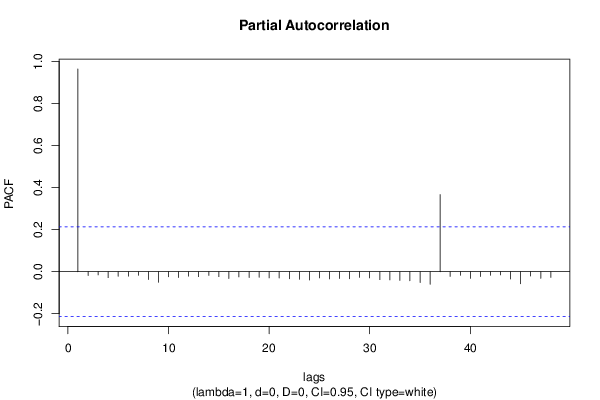
Partial Autocorrelation Function
Time lag kPACF(k)T-STATP-value
10.9649088.84350
2-0.018019-0.16520.434611
3-0.015023-0.13770.445408
4-0.028152-0.2580.398513
5-0.021682-0.19870.421481
6-0.020999-0.19250.423922
7-0.01702-0.1560.438208
8-0.037283-0.34170.366712
9-0.049964-0.45790.324095
10-0.024076-0.22070.412946
11-0.027191-0.24920.401902
12-0.020994-0.19240.423943
13-0.023581-0.21610.414708
14-0.017542-0.16080.436329
15-0.023407-0.21450.415328
16-0.032041-0.29370.384871
17-0.024677-0.22620.410811
18-0.027803-0.25480.399743
19-0.026244-0.24050.405253
20-0.029314-0.26870.394422
21-0.02998-0.27480.392085
22-0.033738-0.30920.378963
23-0.036238-0.33210.37031
24-0.039632-0.36320.35867
25-0.02934-0.26890.394331
26-0.033998-0.31160.37806
27-0.032686-0.29960.382623
28-0.033391-0.3060.380167
29-0.027109-0.24850.402194
30-0.029421-0.26960.394046
31-0.037803-0.34650.364927
32-0.039023-0.35770.36075
33-0.041198-0.37760.353345
34-0.04283-0.39250.347827
35-0.051175-0.4690.320132
36-0.059775-0.54790.292624
370.3668523.36230.000583
38-0.022272-0.20410.419374
39-0.01684-0.15430.438855
40-0.031727-0.29080.385968
41-0.022702-0.20810.41784
42-0.016637-0.15250.439585
43-0.015181-0.13910.444838
44-0.034835-0.31930.375159
45-0.057168-0.52390.300847
46-0.020465-0.18760.425834
47-0.031573-0.28940.386503
48-0.027075-0.24810.402315

\begin{tabular}{lllllllll}
\hline
Partial Autocorrelation Function \tabularnewline
Time lag k & PACF(k) & T-STAT & P-value \tabularnewline
1 & 0.964908 & 8.8435 & 0 \tabularnewline
2 & -0.018019 & -0.1652 & 0.434611 \tabularnewline
3 & -0.015023 & -0.1377 & 0.445408 \tabularnewline
4 & -0.028152 & -0.258 & 0.398513 \tabularnewline
5 & -0.021682 & -0.1987 & 0.421481 \tabularnewline
6 & -0.020999 & -0.1925 & 0.423922 \tabularnewline
7 & -0.01702 & -0.156 & 0.438208 \tabularnewline
8 & -0.037283 & -0.3417 & 0.366712 \tabularnewline
9 & -0.049964 & -0.4579 & 0.324095 \tabularnewline
10 & -0.024076 & -0.2207 & 0.412946 \tabularnewline
11 & -0.027191 & -0.2492 & 0.401902 \tabularnewline
12 & -0.020994 & -0.1924 & 0.423943 \tabularnewline
13 & -0.023581 & -0.2161 & 0.414708 \tabularnewline
14 & -0.017542 & -0.1608 & 0.436329 \tabularnewline
15 & -0.023407 & -0.2145 & 0.415328 \tabularnewline
16 & -0.032041 & -0.2937 & 0.384871 \tabularnewline
17 & -0.024677 & -0.2262 & 0.410811 \tabularnewline
18 & -0.027803 & -0.2548 & 0.399743 \tabularnewline
19 & -0.026244 & -0.2405 & 0.405253 \tabularnewline
20 & -0.029314 & -0.2687 & 0.394422 \tabularnewline
21 & -0.02998 & -0.2748 & 0.392085 \tabularnewline
22 & -0.033738 & -0.3092 & 0.378963 \tabularnewline
23 & -0.036238 & -0.3321 & 0.37031 \tabularnewline
24 & -0.039632 & -0.3632 & 0.35867 \tabularnewline
25 & -0.02934 & -0.2689 & 0.394331 \tabularnewline
26 & -0.033998 & -0.3116 & 0.37806 \tabularnewline
27 & -0.032686 & -0.2996 & 0.382623 \tabularnewline
28 & -0.033391 & -0.306 & 0.380167 \tabularnewline
29 & -0.027109 & -0.2485 & 0.402194 \tabularnewline
30 & -0.029421 & -0.2696 & 0.394046 \tabularnewline
31 & -0.037803 & -0.3465 & 0.364927 \tabularnewline
32 & -0.039023 & -0.3577 & 0.36075 \tabularnewline
33 & -0.041198 & -0.3776 & 0.353345 \tabularnewline
34 & -0.04283 & -0.3925 & 0.347827 \tabularnewline
35 & -0.051175 & -0.469 & 0.320132 \tabularnewline
36 & -0.059775 & -0.5479 & 0.292624 \tabularnewline
37 & 0.366852 & 3.3623 & 0.000583 \tabularnewline
38 & -0.022272 & -0.2041 & 0.419374 \tabularnewline
39 & -0.01684 & -0.1543 & 0.438855 \tabularnewline
40 & -0.031727 & -0.2908 & 0.385968 \tabularnewline
41 & -0.022702 & -0.2081 & 0.41784 \tabularnewline
42 & -0.016637 & -0.1525 & 0.439585 \tabularnewline
43 & -0.015181 & -0.1391 & 0.444838 \tabularnewline
44 & -0.034835 & -0.3193 & 0.375159 \tabularnewline
45 & -0.057168 & -0.5239 & 0.300847 \tabularnewline
46 & -0.020465 & -0.1876 & 0.425834 \tabularnewline
47 & -0.031573 & -0.2894 & 0.386503 \tabularnewline
48 & -0.027075 & -0.2481 & 0.402315 \tabularnewline
\hline
\end{tabular}
%Source: https://freestatistics.org/blog/index.php?pk=226129&T=2

[TABLE]
[ROW][C]Partial Autocorrelation Function[/C][/ROW]
[ROW][C]Time lag k[/C][C]PACF(k)[/C][C]T-STAT[/C][C]P-value[/C][/ROW]
[ROW][C]1[/C][C]0.964908[/C][C]8.8435[/C][C]0[/C][/ROW]
[ROW][C]2[/C][C]-0.018019[/C][C]-0.1652[/C][C]0.434611[/C][/ROW]
[ROW][C]3[/C][C]-0.015023[/C][C]-0.1377[/C][C]0.445408[/C][/ROW]
[ROW][C]4[/C][C]-0.028152[/C][C]-0.258[/C][C]0.398513[/C][/ROW]
[ROW][C]5[/C][C]-0.021682[/C][C]-0.1987[/C][C]0.421481[/C][/ROW]
[ROW][C]6[/C][C]-0.020999[/C][C]-0.1925[/C][C]0.423922[/C][/ROW]
[ROW][C]7[/C][C]-0.01702[/C][C]-0.156[/C][C]0.438208[/C][/ROW]
[ROW][C]8[/C][C]-0.037283[/C][C]-0.3417[/C][C]0.366712[/C][/ROW]
[ROW][C]9[/C][C]-0.049964[/C][C]-0.4579[/C][C]0.324095[/C][/ROW]
[ROW][C]10[/C][C]-0.024076[/C][C]-0.2207[/C][C]0.412946[/C][/ROW]
[ROW][C]11[/C][C]-0.027191[/C][C]-0.2492[/C][C]0.401902[/C][/ROW]
[ROW][C]12[/C][C]-0.020994[/C][C]-0.1924[/C][C]0.423943[/C][/ROW]
[ROW][C]13[/C][C]-0.023581[/C][C]-0.2161[/C][C]0.414708[/C][/ROW]
[ROW][C]14[/C][C]-0.017542[/C][C]-0.1608[/C][C]0.436329[/C][/ROW]
[ROW][C]15[/C][C]-0.023407[/C][C]-0.2145[/C][C]0.415328[/C][/ROW]
[ROW][C]16[/C][C]-0.032041[/C][C]-0.2937[/C][C]0.384871[/C][/ROW]
[ROW][C]17[/C][C]-0.024677[/C][C]-0.2262[/C][C]0.410811[/C][/ROW]
[ROW][C]18[/C][C]-0.027803[/C][C]-0.2548[/C][C]0.399743[/C][/ROW]
[ROW][C]19[/C][C]-0.026244[/C][C]-0.2405[/C][C]0.405253[/C][/ROW]
[ROW][C]20[/C][C]-0.029314[/C][C]-0.2687[/C][C]0.394422[/C][/ROW]
[ROW][C]21[/C][C]-0.02998[/C][C]-0.2748[/C][C]0.392085[/C][/ROW]
[ROW][C]22[/C][C]-0.033738[/C][C]-0.3092[/C][C]0.378963[/C][/ROW]
[ROW][C]23[/C][C]-0.036238[/C][C]-0.3321[/C][C]0.37031[/C][/ROW]
[ROW][C]24[/C][C]-0.039632[/C][C]-0.3632[/C][C]0.35867[/C][/ROW]
[ROW][C]25[/C][C]-0.02934[/C][C]-0.2689[/C][C]0.394331[/C][/ROW]
[ROW][C]26[/C][C]-0.033998[/C][C]-0.3116[/C][C]0.37806[/C][/ROW]
[ROW][C]27[/C][C]-0.032686[/C][C]-0.2996[/C][C]0.382623[/C][/ROW]
[ROW][C]28[/C][C]-0.033391[/C][C]-0.306[/C][C]0.380167[/C][/ROW]
[ROW][C]29[/C][C]-0.027109[/C][C]-0.2485[/C][C]0.402194[/C][/ROW]
[ROW][C]30[/C][C]-0.029421[/C][C]-0.2696[/C][C]0.394046[/C][/ROW]
[ROW][C]31[/C][C]-0.037803[/C][C]-0.3465[/C][C]0.364927[/C][/ROW]
[ROW][C]32[/C][C]-0.039023[/C][C]-0.3577[/C][C]0.36075[/C][/ROW]
[ROW][C]33[/C][C]-0.041198[/C][C]-0.3776[/C][C]0.353345[/C][/ROW]
[ROW][C]34[/C][C]-0.04283[/C][C]-0.3925[/C][C]0.347827[/C][/ROW]
[ROW][C]35[/C][C]-0.051175[/C][C]-0.469[/C][C]0.320132[/C][/ROW]
[ROW][C]36[/C][C]-0.059775[/C][C]-0.5479[/C][C]0.292624[/C][/ROW]
[ROW][C]37[/C][C]0.366852[/C][C]3.3623[/C][C]0.000583[/C][/ROW]
[ROW][C]38[/C][C]-0.022272[/C][C]-0.2041[/C][C]0.419374[/C][/ROW]
[ROW][C]39[/C][C]-0.01684[/C][C]-0.1543[/C][C]0.438855[/C][/ROW]
[ROW][C]40[/C][C]-0.031727[/C][C]-0.2908[/C][C]0.385968[/C][/ROW]
[ROW][C]41[/C][C]-0.022702[/C][C]-0.2081[/C][C]0.41784[/C][/ROW]
[ROW][C]42[/C][C]-0.016637[/C][C]-0.1525[/C][C]0.439585[/C][/ROW]
[ROW][C]43[/C][C]-0.015181[/C][C]-0.1391[/C][C]0.444838[/C][/ROW]
[ROW][C]44[/C][C]-0.034835[/C][C]-0.3193[/C][C]0.375159[/C][/ROW]
[ROW][C]45[/C][C]-0.057168[/C][C]-0.5239[/C][C]0.300847[/C][/ROW]
[ROW][C]46[/C][C]-0.020465[/C][C]-0.1876[/C][C]0.425834[/C][/ROW]
[ROW][C]47[/C][C]-0.031573[/C][C]-0.2894[/C][C]0.386503[/C][/ROW]
[ROW][C]48[/C][C]-0.027075[/C][C]-0.2481[/C][C]0.402315[/C][/ROW]
[/TABLE]
Source: https://freestatistics.org/blog/index.php?pk=226129&T=2

Globally Unique Identifier (entire table): ba.freestatistics.org/blog/index.php?pk=226129&T=2

As an alternative you can also use a QR Code:  

The GUIDs for individual cells are displayed in the table below:

Partial Autocorrelation Function
Time lag kPACF(k)T-STATP-value
10.9649088.84350
2-0.018019-0.16520.434611
3-0.015023-0.13770.445408
4-0.028152-0.2580.398513
5-0.021682-0.19870.421481
6-0.020999-0.19250.423922
7-0.01702-0.1560.438208
8-0.037283-0.34170.366712
9-0.049964-0.45790.324095
10-0.024076-0.22070.412946
11-0.027191-0.24920.401902
12-0.020994-0.19240.423943
13-0.023581-0.21610.414708
14-0.017542-0.16080.436329
15-0.023407-0.21450.415328
16-0.032041-0.29370.384871
17-0.024677-0.22620.410811
18-0.027803-0.25480.399743
19-0.026244-0.24050.405253
20-0.029314-0.26870.394422
21-0.02998-0.27480.392085
22-0.033738-0.30920.378963
23-0.036238-0.33210.37031
24-0.039632-0.36320.35867
25-0.02934-0.26890.394331
26-0.033998-0.31160.37806
27-0.032686-0.29960.382623
28-0.033391-0.3060.380167
29-0.027109-0.24850.402194
30-0.029421-0.26960.394046
31-0.037803-0.34650.364927
32-0.039023-0.35770.36075
33-0.041198-0.37760.353345
34-0.04283-0.39250.347827
35-0.051175-0.4690.320132
36-0.059775-0.54790.292624
370.3668523.36230.000583
38-0.022272-0.20410.419374
39-0.01684-0.15430.438855
40-0.031727-0.29080.385968
41-0.022702-0.20810.41784
42-0.016637-0.15250.439585
43-0.015181-0.13910.444838
44-0.034835-0.31930.375159
45-0.057168-0.52390.300847
46-0.020465-0.18760.425834
47-0.031573-0.28940.386503
48-0.027075-0.24810.402315


Parameters (Session):
par1 = 48 ; par2 = 1 ; par3 = 0 ; par4 = 0 ; par5 = 12 ; par6 = White Noise ; par7 = 0.95 ;
Parameters (R input):
par1 = 48 ; par2 = 1 ; par3 = 0 ; par4 = 0 ; par5 = 12 ; par6 = White Noise ; par7 = 0.95 ; par8 = ;
R code (references can be found in the software module):
if (par1 == 'Default') {
par1 = 10*log10(length(x))
} else {
par1 <- as.numeric(par1)
}
par2 <- as.numeric(par2)
par3 <- as.numeric(par3)
par4 <- as.numeric(par4)
par5 <- as.numeric(par5)
if (par6 == 'White Noise') par6 <- 'white' else par6 <- 'ma'
par7 <- as.numeric(par7)
if (par8 != '') par8 <- as.numeric(par8)
ox <- x
if (par8 == '') {
if (par2 == 0) {
x <- log(x)
} else {
x <- (x ^ par2 - 1) / par2
}
} else {
x <- log(x,base=par8)
}
if (par3 > 0) x <- diff(x,lag=1,difference=par3)
if (par4 > 0) x <- diff(x,lag=par5,difference=par4)
bitmap(file='picts.png')
op <- par(mfrow=c(2,1))
plot(ox,type='l',main='Original Time Series',xlab='time',ylab='value')
if (par8=='') {
mytitle <- paste('Working Time Series (lambda=',par2,', d=',par3,', D=',par4,')',sep='')
mysub <- paste('(lambda=',par2,', d=',par3,', D=',par4,', CI=', par7, ', CI type=',par6,')',sep='')
} else {
mytitle <- paste('Working Time Series (base=',par8,', d=',par3,', D=',par4,')',sep='')
mysub <- paste('(base=',par8,', d=',par3,', D=',par4,', CI=', par7, ', CI type=',par6,')',sep='')
}
plot(x,type='l', main=mytitle,xlab='time',ylab='value')
par(op)
dev.off()
bitmap(file='pic1.png')
racf <- acf(x, par1, main='Autocorrelation', xlab='time lag', ylab='ACF', ci.type=par6, ci=par7, sub=mysub)
dev.off()
bitmap(file='pic2.png')
rpacf <- pacf(x,par1,main='Partial Autocorrelation',xlab='lags',ylab='PACF',sub=mysub)
dev.off()
(myacf <- c(racf$acf))
(mypacf <- c(rpacf$acf))
lengthx <- length(x)
sqrtn <- sqrt(lengthx)
load(file='createtable')
a<-table.start()
a<-table.row.start(a)
a<-table.element(a,'Autocorrelation Function',4,TRUE)
a<-table.row.end(a)
a<-table.row.start(a)
a<-table.element(a,'Time lag k',header=TRUE)
a<-table.element(a,hyperlink('basics.htm','ACF(k)','click here for more information about the Autocorrelation Function'),header=TRUE)
a<-table.element(a,'T-STAT',header=TRUE)
a<-table.element(a,'P-value',header=TRUE)
a<-table.row.end(a)
for (i in 2:(par1+1)) {
a<-table.row.start(a)
a<-table.element(a,i-1,header=TRUE)
a<-table.element(a,round(myacf[i],6))
mytstat <- myacf[i]*sqrtn
a<-table.element(a,round(mytstat,4))
a<-table.element(a,round(1-pt(abs(mytstat),lengthx),6))
a<-table.row.end(a)
}
a<-table.end(a)
table.save(a,file='mytable.tab')
a<-table.start()
a<-table.row.start(a)
a<-table.element(a,'Partial Autocorrelation Function',4,TRUE)
a<-table.row.end(a)
a<-table.row.start(a)
a<-table.element(a,'Time lag k',header=TRUE)
a<-table.element(a,hyperlink('basics.htm','PACF(k)','click here for more information about the Partial Autocorrelation Function'),header=TRUE)
a<-table.element(a,'T-STAT',header=TRUE)
a<-table.element(a,'P-value',header=TRUE)
a<-table.row.end(a)
for (i in 1:par1) {
a<-table.row.start(a)
a<-table.element(a,i,header=TRUE)
a<-table.element(a,round(mypacf[i],6))
mytstat <- mypacf[i]*sqrtn
a<-table.element(a,round(mytstat,4))
a<-table.element(a,round(1-pt(abs(mytstat),lengthx),6))
a<-table.row.end(a)
}
a<-table.end(a)
table.save(a,file='mytable1.tab')