Free Statistics

of Irreproducible Research!

Author's title

Author*Unverified author*
R Software Modulerwasp_autocorrelation.wasp
Title produced by software(Partial) Autocorrelation Function
Date of computationMon, 18 Nov 2013 11:50:21 -0500
Cite this page as followsStatistical Computations at FreeStatistics.org, Office for Research Development and Education, URL https://freestatistics.org/blog/index.php?v=date/2013/Nov/18/t1384793725e3kd3qxf77ot80v.htm/, Retrieved Sat, 27 Apr 2024 07:46:19 +0000
Statistical Computations at FreeStatistics.org, Office for Research Development and Education, URL https://freestatistics.org/blog/index.php?pk=226166, Retrieved Sat, 27 Apr 2024 07:46:19 +0000
QR Codes:

Original text written by user:
IsPrivate?No (this computation is public)
User-defined keywords
Estimated Impact77
Family? (F = Feedback message, R = changed R code, M = changed R Module, P = changed Parameters, D = changed Data)
-     [(Partial) Autocorrelation Function] [] [2013-11-18 09:06:48] [4137616dc99e71bd0abe7ac75f4ed0c6]
- R  D    [(Partial) Autocorrelation Function] [] [2013-11-18 16:50:21] [548ba37af61861f215c3470847960b18] [Current]
- R PD      [(Partial) Autocorrelation Function] [] [2013-11-18 17:01:32] [4137616dc99e71bd0abe7ac75f4ed0c6]
Feedback Forum

Post a new message
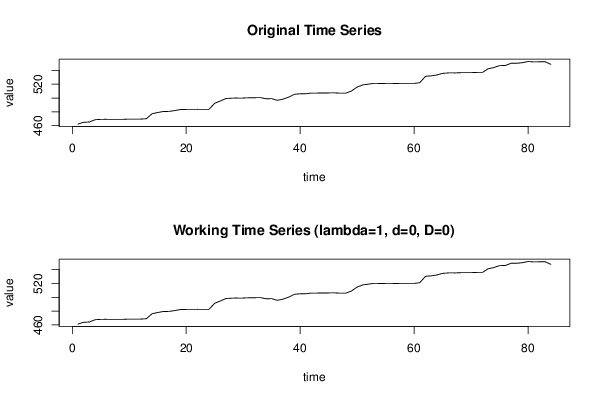
Dataseries X:
462,23
464,79
465,22
468,52
469,02
469,15
469,15
469,15
469,15
469,41
469,45
469,45
469,93
477,19
478,97
480,44
480,56
481,8
483,24
483,45
483,53
483,59
483,59
483,59
492,36
495,71
499,29
499,78
500
500
500,29
500,42
500,61
498,9
499,06
496,61
498,41
501,26
505,4
506,07
506,2
507,14
507,14
507,28
507,34
507,48
506,97
506,97
510,1
515,84
519
520,1
521,26
521,04
521,12
521,12
521,1
521,16
521,14
521,13
522,17
531,39
532,12
533,34
535,72
536,25
536,25
536,68
536,76
536,79
536,99
536,99
542,38
544,1
546,96
547,04
550,27
550,32
551,17
552,83
552,35
552,44
552,47
548,78


Summary of computational transaction
Raw Inputview raw input (R code)
Raw Outputview raw output of R engine
Computing time3 seconds
R Server'George Udny Yule' @ yule.wessa.net

\begin{tabular}{lllllllll}
\hline
Summary of computational transaction \tabularnewline
Raw Input & view raw input (R code)  \tabularnewline
Raw Output & view raw output of R engine  \tabularnewline
Computing time & 3 seconds \tabularnewline
R Server & 'George Udny Yule' @ yule.wessa.net \tabularnewline
\hline
\end{tabular}
%Source: https://freestatistics.org/blog/index.php?pk=226166&T=0

[TABLE]
[ROW][C]Summary of computational transaction[/C][/ROW]
[ROW][C]Raw Input[/C][C]view raw input (R code) [/C][/ROW]
[ROW][C]Raw Output[/C][C]view raw output of R engine [/C][/ROW]
[ROW][C]Computing time[/C][C]3 seconds[/C][/ROW]
[ROW][C]R Server[/C][C]'George Udny Yule' @ yule.wessa.net[/C][/ROW]
[/TABLE]
Source: https://freestatistics.org/blog/index.php?pk=226166&T=0

Globally Unique Identifier (entire table): ba.freestatistics.org/blog/index.php?pk=226166&T=0

As an alternative you can also use a QR Code:  

The GUIDs for individual cells are displayed in the table below:

Summary of computational transaction
Raw Inputview raw input (R code)
Raw Outputview raw output of R engine
Computing time3 seconds
R Server'George Udny Yule' @ yule.wessa.net


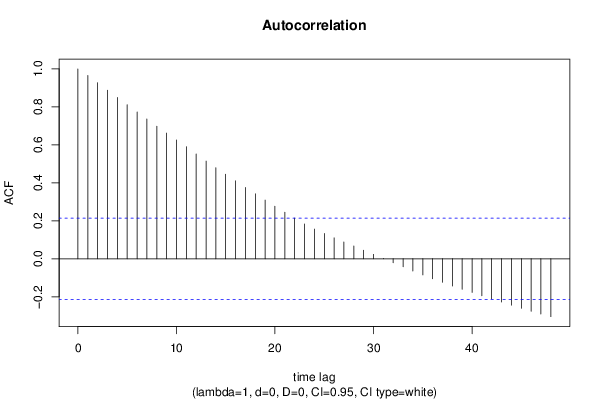
Autocorrelation Function
Time lag kACF(k)T-STATP-value
10.9653058.84720
20.92748.49980
30.8877588.13640
40.8498337.78890
50.8113067.43570
60.7737017.09110
70.7361376.74680
80.6982536.39960
90.6621476.06870
100.6258745.73620
110.5901185.40850
120.5523065.0621e-06
130.5146744.71715e-06
140.4797734.39721.6e-05
150.4450384.07885.1e-05
160.4104483.76180.000156
170.3757593.44390.000448
180.3419833.13430.001186
190.3089692.83170.002896
200.276472.53390.006569
210.2454232.24930.013554
220.2144511.96550.026332
230.1836481.68320.048028
240.1562111.43170.07797
250.133241.22120.11272
260.1101981.010.157702
270.0889370.81510.208655
280.0672690.61650.269606
290.0454350.41640.339083
300.0234310.21480.415241
310.0014810.01360.4946
32-0.020802-0.19070.424629
33-0.04214-0.38620.350155
34-0.064261-0.5890.278734
35-0.08471-0.77640.219852
36-0.104984-0.96220.169356
37-0.123982-1.13630.129528
38-0.143023-1.31080.096745
39-0.160137-1.46770.072963
40-0.177063-1.62280.054188
41-0.194442-1.78210.039174
42-0.211115-1.93490.028184
43-0.227951-2.08920.019858
44-0.244264-2.23870.013909
45-0.260661-2.3890.009567
46-0.276622-2.53530.006544
47-0.291045-2.66750.004584
48-0.304716-2.79280.003235

\begin{tabular}{lllllllll}
\hline
Autocorrelation Function \tabularnewline
Time lag k & ACF(k) & T-STAT & P-value \tabularnewline
1 & 0.965305 & 8.8472 & 0 \tabularnewline
2 & 0.9274 & 8.4998 & 0 \tabularnewline
3 & 0.887758 & 8.1364 & 0 \tabularnewline
4 & 0.849833 & 7.7889 & 0 \tabularnewline
5 & 0.811306 & 7.4357 & 0 \tabularnewline
6 & 0.773701 & 7.0911 & 0 \tabularnewline
7 & 0.736137 & 6.7468 & 0 \tabularnewline
8 & 0.698253 & 6.3996 & 0 \tabularnewline
9 & 0.662147 & 6.0687 & 0 \tabularnewline
10 & 0.625874 & 5.7362 & 0 \tabularnewline
11 & 0.590118 & 5.4085 & 0 \tabularnewline
12 & 0.552306 & 5.062 & 1e-06 \tabularnewline
13 & 0.514674 & 4.7171 & 5e-06 \tabularnewline
14 & 0.479773 & 4.3972 & 1.6e-05 \tabularnewline
15 & 0.445038 & 4.0788 & 5.1e-05 \tabularnewline
16 & 0.410448 & 3.7618 & 0.000156 \tabularnewline
17 & 0.375759 & 3.4439 & 0.000448 \tabularnewline
18 & 0.341983 & 3.1343 & 0.001186 \tabularnewline
19 & 0.308969 & 2.8317 & 0.002896 \tabularnewline
20 & 0.27647 & 2.5339 & 0.006569 \tabularnewline
21 & 0.245423 & 2.2493 & 0.013554 \tabularnewline
22 & 0.214451 & 1.9655 & 0.026332 \tabularnewline
23 & 0.183648 & 1.6832 & 0.048028 \tabularnewline
24 & 0.156211 & 1.4317 & 0.07797 \tabularnewline
25 & 0.13324 & 1.2212 & 0.11272 \tabularnewline
26 & 0.110198 & 1.01 & 0.157702 \tabularnewline
27 & 0.088937 & 0.8151 & 0.208655 \tabularnewline
28 & 0.067269 & 0.6165 & 0.269606 \tabularnewline
29 & 0.045435 & 0.4164 & 0.339083 \tabularnewline
30 & 0.023431 & 0.2148 & 0.415241 \tabularnewline
31 & 0.001481 & 0.0136 & 0.4946 \tabularnewline
32 & -0.020802 & -0.1907 & 0.424629 \tabularnewline
33 & -0.04214 & -0.3862 & 0.350155 \tabularnewline
34 & -0.064261 & -0.589 & 0.278734 \tabularnewline
35 & -0.08471 & -0.7764 & 0.219852 \tabularnewline
36 & -0.104984 & -0.9622 & 0.169356 \tabularnewline
37 & -0.123982 & -1.1363 & 0.129528 \tabularnewline
38 & -0.143023 & -1.3108 & 0.096745 \tabularnewline
39 & -0.160137 & -1.4677 & 0.072963 \tabularnewline
40 & -0.177063 & -1.6228 & 0.054188 \tabularnewline
41 & -0.194442 & -1.7821 & 0.039174 \tabularnewline
42 & -0.211115 & -1.9349 & 0.028184 \tabularnewline
43 & -0.227951 & -2.0892 & 0.019858 \tabularnewline
44 & -0.244264 & -2.2387 & 0.013909 \tabularnewline
45 & -0.260661 & -2.389 & 0.009567 \tabularnewline
46 & -0.276622 & -2.5353 & 0.006544 \tabularnewline
47 & -0.291045 & -2.6675 & 0.004584 \tabularnewline
48 & -0.304716 & -2.7928 & 0.003235 \tabularnewline
\hline
\end{tabular}
%Source: https://freestatistics.org/blog/index.php?pk=226166&T=1

[TABLE]
[ROW][C]Autocorrelation Function[/C][/ROW]
[ROW][C]Time lag k[/C][C]ACF(k)[/C][C]T-STAT[/C][C]P-value[/C][/ROW]
[ROW][C]1[/C][C]0.965305[/C][C]8.8472[/C][C]0[/C][/ROW]
[ROW][C]2[/C][C]0.9274[/C][C]8.4998[/C][C]0[/C][/ROW]
[ROW][C]3[/C][C]0.887758[/C][C]8.1364[/C][C]0[/C][/ROW]
[ROW][C]4[/C][C]0.849833[/C][C]7.7889[/C][C]0[/C][/ROW]
[ROW][C]5[/C][C]0.811306[/C][C]7.4357[/C][C]0[/C][/ROW]
[ROW][C]6[/C][C]0.773701[/C][C]7.0911[/C][C]0[/C][/ROW]
[ROW][C]7[/C][C]0.736137[/C][C]6.7468[/C][C]0[/C][/ROW]
[ROW][C]8[/C][C]0.698253[/C][C]6.3996[/C][C]0[/C][/ROW]
[ROW][C]9[/C][C]0.662147[/C][C]6.0687[/C][C]0[/C][/ROW]
[ROW][C]10[/C][C]0.625874[/C][C]5.7362[/C][C]0[/C][/ROW]
[ROW][C]11[/C][C]0.590118[/C][C]5.4085[/C][C]0[/C][/ROW]
[ROW][C]12[/C][C]0.552306[/C][C]5.062[/C][C]1e-06[/C][/ROW]
[ROW][C]13[/C][C]0.514674[/C][C]4.7171[/C][C]5e-06[/C][/ROW]
[ROW][C]14[/C][C]0.479773[/C][C]4.3972[/C][C]1.6e-05[/C][/ROW]
[ROW][C]15[/C][C]0.445038[/C][C]4.0788[/C][C]5.1e-05[/C][/ROW]
[ROW][C]16[/C][C]0.410448[/C][C]3.7618[/C][C]0.000156[/C][/ROW]
[ROW][C]17[/C][C]0.375759[/C][C]3.4439[/C][C]0.000448[/C][/ROW]
[ROW][C]18[/C][C]0.341983[/C][C]3.1343[/C][C]0.001186[/C][/ROW]
[ROW][C]19[/C][C]0.308969[/C][C]2.8317[/C][C]0.002896[/C][/ROW]
[ROW][C]20[/C][C]0.27647[/C][C]2.5339[/C][C]0.006569[/C][/ROW]
[ROW][C]21[/C][C]0.245423[/C][C]2.2493[/C][C]0.013554[/C][/ROW]
[ROW][C]22[/C][C]0.214451[/C][C]1.9655[/C][C]0.026332[/C][/ROW]
[ROW][C]23[/C][C]0.183648[/C][C]1.6832[/C][C]0.048028[/C][/ROW]
[ROW][C]24[/C][C]0.156211[/C][C]1.4317[/C][C]0.07797[/C][/ROW]
[ROW][C]25[/C][C]0.13324[/C][C]1.2212[/C][C]0.11272[/C][/ROW]
[ROW][C]26[/C][C]0.110198[/C][C]1.01[/C][C]0.157702[/C][/ROW]
[ROW][C]27[/C][C]0.088937[/C][C]0.8151[/C][C]0.208655[/C][/ROW]
[ROW][C]28[/C][C]0.067269[/C][C]0.6165[/C][C]0.269606[/C][/ROW]
[ROW][C]29[/C][C]0.045435[/C][C]0.4164[/C][C]0.339083[/C][/ROW]
[ROW][C]30[/C][C]0.023431[/C][C]0.2148[/C][C]0.415241[/C][/ROW]
[ROW][C]31[/C][C]0.001481[/C][C]0.0136[/C][C]0.4946[/C][/ROW]
[ROW][C]32[/C][C]-0.020802[/C][C]-0.1907[/C][C]0.424629[/C][/ROW]
[ROW][C]33[/C][C]-0.04214[/C][C]-0.3862[/C][C]0.350155[/C][/ROW]
[ROW][C]34[/C][C]-0.064261[/C][C]-0.589[/C][C]0.278734[/C][/ROW]
[ROW][C]35[/C][C]-0.08471[/C][C]-0.7764[/C][C]0.219852[/C][/ROW]
[ROW][C]36[/C][C]-0.104984[/C][C]-0.9622[/C][C]0.169356[/C][/ROW]
[ROW][C]37[/C][C]-0.123982[/C][C]-1.1363[/C][C]0.129528[/C][/ROW]
[ROW][C]38[/C][C]-0.143023[/C][C]-1.3108[/C][C]0.096745[/C][/ROW]
[ROW][C]39[/C][C]-0.160137[/C][C]-1.4677[/C][C]0.072963[/C][/ROW]
[ROW][C]40[/C][C]-0.177063[/C][C]-1.6228[/C][C]0.054188[/C][/ROW]
[ROW][C]41[/C][C]-0.194442[/C][C]-1.7821[/C][C]0.039174[/C][/ROW]
[ROW][C]42[/C][C]-0.211115[/C][C]-1.9349[/C][C]0.028184[/C][/ROW]
[ROW][C]43[/C][C]-0.227951[/C][C]-2.0892[/C][C]0.019858[/C][/ROW]
[ROW][C]44[/C][C]-0.244264[/C][C]-2.2387[/C][C]0.013909[/C][/ROW]
[ROW][C]45[/C][C]-0.260661[/C][C]-2.389[/C][C]0.009567[/C][/ROW]
[ROW][C]46[/C][C]-0.276622[/C][C]-2.5353[/C][C]0.006544[/C][/ROW]
[ROW][C]47[/C][C]-0.291045[/C][C]-2.6675[/C][C]0.004584[/C][/ROW]
[ROW][C]48[/C][C]-0.304716[/C][C]-2.7928[/C][C]0.003235[/C][/ROW]
[/TABLE]
Source: https://freestatistics.org/blog/index.php?pk=226166&T=1

Globally Unique Identifier (entire table): ba.freestatistics.org/blog/index.php?pk=226166&T=1

As an alternative you can also use a QR Code:  

The GUIDs for individual cells are displayed in the table below:

Autocorrelation Function
Time lag kACF(k)T-STATP-value
10.9653058.84720
20.92748.49980
30.8877588.13640
40.8498337.78890
50.8113067.43570
60.7737017.09110
70.7361376.74680
80.6982536.39960
90.6621476.06870
100.6258745.73620
110.5901185.40850
120.5523065.0621e-06
130.5146744.71715e-06
140.4797734.39721.6e-05
150.4450384.07885.1e-05
160.4104483.76180.000156
170.3757593.44390.000448
180.3419833.13430.001186
190.3089692.83170.002896
200.276472.53390.006569
210.2454232.24930.013554
220.2144511.96550.026332
230.1836481.68320.048028
240.1562111.43170.07797
250.133241.22120.11272
260.1101981.010.157702
270.0889370.81510.208655
280.0672690.61650.269606
290.0454350.41640.339083
300.0234310.21480.415241
310.0014810.01360.4946
32-0.020802-0.19070.424629
33-0.04214-0.38620.350155
34-0.064261-0.5890.278734
35-0.08471-0.77640.219852
36-0.104984-0.96220.169356
37-0.123982-1.13630.129528
38-0.143023-1.31080.096745
39-0.160137-1.46770.072963
40-0.177063-1.62280.054188
41-0.194442-1.78210.039174
42-0.211115-1.93490.028184
43-0.227951-2.08920.019858
44-0.244264-2.23870.013909
45-0.260661-2.3890.009567
46-0.276622-2.53530.006544
47-0.291045-2.66750.004584
48-0.304716-2.79280.003235


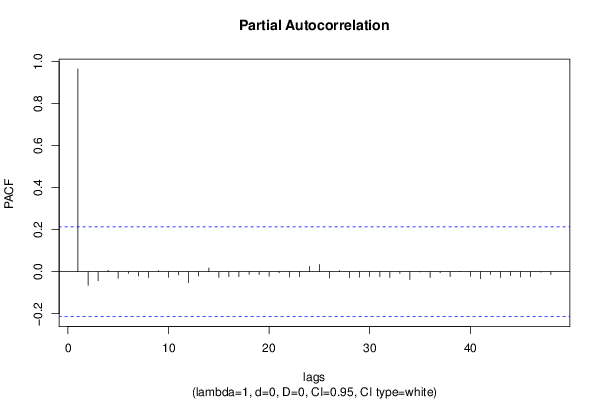
Partial Autocorrelation Function
Time lag kPACF(k)T-STATP-value
10.9653058.84720
2-0.064731-0.59330.277298
3-0.043131-0.39530.34681
40.0064540.05910.476487
5-0.031113-0.28520.388113
6-0.008073-0.0740.470595
7-0.020631-0.18910.425242
8-0.02759-0.25290.400494
90.0052210.04790.480973
10-0.026607-0.24390.403969
11-0.015773-0.14460.442702
12-0.051927-0.47590.317685
13-0.020275-0.18580.426515
140.0180140.16510.434632
15-0.026796-0.24560.4033
16-0.023327-0.21380.415614
17-0.024275-0.22250.412238
18-0.012824-0.11750.453357
19-0.013115-0.12020.452304
20-0.021217-0.19450.423144
21-0.004632-0.04250.483119
22-0.024549-0.2250.411263
23-0.023555-0.21590.414801
240.0252910.23180.408629
250.0342440.31390.377205
26-0.030117-0.2760.391601
270.0053010.04860.480682
28-0.028048-0.25710.398878
29-0.025795-0.23640.406843
30-0.02313-0.2120.416316
31-0.023705-0.21730.414267
32-0.027513-0.25220.400766
33-0.008017-0.07350.470799
34-0.03689-0.33810.368063
35-0.001658-0.01520.493954
36-0.02791-0.25580.399365
37-0.004825-0.04420.482418
38-0.022946-0.21030.416969
390.0007840.00720.497142
40-0.021775-0.19960.421151
41-0.033151-0.30380.381003
42-0.013044-0.11960.452562
43-0.02747-0.25180.40092
44-0.018873-0.1730.431544
45-0.024527-0.22480.411344
46-0.024323-0.22290.412068
47-0.001872-0.01720.493177
48-0.013531-0.1240.4508

\begin{tabular}{lllllllll}
\hline
Partial Autocorrelation Function \tabularnewline
Time lag k & PACF(k) & T-STAT & P-value \tabularnewline
1 & 0.965305 & 8.8472 & 0 \tabularnewline
2 & -0.064731 & -0.5933 & 0.277298 \tabularnewline
3 & -0.043131 & -0.3953 & 0.34681 \tabularnewline
4 & 0.006454 & 0.0591 & 0.476487 \tabularnewline
5 & -0.031113 & -0.2852 & 0.388113 \tabularnewline
6 & -0.008073 & -0.074 & 0.470595 \tabularnewline
7 & -0.020631 & -0.1891 & 0.425242 \tabularnewline
8 & -0.02759 & -0.2529 & 0.400494 \tabularnewline
9 & 0.005221 & 0.0479 & 0.480973 \tabularnewline
10 & -0.026607 & -0.2439 & 0.403969 \tabularnewline
11 & -0.015773 & -0.1446 & 0.442702 \tabularnewline
12 & -0.051927 & -0.4759 & 0.317685 \tabularnewline
13 & -0.020275 & -0.1858 & 0.426515 \tabularnewline
14 & 0.018014 & 0.1651 & 0.434632 \tabularnewline
15 & -0.026796 & -0.2456 & 0.4033 \tabularnewline
16 & -0.023327 & -0.2138 & 0.415614 \tabularnewline
17 & -0.024275 & -0.2225 & 0.412238 \tabularnewline
18 & -0.012824 & -0.1175 & 0.453357 \tabularnewline
19 & -0.013115 & -0.1202 & 0.452304 \tabularnewline
20 & -0.021217 & -0.1945 & 0.423144 \tabularnewline
21 & -0.004632 & -0.0425 & 0.483119 \tabularnewline
22 & -0.024549 & -0.225 & 0.411263 \tabularnewline
23 & -0.023555 & -0.2159 & 0.414801 \tabularnewline
24 & 0.025291 & 0.2318 & 0.408629 \tabularnewline
25 & 0.034244 & 0.3139 & 0.377205 \tabularnewline
26 & -0.030117 & -0.276 & 0.391601 \tabularnewline
27 & 0.005301 & 0.0486 & 0.480682 \tabularnewline
28 & -0.028048 & -0.2571 & 0.398878 \tabularnewline
29 & -0.025795 & -0.2364 & 0.406843 \tabularnewline
30 & -0.02313 & -0.212 & 0.416316 \tabularnewline
31 & -0.023705 & -0.2173 & 0.414267 \tabularnewline
32 & -0.027513 & -0.2522 & 0.400766 \tabularnewline
33 & -0.008017 & -0.0735 & 0.470799 \tabularnewline
34 & -0.03689 & -0.3381 & 0.368063 \tabularnewline
35 & -0.001658 & -0.0152 & 0.493954 \tabularnewline
36 & -0.02791 & -0.2558 & 0.399365 \tabularnewline
37 & -0.004825 & -0.0442 & 0.482418 \tabularnewline
38 & -0.022946 & -0.2103 & 0.416969 \tabularnewline
39 & 0.000784 & 0.0072 & 0.497142 \tabularnewline
40 & -0.021775 & -0.1996 & 0.421151 \tabularnewline
41 & -0.033151 & -0.3038 & 0.381003 \tabularnewline
42 & -0.013044 & -0.1196 & 0.452562 \tabularnewline
43 & -0.02747 & -0.2518 & 0.40092 \tabularnewline
44 & -0.018873 & -0.173 & 0.431544 \tabularnewline
45 & -0.024527 & -0.2248 & 0.411344 \tabularnewline
46 & -0.024323 & -0.2229 & 0.412068 \tabularnewline
47 & -0.001872 & -0.0172 & 0.493177 \tabularnewline
48 & -0.013531 & -0.124 & 0.4508 \tabularnewline
\hline
\end{tabular}
%Source: https://freestatistics.org/blog/index.php?pk=226166&T=2

[TABLE]
[ROW][C]Partial Autocorrelation Function[/C][/ROW]
[ROW][C]Time lag k[/C][C]PACF(k)[/C][C]T-STAT[/C][C]P-value[/C][/ROW]
[ROW][C]1[/C][C]0.965305[/C][C]8.8472[/C][C]0[/C][/ROW]
[ROW][C]2[/C][C]-0.064731[/C][C]-0.5933[/C][C]0.277298[/C][/ROW]
[ROW][C]3[/C][C]-0.043131[/C][C]-0.3953[/C][C]0.34681[/C][/ROW]
[ROW][C]4[/C][C]0.006454[/C][C]0.0591[/C][C]0.476487[/C][/ROW]
[ROW][C]5[/C][C]-0.031113[/C][C]-0.2852[/C][C]0.388113[/C][/ROW]
[ROW][C]6[/C][C]-0.008073[/C][C]-0.074[/C][C]0.470595[/C][/ROW]
[ROW][C]7[/C][C]-0.020631[/C][C]-0.1891[/C][C]0.425242[/C][/ROW]
[ROW][C]8[/C][C]-0.02759[/C][C]-0.2529[/C][C]0.400494[/C][/ROW]
[ROW][C]9[/C][C]0.005221[/C][C]0.0479[/C][C]0.480973[/C][/ROW]
[ROW][C]10[/C][C]-0.026607[/C][C]-0.2439[/C][C]0.403969[/C][/ROW]
[ROW][C]11[/C][C]-0.015773[/C][C]-0.1446[/C][C]0.442702[/C][/ROW]
[ROW][C]12[/C][C]-0.051927[/C][C]-0.4759[/C][C]0.317685[/C][/ROW]
[ROW][C]13[/C][C]-0.020275[/C][C]-0.1858[/C][C]0.426515[/C][/ROW]
[ROW][C]14[/C][C]0.018014[/C][C]0.1651[/C][C]0.434632[/C][/ROW]
[ROW][C]15[/C][C]-0.026796[/C][C]-0.2456[/C][C]0.4033[/C][/ROW]
[ROW][C]16[/C][C]-0.023327[/C][C]-0.2138[/C][C]0.415614[/C][/ROW]
[ROW][C]17[/C][C]-0.024275[/C][C]-0.2225[/C][C]0.412238[/C][/ROW]
[ROW][C]18[/C][C]-0.012824[/C][C]-0.1175[/C][C]0.453357[/C][/ROW]
[ROW][C]19[/C][C]-0.013115[/C][C]-0.1202[/C][C]0.452304[/C][/ROW]
[ROW][C]20[/C][C]-0.021217[/C][C]-0.1945[/C][C]0.423144[/C][/ROW]
[ROW][C]21[/C][C]-0.004632[/C][C]-0.0425[/C][C]0.483119[/C][/ROW]
[ROW][C]22[/C][C]-0.024549[/C][C]-0.225[/C][C]0.411263[/C][/ROW]
[ROW][C]23[/C][C]-0.023555[/C][C]-0.2159[/C][C]0.414801[/C][/ROW]
[ROW][C]24[/C][C]0.025291[/C][C]0.2318[/C][C]0.408629[/C][/ROW]
[ROW][C]25[/C][C]0.034244[/C][C]0.3139[/C][C]0.377205[/C][/ROW]
[ROW][C]26[/C][C]-0.030117[/C][C]-0.276[/C][C]0.391601[/C][/ROW]
[ROW][C]27[/C][C]0.005301[/C][C]0.0486[/C][C]0.480682[/C][/ROW]
[ROW][C]28[/C][C]-0.028048[/C][C]-0.2571[/C][C]0.398878[/C][/ROW]
[ROW][C]29[/C][C]-0.025795[/C][C]-0.2364[/C][C]0.406843[/C][/ROW]
[ROW][C]30[/C][C]-0.02313[/C][C]-0.212[/C][C]0.416316[/C][/ROW]
[ROW][C]31[/C][C]-0.023705[/C][C]-0.2173[/C][C]0.414267[/C][/ROW]
[ROW][C]32[/C][C]-0.027513[/C][C]-0.2522[/C][C]0.400766[/C][/ROW]
[ROW][C]33[/C][C]-0.008017[/C][C]-0.0735[/C][C]0.470799[/C][/ROW]
[ROW][C]34[/C][C]-0.03689[/C][C]-0.3381[/C][C]0.368063[/C][/ROW]
[ROW][C]35[/C][C]-0.001658[/C][C]-0.0152[/C][C]0.493954[/C][/ROW]
[ROW][C]36[/C][C]-0.02791[/C][C]-0.2558[/C][C]0.399365[/C][/ROW]
[ROW][C]37[/C][C]-0.004825[/C][C]-0.0442[/C][C]0.482418[/C][/ROW]
[ROW][C]38[/C][C]-0.022946[/C][C]-0.2103[/C][C]0.416969[/C][/ROW]
[ROW][C]39[/C][C]0.000784[/C][C]0.0072[/C][C]0.497142[/C][/ROW]
[ROW][C]40[/C][C]-0.021775[/C][C]-0.1996[/C][C]0.421151[/C][/ROW]
[ROW][C]41[/C][C]-0.033151[/C][C]-0.3038[/C][C]0.381003[/C][/ROW]
[ROW][C]42[/C][C]-0.013044[/C][C]-0.1196[/C][C]0.452562[/C][/ROW]
[ROW][C]43[/C][C]-0.02747[/C][C]-0.2518[/C][C]0.40092[/C][/ROW]
[ROW][C]44[/C][C]-0.018873[/C][C]-0.173[/C][C]0.431544[/C][/ROW]
[ROW][C]45[/C][C]-0.024527[/C][C]-0.2248[/C][C]0.411344[/C][/ROW]
[ROW][C]46[/C][C]-0.024323[/C][C]-0.2229[/C][C]0.412068[/C][/ROW]
[ROW][C]47[/C][C]-0.001872[/C][C]-0.0172[/C][C]0.493177[/C][/ROW]
[ROW][C]48[/C][C]-0.013531[/C][C]-0.124[/C][C]0.4508[/C][/ROW]
[/TABLE]
Source: https://freestatistics.org/blog/index.php?pk=226166&T=2

Globally Unique Identifier (entire table): ba.freestatistics.org/blog/index.php?pk=226166&T=2

As an alternative you can also use a QR Code:  

The GUIDs for individual cells are displayed in the table below:

Partial Autocorrelation Function
Time lag kPACF(k)T-STATP-value
10.9653058.84720
2-0.064731-0.59330.277298
3-0.043131-0.39530.34681
40.0064540.05910.476487
5-0.031113-0.28520.388113
6-0.008073-0.0740.470595
7-0.020631-0.18910.425242
8-0.02759-0.25290.400494
90.0052210.04790.480973
10-0.026607-0.24390.403969
11-0.015773-0.14460.442702
12-0.051927-0.47590.317685
13-0.020275-0.18580.426515
140.0180140.16510.434632
15-0.026796-0.24560.4033
16-0.023327-0.21380.415614
17-0.024275-0.22250.412238
18-0.012824-0.11750.453357
19-0.013115-0.12020.452304
20-0.021217-0.19450.423144
21-0.004632-0.04250.483119
22-0.024549-0.2250.411263
23-0.023555-0.21590.414801
240.0252910.23180.408629
250.0342440.31390.377205
26-0.030117-0.2760.391601
270.0053010.04860.480682
28-0.028048-0.25710.398878
29-0.025795-0.23640.406843
30-0.02313-0.2120.416316
31-0.023705-0.21730.414267
32-0.027513-0.25220.400766
33-0.008017-0.07350.470799
34-0.03689-0.33810.368063
35-0.001658-0.01520.493954
36-0.02791-0.25580.399365
37-0.004825-0.04420.482418
38-0.022946-0.21030.416969
390.0007840.00720.497142
40-0.021775-0.19960.421151
41-0.033151-0.30380.381003
42-0.013044-0.11960.452562
43-0.02747-0.25180.40092
44-0.018873-0.1730.431544
45-0.024527-0.22480.411344
46-0.024323-0.22290.412068
47-0.001872-0.01720.493177
48-0.013531-0.1240.4508


Parameters (Session):
par1 = 48 ; par2 = 1 ; par3 = 0 ; par4 = 0 ; par5 = 12 ; par6 = White Noise ; par7 = 0.95 ;
Parameters (R input):
par1 = 48 ; par2 = 1 ; par3 = 0 ; par4 = 0 ; par5 = 12 ; par6 = White Noise ; par7 = 0.95 ; par8 = ;
R code (references can be found in the software module):
if (par1 == 'Default') {
par1 = 10*log10(length(x))
} else {
par1 <- as.numeric(par1)
}
par2 <- as.numeric(par2)
par3 <- as.numeric(par3)
par4 <- as.numeric(par4)
par5 <- as.numeric(par5)
if (par6 == 'White Noise') par6 <- 'white' else par6 <- 'ma'
par7 <- as.numeric(par7)
if (par8 != '') par8 <- as.numeric(par8)
ox <- x
if (par8 == '') {
if (par2 == 0) {
x <- log(x)
} else {
x <- (x ^ par2 - 1) / par2
}
} else {
x <- log(x,base=par8)
}
if (par3 > 0) x <- diff(x,lag=1,difference=par3)
if (par4 > 0) x <- diff(x,lag=par5,difference=par4)
bitmap(file='picts.png')
op <- par(mfrow=c(2,1))
plot(ox,type='l',main='Original Time Series',xlab='time',ylab='value')
if (par8=='') {
mytitle <- paste('Working Time Series (lambda=',par2,', d=',par3,', D=',par4,')',sep='')
mysub <- paste('(lambda=',par2,', d=',par3,', D=',par4,', CI=', par7, ', CI type=',par6,')',sep='')
} else {
mytitle <- paste('Working Time Series (base=',par8,', d=',par3,', D=',par4,')',sep='')
mysub <- paste('(base=',par8,', d=',par3,', D=',par4,', CI=', par7, ', CI type=',par6,')',sep='')
}
plot(x,type='l', main=mytitle,xlab='time',ylab='value')
par(op)
dev.off()
bitmap(file='pic1.png')
racf <- acf(x, par1, main='Autocorrelation', xlab='time lag', ylab='ACF', ci.type=par6, ci=par7, sub=mysub)
dev.off()
bitmap(file='pic2.png')
rpacf <- pacf(x,par1,main='Partial Autocorrelation',xlab='lags',ylab='PACF',sub=mysub)
dev.off()
(myacf <- c(racf$acf))
(mypacf <- c(rpacf$acf))
lengthx <- length(x)
sqrtn <- sqrt(lengthx)
load(file='createtable')
a<-table.start()
a<-table.row.start(a)
a<-table.element(a,'Autocorrelation Function',4,TRUE)
a<-table.row.end(a)
a<-table.row.start(a)
a<-table.element(a,'Time lag k',header=TRUE)
a<-table.element(a,hyperlink('basics.htm','ACF(k)','click here for more information about the Autocorrelation Function'),header=TRUE)
a<-table.element(a,'T-STAT',header=TRUE)
a<-table.element(a,'P-value',header=TRUE)
a<-table.row.end(a)
for (i in 2:(par1+1)) {
a<-table.row.start(a)
a<-table.element(a,i-1,header=TRUE)
a<-table.element(a,round(myacf[i],6))
mytstat <- myacf[i]*sqrtn
a<-table.element(a,round(mytstat,4))
a<-table.element(a,round(1-pt(abs(mytstat),lengthx),6))
a<-table.row.end(a)
}
a<-table.end(a)
table.save(a,file='mytable.tab')
a<-table.start()
a<-table.row.start(a)
a<-table.element(a,'Partial Autocorrelation Function',4,TRUE)
a<-table.row.end(a)
a<-table.row.start(a)
a<-table.element(a,'Time lag k',header=TRUE)
a<-table.element(a,hyperlink('basics.htm','PACF(k)','click here for more information about the Partial Autocorrelation Function'),header=TRUE)
a<-table.element(a,'T-STAT',header=TRUE)
a<-table.element(a,'P-value',header=TRUE)
a<-table.row.end(a)
for (i in 1:par1) {
a<-table.row.start(a)
a<-table.element(a,i,header=TRUE)
a<-table.element(a,round(mypacf[i],6))
mytstat <- mypacf[i]*sqrtn
a<-table.element(a,round(mytstat,4))
a<-table.element(a,round(1-pt(abs(mytstat),lengthx),6))
a<-table.row.end(a)
}
a<-table.end(a)
table.save(a,file='mytable1.tab')