Free Statistics

of Irreproducible Research!

Author's title

Author*Unverified author*
R Software Modulerwasp_autocorrelation.wasp
Title produced by software(Partial) Autocorrelation Function
Date of computationMon, 18 Nov 2013 12:01:32 -0500
Cite this page as followsStatistical Computations at FreeStatistics.org, Office for Research Development and Education, URL https://freestatistics.org/blog/index.php?v=date/2013/Nov/18/t1384795321d9fx5kodyj4947l.htm/, Retrieved Sat, 27 Apr 2024 06:47:53 +0000
Statistical Computations at FreeStatistics.org, Office for Research Development and Education, URL https://freestatistics.org/blog/index.php?pk=226178, Retrieved Sat, 27 Apr 2024 06:47:53 +0000
QR Codes:

Original text written by user:
IsPrivate?No (this computation is public)
User-defined keywords
Estimated Impact72
Family? (F = Feedback message, R = changed R code, M = changed R Module, P = changed Parameters, D = changed Data)
-     [(Partial) Autocorrelation Function] [] [2013-11-18 09:06:48] [4137616dc99e71bd0abe7ac75f4ed0c6]
- R  D  [(Partial) Autocorrelation Function] [] [2013-11-18 16:50:21] [4137616dc99e71bd0abe7ac75f4ed0c6]
- R PD      [(Partial) Autocorrelation Function] [] [2013-11-18 17:01:32] [548ba37af61861f215c3470847960b18] [Current]
Feedback Forum

Post a new message
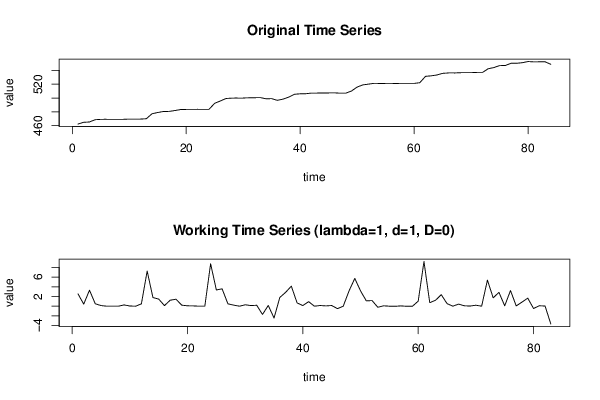
Dataseries X:
462.23
464.79
465.22
468.52
469.02
469.15
469.15
469.15
469.15
469.41
469.45
469.45
469.93
477.19
478.97
480.44
480.56
481.8
483.24
483.45
483.53
483.59
483.59
483.59
492.36
495.71
499.29
499.78
500
500
500.29
500.42
500.61
498.9
499.06
496.61
498.41
501.26
505.4
506.07
506.2
507.14
507.14
507.28
507.34
507.48
506.97
506.97
510.1
515.84
519
520.1
521.26
521.04
521.12
521.12
521.1
521.16
521.14
521.13
522.17
531.39
532.12
533.34
535.72
536.25
536.25
536.68
536.76
536.79
536.99
536.99
542.38
544.1
546.96
547.04
550.27
550.32
551.17
552.83
552.35
552.44
552.47
548.78


Summary of computational transaction
Raw Inputview raw input (R code)
Raw Outputview raw output of R engine
Computing time3 seconds
R Server'Sir Maurice George Kendall' @ kendall.wessa.net

\begin{tabular}{lllllllll}
\hline
Summary of computational transaction \tabularnewline
Raw Input & view raw input (R code)  \tabularnewline
Raw Output & view raw output of R engine  \tabularnewline
Computing time & 3 seconds \tabularnewline
R Server & 'Sir Maurice George Kendall' @ kendall.wessa.net \tabularnewline
\hline
\end{tabular}
%Source: https://freestatistics.org/blog/index.php?pk=226178&T=0

[TABLE]
[ROW][C]Summary of computational transaction[/C][/ROW]
[ROW][C]Raw Input[/C][C]view raw input (R code) [/C][/ROW]
[ROW][C]Raw Output[/C][C]view raw output of R engine [/C][/ROW]
[ROW][C]Computing time[/C][C]3 seconds[/C][/ROW]
[ROW][C]R Server[/C][C]'Sir Maurice George Kendall' @ kendall.wessa.net[/C][/ROW]
[/TABLE]
Source: https://freestatistics.org/blog/index.php?pk=226178&T=0

Globally Unique Identifier (entire table): ba.freestatistics.org/blog/index.php?pk=226178&T=0

As an alternative you can also use a QR Code:  

The GUIDs for individual cells are displayed in the table below:

Summary of computational transaction
Raw Inputview raw input (R code)
Raw Outputview raw output of R engine
Computing time3 seconds
R Server'Sir Maurice George Kendall' @ kendall.wessa.net


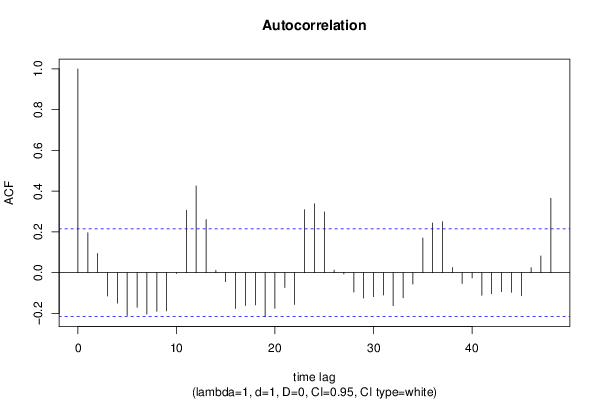
Autocorrelation Function
Time lag kACF(k)T-STATP-value
10.1963341.78870.038657
20.0942150.85830.19659
3-0.114288-1.04120.150399
4-0.149634-1.36320.088248
5-0.210115-1.91420.029518
6-0.169698-1.5460.062951
7-0.203458-1.85360.033675
8-0.189242-1.72410.044209
9-0.187738-1.71040.045466
10-0.004585-0.04180.48339
110.306152.78920.003276
120.4255383.87680.000105
130.2605412.37360.009961
140.011760.10710.45747
15-0.044051-0.40130.344606
16-0.175982-1.60330.056337
17-0.161449-1.47090.072554
18-0.158192-1.44120.076646
19-0.216005-1.96790.026209
20-0.174693-1.59150.057647
21-0.07326-0.66740.253176
22-0.156049-1.42170.079434
230.3084852.81040.003085
240.3383293.08230.001394
250.2976022.71130.004072
260.0124790.11370.454879
27-0.006256-0.0570.477342
28-0.09539-0.8690.193665
29-0.124485-1.13410.130006
30-0.117789-1.07310.143167
31-0.110203-1.0040.159148
32-0.161794-1.4740.072131
33-0.123436-1.12460.13201
34-0.055641-0.50690.306778
350.1703651.55210.062222
360.2437992.22110.014533
370.2496642.27450.012756
380.0250070.22780.410172
39-0.053647-0.48870.313156
40-0.025691-0.23410.407758
41-0.110623-1.00780.158234
42-0.103127-0.93950.175091
43-0.093298-0.850.19889
44-0.096265-0.8770.191504
45-0.113211-1.03140.152674
460.0243310.22170.41256
470.0821010.7480.228294
480.3651443.32660.000656

\begin{tabular}{lllllllll}
\hline
Autocorrelation Function \tabularnewline
Time lag k & ACF(k) & T-STAT & P-value \tabularnewline
1 & 0.196334 & 1.7887 & 0.038657 \tabularnewline
2 & 0.094215 & 0.8583 & 0.19659 \tabularnewline
3 & -0.114288 & -1.0412 & 0.150399 \tabularnewline
4 & -0.149634 & -1.3632 & 0.088248 \tabularnewline
5 & -0.210115 & -1.9142 & 0.029518 \tabularnewline
6 & -0.169698 & -1.546 & 0.062951 \tabularnewline
7 & -0.203458 & -1.8536 & 0.033675 \tabularnewline
8 & -0.189242 & -1.7241 & 0.044209 \tabularnewline
9 & -0.187738 & -1.7104 & 0.045466 \tabularnewline
10 & -0.004585 & -0.0418 & 0.48339 \tabularnewline
11 & 0.30615 & 2.7892 & 0.003276 \tabularnewline
12 & 0.425538 & 3.8768 & 0.000105 \tabularnewline
13 & 0.260541 & 2.3736 & 0.009961 \tabularnewline
14 & 0.01176 & 0.1071 & 0.45747 \tabularnewline
15 & -0.044051 & -0.4013 & 0.344606 \tabularnewline
16 & -0.175982 & -1.6033 & 0.056337 \tabularnewline
17 & -0.161449 & -1.4709 & 0.072554 \tabularnewline
18 & -0.158192 & -1.4412 & 0.076646 \tabularnewline
19 & -0.216005 & -1.9679 & 0.026209 \tabularnewline
20 & -0.174693 & -1.5915 & 0.057647 \tabularnewline
21 & -0.07326 & -0.6674 & 0.253176 \tabularnewline
22 & -0.156049 & -1.4217 & 0.079434 \tabularnewline
23 & 0.308485 & 2.8104 & 0.003085 \tabularnewline
24 & 0.338329 & 3.0823 & 0.001394 \tabularnewline
25 & 0.297602 & 2.7113 & 0.004072 \tabularnewline
26 & 0.012479 & 0.1137 & 0.454879 \tabularnewline
27 & -0.006256 & -0.057 & 0.477342 \tabularnewline
28 & -0.09539 & -0.869 & 0.193665 \tabularnewline
29 & -0.124485 & -1.1341 & 0.130006 \tabularnewline
30 & -0.117789 & -1.0731 & 0.143167 \tabularnewline
31 & -0.110203 & -1.004 & 0.159148 \tabularnewline
32 & -0.161794 & -1.474 & 0.072131 \tabularnewline
33 & -0.123436 & -1.1246 & 0.13201 \tabularnewline
34 & -0.055641 & -0.5069 & 0.306778 \tabularnewline
35 & 0.170365 & 1.5521 & 0.062222 \tabularnewline
36 & 0.243799 & 2.2211 & 0.014533 \tabularnewline
37 & 0.249664 & 2.2745 & 0.012756 \tabularnewline
38 & 0.025007 & 0.2278 & 0.410172 \tabularnewline
39 & -0.053647 & -0.4887 & 0.313156 \tabularnewline
40 & -0.025691 & -0.2341 & 0.407758 \tabularnewline
41 & -0.110623 & -1.0078 & 0.158234 \tabularnewline
42 & -0.103127 & -0.9395 & 0.175091 \tabularnewline
43 & -0.093298 & -0.85 & 0.19889 \tabularnewline
44 & -0.096265 & -0.877 & 0.191504 \tabularnewline
45 & -0.113211 & -1.0314 & 0.152674 \tabularnewline
46 & 0.024331 & 0.2217 & 0.41256 \tabularnewline
47 & 0.082101 & 0.748 & 0.228294 \tabularnewline
48 & 0.365144 & 3.3266 & 0.000656 \tabularnewline
\hline
\end{tabular}
%Source: https://freestatistics.org/blog/index.php?pk=226178&T=1

[TABLE]
[ROW][C]Autocorrelation Function[/C][/ROW]
[ROW][C]Time lag k[/C][C]ACF(k)[/C][C]T-STAT[/C][C]P-value[/C][/ROW]
[ROW][C]1[/C][C]0.196334[/C][C]1.7887[/C][C]0.038657[/C][/ROW]
[ROW][C]2[/C][C]0.094215[/C][C]0.8583[/C][C]0.19659[/C][/ROW]
[ROW][C]3[/C][C]-0.114288[/C][C]-1.0412[/C][C]0.150399[/C][/ROW]
[ROW][C]4[/C][C]-0.149634[/C][C]-1.3632[/C][C]0.088248[/C][/ROW]
[ROW][C]5[/C][C]-0.210115[/C][C]-1.9142[/C][C]0.029518[/C][/ROW]
[ROW][C]6[/C][C]-0.169698[/C][C]-1.546[/C][C]0.062951[/C][/ROW]
[ROW][C]7[/C][C]-0.203458[/C][C]-1.8536[/C][C]0.033675[/C][/ROW]
[ROW][C]8[/C][C]-0.189242[/C][C]-1.7241[/C][C]0.044209[/C][/ROW]
[ROW][C]9[/C][C]-0.187738[/C][C]-1.7104[/C][C]0.045466[/C][/ROW]
[ROW][C]10[/C][C]-0.004585[/C][C]-0.0418[/C][C]0.48339[/C][/ROW]
[ROW][C]11[/C][C]0.30615[/C][C]2.7892[/C][C]0.003276[/C][/ROW]
[ROW][C]12[/C][C]0.425538[/C][C]3.8768[/C][C]0.000105[/C][/ROW]
[ROW][C]13[/C][C]0.260541[/C][C]2.3736[/C][C]0.009961[/C][/ROW]
[ROW][C]14[/C][C]0.01176[/C][C]0.1071[/C][C]0.45747[/C][/ROW]
[ROW][C]15[/C][C]-0.044051[/C][C]-0.4013[/C][C]0.344606[/C][/ROW]
[ROW][C]16[/C][C]-0.175982[/C][C]-1.6033[/C][C]0.056337[/C][/ROW]
[ROW][C]17[/C][C]-0.161449[/C][C]-1.4709[/C][C]0.072554[/C][/ROW]
[ROW][C]18[/C][C]-0.158192[/C][C]-1.4412[/C][C]0.076646[/C][/ROW]
[ROW][C]19[/C][C]-0.216005[/C][C]-1.9679[/C][C]0.026209[/C][/ROW]
[ROW][C]20[/C][C]-0.174693[/C][C]-1.5915[/C][C]0.057647[/C][/ROW]
[ROW][C]21[/C][C]-0.07326[/C][C]-0.6674[/C][C]0.253176[/C][/ROW]
[ROW][C]22[/C][C]-0.156049[/C][C]-1.4217[/C][C]0.079434[/C][/ROW]
[ROW][C]23[/C][C]0.308485[/C][C]2.8104[/C][C]0.003085[/C][/ROW]
[ROW][C]24[/C][C]0.338329[/C][C]3.0823[/C][C]0.001394[/C][/ROW]
[ROW][C]25[/C][C]0.297602[/C][C]2.7113[/C][C]0.004072[/C][/ROW]
[ROW][C]26[/C][C]0.012479[/C][C]0.1137[/C][C]0.454879[/C][/ROW]
[ROW][C]27[/C][C]-0.006256[/C][C]-0.057[/C][C]0.477342[/C][/ROW]
[ROW][C]28[/C][C]-0.09539[/C][C]-0.869[/C][C]0.193665[/C][/ROW]
[ROW][C]29[/C][C]-0.124485[/C][C]-1.1341[/C][C]0.130006[/C][/ROW]
[ROW][C]30[/C][C]-0.117789[/C][C]-1.0731[/C][C]0.143167[/C][/ROW]
[ROW][C]31[/C][C]-0.110203[/C][C]-1.004[/C][C]0.159148[/C][/ROW]
[ROW][C]32[/C][C]-0.161794[/C][C]-1.474[/C][C]0.072131[/C][/ROW]
[ROW][C]33[/C][C]-0.123436[/C][C]-1.1246[/C][C]0.13201[/C][/ROW]
[ROW][C]34[/C][C]-0.055641[/C][C]-0.5069[/C][C]0.306778[/C][/ROW]
[ROW][C]35[/C][C]0.170365[/C][C]1.5521[/C][C]0.062222[/C][/ROW]
[ROW][C]36[/C][C]0.243799[/C][C]2.2211[/C][C]0.014533[/C][/ROW]
[ROW][C]37[/C][C]0.249664[/C][C]2.2745[/C][C]0.012756[/C][/ROW]
[ROW][C]38[/C][C]0.025007[/C][C]0.2278[/C][C]0.410172[/C][/ROW]
[ROW][C]39[/C][C]-0.053647[/C][C]-0.4887[/C][C]0.313156[/C][/ROW]
[ROW][C]40[/C][C]-0.025691[/C][C]-0.2341[/C][C]0.407758[/C][/ROW]
[ROW][C]41[/C][C]-0.110623[/C][C]-1.0078[/C][C]0.158234[/C][/ROW]
[ROW][C]42[/C][C]-0.103127[/C][C]-0.9395[/C][C]0.175091[/C][/ROW]
[ROW][C]43[/C][C]-0.093298[/C][C]-0.85[/C][C]0.19889[/C][/ROW]
[ROW][C]44[/C][C]-0.096265[/C][C]-0.877[/C][C]0.191504[/C][/ROW]
[ROW][C]45[/C][C]-0.113211[/C][C]-1.0314[/C][C]0.152674[/C][/ROW]
[ROW][C]46[/C][C]0.024331[/C][C]0.2217[/C][C]0.41256[/C][/ROW]
[ROW][C]47[/C][C]0.082101[/C][C]0.748[/C][C]0.228294[/C][/ROW]
[ROW][C]48[/C][C]0.365144[/C][C]3.3266[/C][C]0.000656[/C][/ROW]
[/TABLE]
Source: https://freestatistics.org/blog/index.php?pk=226178&T=1

Globally Unique Identifier (entire table): ba.freestatistics.org/blog/index.php?pk=226178&T=1

As an alternative you can also use a QR Code:  

The GUIDs for individual cells are displayed in the table below:

Autocorrelation Function
Time lag kACF(k)T-STATP-value
10.1963341.78870.038657
20.0942150.85830.19659
3-0.114288-1.04120.150399
4-0.149634-1.36320.088248
5-0.210115-1.91420.029518
6-0.169698-1.5460.062951
7-0.203458-1.85360.033675
8-0.189242-1.72410.044209
9-0.187738-1.71040.045466
10-0.004585-0.04180.48339
110.306152.78920.003276
120.4255383.87680.000105
130.2605412.37360.009961
140.011760.10710.45747
15-0.044051-0.40130.344606
16-0.175982-1.60330.056337
17-0.161449-1.47090.072554
18-0.158192-1.44120.076646
19-0.216005-1.96790.026209
20-0.174693-1.59150.057647
21-0.07326-0.66740.253176
22-0.156049-1.42170.079434
230.3084852.81040.003085
240.3383293.08230.001394
250.2976022.71130.004072
260.0124790.11370.454879
27-0.006256-0.0570.477342
28-0.09539-0.8690.193665
29-0.124485-1.13410.130006
30-0.117789-1.07310.143167
31-0.110203-1.0040.159148
32-0.161794-1.4740.072131
33-0.123436-1.12460.13201
34-0.055641-0.50690.306778
350.1703651.55210.062222
360.2437992.22110.014533
370.2496642.27450.012756
380.0250070.22780.410172
39-0.053647-0.48870.313156
40-0.025691-0.23410.407758
41-0.110623-1.00780.158234
42-0.103127-0.93950.175091
43-0.093298-0.850.19889
44-0.096265-0.8770.191504
45-0.113211-1.03140.152674
460.0243310.22170.41256
470.0821010.7480.228294
480.3651443.32660.000656


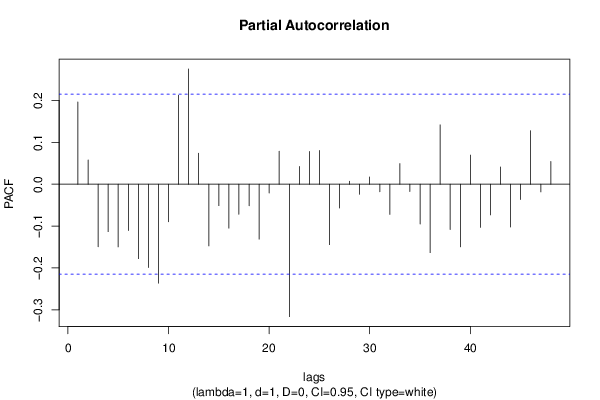
Partial Autocorrelation Function
Time lag kPACF(k)T-STATP-value
10.1963341.78870.038657
20.0578990.52750.299631
3-0.14932-1.36040.088698
4-0.113407-1.03320.152259
5-0.149793-1.36470.088021
6-0.110697-1.00850.158073
7-0.177815-1.620.054516
8-0.198962-1.81260.036753
9-0.236413-2.15380.017077
10-0.089548-0.81580.208468
110.2126651.93750.028045
120.2753632.50870.007032
130.0741180.67520.250698
14-0.147402-1.34290.091483
15-0.051194-0.46640.321077
16-0.104947-0.95610.170895
17-0.071972-0.65570.256915
18-0.051401-0.46830.320405
19-0.131309-1.19630.117496
20-0.021092-0.19220.424045
210.0785710.71580.238057
22-0.316461-2.88310.002507
230.0424130.38640.350093
240.0782990.71330.238819
250.0803510.7320.233105
26-0.144429-1.31580.095931
27-0.056953-0.51890.302618
280.0072550.06610.473729
29-0.024049-0.21910.413556
300.0170280.15510.438545
31-0.018107-0.1650.434688
32-0.072189-0.65770.256285
330.0492710.44890.327344
34-0.017637-0.16070.436369
35-0.094975-0.86530.194695
36-0.163573-1.49020.069979
370.1418011.29190.099993
38-0.108116-0.9850.163747
39-0.149677-1.36360.088187
400.069490.63310.264209
41-0.103251-0.94070.174804
42-0.073353-0.66830.252906
430.0410110.37360.354817
44-0.102402-0.93290.176782
45-0.036625-0.33370.369735
460.1278591.16490.123708
47-0.018307-0.16680.433974
480.0540620.49250.311825

\begin{tabular}{lllllllll}
\hline
Partial Autocorrelation Function \tabularnewline
Time lag k & PACF(k) & T-STAT & P-value \tabularnewline
1 & 0.196334 & 1.7887 & 0.038657 \tabularnewline
2 & 0.057899 & 0.5275 & 0.299631 \tabularnewline
3 & -0.14932 & -1.3604 & 0.088698 \tabularnewline
4 & -0.113407 & -1.0332 & 0.152259 \tabularnewline
5 & -0.149793 & -1.3647 & 0.088021 \tabularnewline
6 & -0.110697 & -1.0085 & 0.158073 \tabularnewline
7 & -0.177815 & -1.62 & 0.054516 \tabularnewline
8 & -0.198962 & -1.8126 & 0.036753 \tabularnewline
9 & -0.236413 & -2.1538 & 0.017077 \tabularnewline
10 & -0.089548 & -0.8158 & 0.208468 \tabularnewline
11 & 0.212665 & 1.9375 & 0.028045 \tabularnewline
12 & 0.275363 & 2.5087 & 0.007032 \tabularnewline
13 & 0.074118 & 0.6752 & 0.250698 \tabularnewline
14 & -0.147402 & -1.3429 & 0.091483 \tabularnewline
15 & -0.051194 & -0.4664 & 0.321077 \tabularnewline
16 & -0.104947 & -0.9561 & 0.170895 \tabularnewline
17 & -0.071972 & -0.6557 & 0.256915 \tabularnewline
18 & -0.051401 & -0.4683 & 0.320405 \tabularnewline
19 & -0.131309 & -1.1963 & 0.117496 \tabularnewline
20 & -0.021092 & -0.1922 & 0.424045 \tabularnewline
21 & 0.078571 & 0.7158 & 0.238057 \tabularnewline
22 & -0.316461 & -2.8831 & 0.002507 \tabularnewline
23 & 0.042413 & 0.3864 & 0.350093 \tabularnewline
24 & 0.078299 & 0.7133 & 0.238819 \tabularnewline
25 & 0.080351 & 0.732 & 0.233105 \tabularnewline
26 & -0.144429 & -1.3158 & 0.095931 \tabularnewline
27 & -0.056953 & -0.5189 & 0.302618 \tabularnewline
28 & 0.007255 & 0.0661 & 0.473729 \tabularnewline
29 & -0.024049 & -0.2191 & 0.413556 \tabularnewline
30 & 0.017028 & 0.1551 & 0.438545 \tabularnewline
31 & -0.018107 & -0.165 & 0.434688 \tabularnewline
32 & -0.072189 & -0.6577 & 0.256285 \tabularnewline
33 & 0.049271 & 0.4489 & 0.327344 \tabularnewline
34 & -0.017637 & -0.1607 & 0.436369 \tabularnewline
35 & -0.094975 & -0.8653 & 0.194695 \tabularnewline
36 & -0.163573 & -1.4902 & 0.069979 \tabularnewline
37 & 0.141801 & 1.2919 & 0.099993 \tabularnewline
38 & -0.108116 & -0.985 & 0.163747 \tabularnewline
39 & -0.149677 & -1.3636 & 0.088187 \tabularnewline
40 & 0.06949 & 0.6331 & 0.264209 \tabularnewline
41 & -0.103251 & -0.9407 & 0.174804 \tabularnewline
42 & -0.073353 & -0.6683 & 0.252906 \tabularnewline
43 & 0.041011 & 0.3736 & 0.354817 \tabularnewline
44 & -0.102402 & -0.9329 & 0.176782 \tabularnewline
45 & -0.036625 & -0.3337 & 0.369735 \tabularnewline
46 & 0.127859 & 1.1649 & 0.123708 \tabularnewline
47 & -0.018307 & -0.1668 & 0.433974 \tabularnewline
48 & 0.054062 & 0.4925 & 0.311825 \tabularnewline
\hline
\end{tabular}
%Source: https://freestatistics.org/blog/index.php?pk=226178&T=2

[TABLE]
[ROW][C]Partial Autocorrelation Function[/C][/ROW]
[ROW][C]Time lag k[/C][C]PACF(k)[/C][C]T-STAT[/C][C]P-value[/C][/ROW]
[ROW][C]1[/C][C]0.196334[/C][C]1.7887[/C][C]0.038657[/C][/ROW]
[ROW][C]2[/C][C]0.057899[/C][C]0.5275[/C][C]0.299631[/C][/ROW]
[ROW][C]3[/C][C]-0.14932[/C][C]-1.3604[/C][C]0.088698[/C][/ROW]
[ROW][C]4[/C][C]-0.113407[/C][C]-1.0332[/C][C]0.152259[/C][/ROW]
[ROW][C]5[/C][C]-0.149793[/C][C]-1.3647[/C][C]0.088021[/C][/ROW]
[ROW][C]6[/C][C]-0.110697[/C][C]-1.0085[/C][C]0.158073[/C][/ROW]
[ROW][C]7[/C][C]-0.177815[/C][C]-1.62[/C][C]0.054516[/C][/ROW]
[ROW][C]8[/C][C]-0.198962[/C][C]-1.8126[/C][C]0.036753[/C][/ROW]
[ROW][C]9[/C][C]-0.236413[/C][C]-2.1538[/C][C]0.017077[/C][/ROW]
[ROW][C]10[/C][C]-0.089548[/C][C]-0.8158[/C][C]0.208468[/C][/ROW]
[ROW][C]11[/C][C]0.212665[/C][C]1.9375[/C][C]0.028045[/C][/ROW]
[ROW][C]12[/C][C]0.275363[/C][C]2.5087[/C][C]0.007032[/C][/ROW]
[ROW][C]13[/C][C]0.074118[/C][C]0.6752[/C][C]0.250698[/C][/ROW]
[ROW][C]14[/C][C]-0.147402[/C][C]-1.3429[/C][C]0.091483[/C][/ROW]
[ROW][C]15[/C][C]-0.051194[/C][C]-0.4664[/C][C]0.321077[/C][/ROW]
[ROW][C]16[/C][C]-0.104947[/C][C]-0.9561[/C][C]0.170895[/C][/ROW]
[ROW][C]17[/C][C]-0.071972[/C][C]-0.6557[/C][C]0.256915[/C][/ROW]
[ROW][C]18[/C][C]-0.051401[/C][C]-0.4683[/C][C]0.320405[/C][/ROW]
[ROW][C]19[/C][C]-0.131309[/C][C]-1.1963[/C][C]0.117496[/C][/ROW]
[ROW][C]20[/C][C]-0.021092[/C][C]-0.1922[/C][C]0.424045[/C][/ROW]
[ROW][C]21[/C][C]0.078571[/C][C]0.7158[/C][C]0.238057[/C][/ROW]
[ROW][C]22[/C][C]-0.316461[/C][C]-2.8831[/C][C]0.002507[/C][/ROW]
[ROW][C]23[/C][C]0.042413[/C][C]0.3864[/C][C]0.350093[/C][/ROW]
[ROW][C]24[/C][C]0.078299[/C][C]0.7133[/C][C]0.238819[/C][/ROW]
[ROW][C]25[/C][C]0.080351[/C][C]0.732[/C][C]0.233105[/C][/ROW]
[ROW][C]26[/C][C]-0.144429[/C][C]-1.3158[/C][C]0.095931[/C][/ROW]
[ROW][C]27[/C][C]-0.056953[/C][C]-0.5189[/C][C]0.302618[/C][/ROW]
[ROW][C]28[/C][C]0.007255[/C][C]0.0661[/C][C]0.473729[/C][/ROW]
[ROW][C]29[/C][C]-0.024049[/C][C]-0.2191[/C][C]0.413556[/C][/ROW]
[ROW][C]30[/C][C]0.017028[/C][C]0.1551[/C][C]0.438545[/C][/ROW]
[ROW][C]31[/C][C]-0.018107[/C][C]-0.165[/C][C]0.434688[/C][/ROW]
[ROW][C]32[/C][C]-0.072189[/C][C]-0.6577[/C][C]0.256285[/C][/ROW]
[ROW][C]33[/C][C]0.049271[/C][C]0.4489[/C][C]0.327344[/C][/ROW]
[ROW][C]34[/C][C]-0.017637[/C][C]-0.1607[/C][C]0.436369[/C][/ROW]
[ROW][C]35[/C][C]-0.094975[/C][C]-0.8653[/C][C]0.194695[/C][/ROW]
[ROW][C]36[/C][C]-0.163573[/C][C]-1.4902[/C][C]0.069979[/C][/ROW]
[ROW][C]37[/C][C]0.141801[/C][C]1.2919[/C][C]0.099993[/C][/ROW]
[ROW][C]38[/C][C]-0.108116[/C][C]-0.985[/C][C]0.163747[/C][/ROW]
[ROW][C]39[/C][C]-0.149677[/C][C]-1.3636[/C][C]0.088187[/C][/ROW]
[ROW][C]40[/C][C]0.06949[/C][C]0.6331[/C][C]0.264209[/C][/ROW]
[ROW][C]41[/C][C]-0.103251[/C][C]-0.9407[/C][C]0.174804[/C][/ROW]
[ROW][C]42[/C][C]-0.073353[/C][C]-0.6683[/C][C]0.252906[/C][/ROW]
[ROW][C]43[/C][C]0.041011[/C][C]0.3736[/C][C]0.354817[/C][/ROW]
[ROW][C]44[/C][C]-0.102402[/C][C]-0.9329[/C][C]0.176782[/C][/ROW]
[ROW][C]45[/C][C]-0.036625[/C][C]-0.3337[/C][C]0.369735[/C][/ROW]
[ROW][C]46[/C][C]0.127859[/C][C]1.1649[/C][C]0.123708[/C][/ROW]
[ROW][C]47[/C][C]-0.018307[/C][C]-0.1668[/C][C]0.433974[/C][/ROW]
[ROW][C]48[/C][C]0.054062[/C][C]0.4925[/C][C]0.311825[/C][/ROW]
[/TABLE]
Source: https://freestatistics.org/blog/index.php?pk=226178&T=2

Globally Unique Identifier (entire table): ba.freestatistics.org/blog/index.php?pk=226178&T=2

As an alternative you can also use a QR Code:  

The GUIDs for individual cells are displayed in the table below:

Partial Autocorrelation Function
Time lag kPACF(k)T-STATP-value
10.1963341.78870.038657
20.0578990.52750.299631
3-0.14932-1.36040.088698
4-0.113407-1.03320.152259
5-0.149793-1.36470.088021
6-0.110697-1.00850.158073
7-0.177815-1.620.054516
8-0.198962-1.81260.036753
9-0.236413-2.15380.017077
10-0.089548-0.81580.208468
110.2126651.93750.028045
120.2753632.50870.007032
130.0741180.67520.250698
14-0.147402-1.34290.091483
15-0.051194-0.46640.321077
16-0.104947-0.95610.170895
17-0.071972-0.65570.256915
18-0.051401-0.46830.320405
19-0.131309-1.19630.117496
20-0.021092-0.19220.424045
210.0785710.71580.238057
22-0.316461-2.88310.002507
230.0424130.38640.350093
240.0782990.71330.238819
250.0803510.7320.233105
26-0.144429-1.31580.095931
27-0.056953-0.51890.302618
280.0072550.06610.473729
29-0.024049-0.21910.413556
300.0170280.15510.438545
31-0.018107-0.1650.434688
32-0.072189-0.65770.256285
330.0492710.44890.327344
34-0.017637-0.16070.436369
35-0.094975-0.86530.194695
36-0.163573-1.49020.069979
370.1418011.29190.099993
38-0.108116-0.9850.163747
39-0.149677-1.36360.088187
400.069490.63310.264209
41-0.103251-0.94070.174804
42-0.073353-0.66830.252906
430.0410110.37360.354817
44-0.102402-0.93290.176782
45-0.036625-0.33370.369735
460.1278591.16490.123708
47-0.018307-0.16680.433974
480.0540620.49250.311825


Parameters (Session):
par1 = 48 ; par2 = 1 ; par3 = 1 ; par4 = 0 ; par5 = 12 ; par6 = White Noise ; par7 = 0.95 ;
Parameters (R input):
par1 = 48 ; par2 = 1 ; par3 = 1 ; par4 = 0 ; par5 = 12 ; par6 = White Noise ; par7 = 0.95 ; par8 = ;
R code (references can be found in the software module):
if (par1 == 'Default') {
par1 = 10*log10(length(x))
} else {
par1 <- as.numeric(par1)
}
par2 <- as.numeric(par2)
par3 <- as.numeric(par3)
par4 <- as.numeric(par4)
par5 <- as.numeric(par5)
if (par6 == 'White Noise') par6 <- 'white' else par6 <- 'ma'
par7 <- as.numeric(par7)
if (par8 != '') par8 <- as.numeric(par8)
ox <- x
if (par8 == '') {
if (par2 == 0) {
x <- log(x)
} else {
x <- (x ^ par2 - 1) / par2
}
} else {
x <- log(x,base=par8)
}
if (par3 > 0) x <- diff(x,lag=1,difference=par3)
if (par4 > 0) x <- diff(x,lag=par5,difference=par4)
bitmap(file='picts.png')
op <- par(mfrow=c(2,1))
plot(ox,type='l',main='Original Time Series',xlab='time',ylab='value')
if (par8=='') {
mytitle <- paste('Working Time Series (lambda=',par2,', d=',par3,', D=',par4,')',sep='')
mysub <- paste('(lambda=',par2,', d=',par3,', D=',par4,', CI=', par7, ', CI type=',par6,')',sep='')
} else {
mytitle <- paste('Working Time Series (base=',par8,', d=',par3,', D=',par4,')',sep='')
mysub <- paste('(base=',par8,', d=',par3,', D=',par4,', CI=', par7, ', CI type=',par6,')',sep='')
}
plot(x,type='l', main=mytitle,xlab='time',ylab='value')
par(op)
dev.off()
bitmap(file='pic1.png')
racf <- acf(x, par1, main='Autocorrelation', xlab='time lag', ylab='ACF', ci.type=par6, ci=par7, sub=mysub)
dev.off()
bitmap(file='pic2.png')
rpacf <- pacf(x,par1,main='Partial Autocorrelation',xlab='lags',ylab='PACF',sub=mysub)
dev.off()
(myacf <- c(racf$acf))
(mypacf <- c(rpacf$acf))
lengthx <- length(x)
sqrtn <- sqrt(lengthx)
load(file='createtable')
a<-table.start()
a<-table.row.start(a)
a<-table.element(a,'Autocorrelation Function',4,TRUE)
a<-table.row.end(a)
a<-table.row.start(a)
a<-table.element(a,'Time lag k',header=TRUE)
a<-table.element(a,hyperlink('basics.htm','ACF(k)','click here for more information about the Autocorrelation Function'),header=TRUE)
a<-table.element(a,'T-STAT',header=TRUE)
a<-table.element(a,'P-value',header=TRUE)
a<-table.row.end(a)
for (i in 2:(par1+1)) {
a<-table.row.start(a)
a<-table.element(a,i-1,header=TRUE)
a<-table.element(a,round(myacf[i],6))
mytstat <- myacf[i]*sqrtn
a<-table.element(a,round(mytstat,4))
a<-table.element(a,round(1-pt(abs(mytstat),lengthx),6))
a<-table.row.end(a)
}
a<-table.end(a)
table.save(a,file='mytable.tab')
a<-table.start()
a<-table.row.start(a)
a<-table.element(a,'Partial Autocorrelation Function',4,TRUE)
a<-table.row.end(a)
a<-table.row.start(a)
a<-table.element(a,'Time lag k',header=TRUE)
a<-table.element(a,hyperlink('basics.htm','PACF(k)','click here for more information about the Partial Autocorrelation Function'),header=TRUE)
a<-table.element(a,'T-STAT',header=TRUE)
a<-table.element(a,'P-value',header=TRUE)
a<-table.row.end(a)
for (i in 1:par1) {
a<-table.row.start(a)
a<-table.element(a,i,header=TRUE)
a<-table.element(a,round(mypacf[i],6))
mytstat <- mypacf[i]*sqrtn
a<-table.element(a,round(mytstat,4))
a<-table.element(a,round(1-pt(abs(mytstat),lengthx),6))
a<-table.row.end(a)
}
a<-table.end(a)
table.save(a,file='mytable1.tab')