Free Statistics

of Irreproducible Research!

Author's title

Author*Unverified author*
R Software Module--
Title produced by software(Partial) Autocorrelation Function
Date of computationMon, 25 Nov 2013 02:40:17 -0500
Cite this page as followsStatistical Computations at FreeStatistics.org, Office for Research Development and Education, URL https://freestatistics.org/blog/index.php?v=date/2013/Nov/25/t1385365251wp9wxd0unx0hi3g.htm/, Retrieved Mon, 29 Apr 2024 21:50:02 +0000
Statistical Computations at FreeStatistics.org, Office for Research Development and Education, URL https://freestatistics.org/blog/index.php?pk=228210, Retrieved Mon, 29 Apr 2024 21:50:02 +0000
QR Codes:

Original text written by user:
IsPrivate?No (this computation is public)
User-defined keywords
Estimated Impact105
Family? (F = Feedback message, R = changed R code, M = changed R Module, P = changed Parameters, D = changed Data)
-     [(Partial) Autocorrelation Function] [] [2013-11-21 18:13:19] [2469e5bd993431c0aa919cce58f0e013]
- R PD  [(Partial) Autocorrelation Function] [] [2013-11-25 07:39:19] [74be16979710d4c4e7c6647856088456]
-  M        [(Partial) Autocorrelation Function] [] [2013-11-25 07:40:17] [d41d8cd98f00b204e9800998ecf8427e] [Current]
Feedback Forum

Post a new message
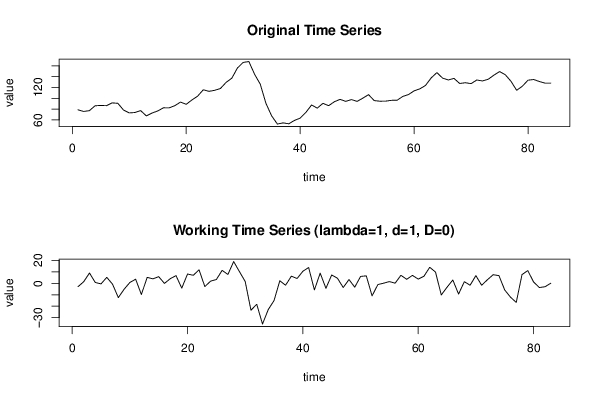
Dataseries X:
78.7
75.7
77.1
86.1
86.8
86.3
91.5
90.7
78.2
73
73.7
77.3
67.5
72.7
76.6
82.4
82.3
86.3
93
88.8
96.9
103.9
115.7
112.8
114.7
118
129.3
137
156
166.2
167.8
144.3
126
90.4
67.5
52.4
54.6
52.9
59.1
63.3
73.8
87.6
81.8
90.7
86.3
93.6
98
94.3
97.6
94.2
100.2
106.7
95.7
94.6
94.7
96.2
96.3
103.3
106.8
113.7
117.4
123.6
137.6
147.4
137.2
133.8
136.7
127.3
128.7
127
133.7
132
135.1
142.6
149.3
143.5
131.4
114.7
122.3
133.4
134.6
130.9
127.9
128


Summary of computational transaction
Raw Inputview raw input (R code)
Raw Outputview raw output of R engine
Computing time3 seconds
R Server'Gwilym Jenkins' @ jenkins.wessa.net

\begin{tabular}{lllllllll}
\hline
Summary of computational transaction \tabularnewline
Raw Input & view raw input (R code)  \tabularnewline
Raw Output & view raw output of R engine  \tabularnewline
Computing time & 3 seconds \tabularnewline
R Server & 'Gwilym Jenkins' @ jenkins.wessa.net \tabularnewline
\hline
\end{tabular}
%Source: https://freestatistics.org/blog/index.php?pk=228210&T=0

[TABLE]
[ROW][C]Summary of computational transaction[/C][/ROW]
[ROW][C]Raw Input[/C][C]view raw input (R code) [/C][/ROW]
[ROW][C]Raw Output[/C][C]view raw output of R engine [/C][/ROW]
[ROW][C]Computing time[/C][C]3 seconds[/C][/ROW]
[ROW][C]R Server[/C][C]'Gwilym Jenkins' @ jenkins.wessa.net[/C][/ROW]
[/TABLE]
Source: https://freestatistics.org/blog/index.php?pk=228210&T=0

Globally Unique Identifier (entire table): ba.freestatistics.org/blog/index.php?pk=228210&T=0

As an alternative you can also use a QR Code:  

The GUIDs for individual cells are displayed in the table below:

Summary of computational transaction
Raw Inputview raw input (R code)
Raw Outputview raw output of R engine
Computing time3 seconds
R Server'Gwilym Jenkins' @ jenkins.wessa.net


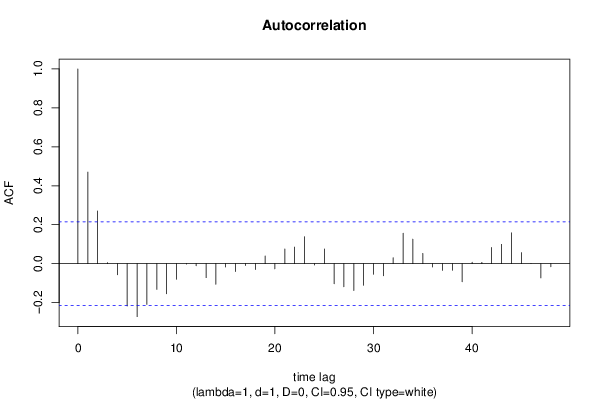
Autocorrelation Function
Time lag kACF(k)T-STATP-value
10.4699564.28152.5e-05
20.2700212.460.007984
30.0053540.04880.480606
4-0.057011-0.51940.302433
5-0.217524-1.98170.025409
6-0.272303-2.48080.007564
7-0.209333-1.90710.029983
8-0.132321-1.20550.115718
9-0.154351-1.40620.081699
10-0.080381-0.73230.233023
11-0.002392-0.02180.491333
12-0.010826-0.09860.460833
13-0.072007-0.6560.256813
14-0.105622-0.96230.169356
15-0.017516-0.15960.436802
16-0.040497-0.36890.356554
17-0.009374-0.08540.466075
18-0.030456-0.27750.391055
190.0394690.35960.360038
20-0.026754-0.24370.404017
210.0752020.68510.247586
220.0850630.7750.220284
230.1383791.26070.105476
24-0.007292-0.06640.473596
250.0749160.68250.248406
26-0.103713-0.94490.173733
27-0.119102-1.08510.140515
28-0.138324-1.26020.105565
29-0.111227-1.01330.156925
30-0.054944-0.50060.309002
31-0.062486-0.56930.285353
320.0306550.27930.390362
330.1562361.42340.079187
340.1257881.1460.127548
350.0525820.4790.316583
36-0.017003-0.15490.438635
37-0.034673-0.31590.376442
38-0.03387-0.30860.379212
39-0.093237-0.84940.199043
400.0073120.06660.473523
410.0064320.05860.476707
420.0827970.75430.226397
430.0991220.9030.184559
440.1581641.44090.076682
450.0564870.51460.304094
46-1.7e-05-2e-040.49994
47-0.073073-0.66570.253717
48-0.015617-0.14230.443601

\begin{tabular}{lllllllll}
\hline
Autocorrelation Function \tabularnewline
Time lag k & ACF(k) & T-STAT & P-value \tabularnewline
1 & 0.469956 & 4.2815 & 2.5e-05 \tabularnewline
2 & 0.270021 & 2.46 & 0.007984 \tabularnewline
3 & 0.005354 & 0.0488 & 0.480606 \tabularnewline
4 & -0.057011 & -0.5194 & 0.302433 \tabularnewline
5 & -0.217524 & -1.9817 & 0.025409 \tabularnewline
6 & -0.272303 & -2.4808 & 0.007564 \tabularnewline
7 & -0.209333 & -1.9071 & 0.029983 \tabularnewline
8 & -0.132321 & -1.2055 & 0.115718 \tabularnewline
9 & -0.154351 & -1.4062 & 0.081699 \tabularnewline
10 & -0.080381 & -0.7323 & 0.233023 \tabularnewline
11 & -0.002392 & -0.0218 & 0.491333 \tabularnewline
12 & -0.010826 & -0.0986 & 0.460833 \tabularnewline
13 & -0.072007 & -0.656 & 0.256813 \tabularnewline
14 & -0.105622 & -0.9623 & 0.169356 \tabularnewline
15 & -0.017516 & -0.1596 & 0.436802 \tabularnewline
16 & -0.040497 & -0.3689 & 0.356554 \tabularnewline
17 & -0.009374 & -0.0854 & 0.466075 \tabularnewline
18 & -0.030456 & -0.2775 & 0.391055 \tabularnewline
19 & 0.039469 & 0.3596 & 0.360038 \tabularnewline
20 & -0.026754 & -0.2437 & 0.404017 \tabularnewline
21 & 0.075202 & 0.6851 & 0.247586 \tabularnewline
22 & 0.085063 & 0.775 & 0.220284 \tabularnewline
23 & 0.138379 & 1.2607 & 0.105476 \tabularnewline
24 & -0.007292 & -0.0664 & 0.473596 \tabularnewline
25 & 0.074916 & 0.6825 & 0.248406 \tabularnewline
26 & -0.103713 & -0.9449 & 0.173733 \tabularnewline
27 & -0.119102 & -1.0851 & 0.140515 \tabularnewline
28 & -0.138324 & -1.2602 & 0.105565 \tabularnewline
29 & -0.111227 & -1.0133 & 0.156925 \tabularnewline
30 & -0.054944 & -0.5006 & 0.309002 \tabularnewline
31 & -0.062486 & -0.5693 & 0.285353 \tabularnewline
32 & 0.030655 & 0.2793 & 0.390362 \tabularnewline
33 & 0.156236 & 1.4234 & 0.079187 \tabularnewline
34 & 0.125788 & 1.146 & 0.127548 \tabularnewline
35 & 0.052582 & 0.479 & 0.316583 \tabularnewline
36 & -0.017003 & -0.1549 & 0.438635 \tabularnewline
37 & -0.034673 & -0.3159 & 0.376442 \tabularnewline
38 & -0.03387 & -0.3086 & 0.379212 \tabularnewline
39 & -0.093237 & -0.8494 & 0.199043 \tabularnewline
40 & 0.007312 & 0.0666 & 0.473523 \tabularnewline
41 & 0.006432 & 0.0586 & 0.476707 \tabularnewline
42 & 0.082797 & 0.7543 & 0.226397 \tabularnewline
43 & 0.099122 & 0.903 & 0.184559 \tabularnewline
44 & 0.158164 & 1.4409 & 0.076682 \tabularnewline
45 & 0.056487 & 0.5146 & 0.304094 \tabularnewline
46 & -1.7e-05 & -2e-04 & 0.49994 \tabularnewline
47 & -0.073073 & -0.6657 & 0.253717 \tabularnewline
48 & -0.015617 & -0.1423 & 0.443601 \tabularnewline
\hline
\end{tabular}
%Source: https://freestatistics.org/blog/index.php?pk=228210&T=1

[TABLE]
[ROW][C]Autocorrelation Function[/C][/ROW]
[ROW][C]Time lag k[/C][C]ACF(k)[/C][C]T-STAT[/C][C]P-value[/C][/ROW]
[ROW][C]1[/C][C]0.469956[/C][C]4.2815[/C][C]2.5e-05[/C][/ROW]
[ROW][C]2[/C][C]0.270021[/C][C]2.46[/C][C]0.007984[/C][/ROW]
[ROW][C]3[/C][C]0.005354[/C][C]0.0488[/C][C]0.480606[/C][/ROW]
[ROW][C]4[/C][C]-0.057011[/C][C]-0.5194[/C][C]0.302433[/C][/ROW]
[ROW][C]5[/C][C]-0.217524[/C][C]-1.9817[/C][C]0.025409[/C][/ROW]
[ROW][C]6[/C][C]-0.272303[/C][C]-2.4808[/C][C]0.007564[/C][/ROW]
[ROW][C]7[/C][C]-0.209333[/C][C]-1.9071[/C][C]0.029983[/C][/ROW]
[ROW][C]8[/C][C]-0.132321[/C][C]-1.2055[/C][C]0.115718[/C][/ROW]
[ROW][C]9[/C][C]-0.154351[/C][C]-1.4062[/C][C]0.081699[/C][/ROW]
[ROW][C]10[/C][C]-0.080381[/C][C]-0.7323[/C][C]0.233023[/C][/ROW]
[ROW][C]11[/C][C]-0.002392[/C][C]-0.0218[/C][C]0.491333[/C][/ROW]
[ROW][C]12[/C][C]-0.010826[/C][C]-0.0986[/C][C]0.460833[/C][/ROW]
[ROW][C]13[/C][C]-0.072007[/C][C]-0.656[/C][C]0.256813[/C][/ROW]
[ROW][C]14[/C][C]-0.105622[/C][C]-0.9623[/C][C]0.169356[/C][/ROW]
[ROW][C]15[/C][C]-0.017516[/C][C]-0.1596[/C][C]0.436802[/C][/ROW]
[ROW][C]16[/C][C]-0.040497[/C][C]-0.3689[/C][C]0.356554[/C][/ROW]
[ROW][C]17[/C][C]-0.009374[/C][C]-0.0854[/C][C]0.466075[/C][/ROW]
[ROW][C]18[/C][C]-0.030456[/C][C]-0.2775[/C][C]0.391055[/C][/ROW]
[ROW][C]19[/C][C]0.039469[/C][C]0.3596[/C][C]0.360038[/C][/ROW]
[ROW][C]20[/C][C]-0.026754[/C][C]-0.2437[/C][C]0.404017[/C][/ROW]
[ROW][C]21[/C][C]0.075202[/C][C]0.6851[/C][C]0.247586[/C][/ROW]
[ROW][C]22[/C][C]0.085063[/C][C]0.775[/C][C]0.220284[/C][/ROW]
[ROW][C]23[/C][C]0.138379[/C][C]1.2607[/C][C]0.105476[/C][/ROW]
[ROW][C]24[/C][C]-0.007292[/C][C]-0.0664[/C][C]0.473596[/C][/ROW]
[ROW][C]25[/C][C]0.074916[/C][C]0.6825[/C][C]0.248406[/C][/ROW]
[ROW][C]26[/C][C]-0.103713[/C][C]-0.9449[/C][C]0.173733[/C][/ROW]
[ROW][C]27[/C][C]-0.119102[/C][C]-1.0851[/C][C]0.140515[/C][/ROW]
[ROW][C]28[/C][C]-0.138324[/C][C]-1.2602[/C][C]0.105565[/C][/ROW]
[ROW][C]29[/C][C]-0.111227[/C][C]-1.0133[/C][C]0.156925[/C][/ROW]
[ROW][C]30[/C][C]-0.054944[/C][C]-0.5006[/C][C]0.309002[/C][/ROW]
[ROW][C]31[/C][C]-0.062486[/C][C]-0.5693[/C][C]0.285353[/C][/ROW]
[ROW][C]32[/C][C]0.030655[/C][C]0.2793[/C][C]0.390362[/C][/ROW]
[ROW][C]33[/C][C]0.156236[/C][C]1.4234[/C][C]0.079187[/C][/ROW]
[ROW][C]34[/C][C]0.125788[/C][C]1.146[/C][C]0.127548[/C][/ROW]
[ROW][C]35[/C][C]0.052582[/C][C]0.479[/C][C]0.316583[/C][/ROW]
[ROW][C]36[/C][C]-0.017003[/C][C]-0.1549[/C][C]0.438635[/C][/ROW]
[ROW][C]37[/C][C]-0.034673[/C][C]-0.3159[/C][C]0.376442[/C][/ROW]
[ROW][C]38[/C][C]-0.03387[/C][C]-0.3086[/C][C]0.379212[/C][/ROW]
[ROW][C]39[/C][C]-0.093237[/C][C]-0.8494[/C][C]0.199043[/C][/ROW]
[ROW][C]40[/C][C]0.007312[/C][C]0.0666[/C][C]0.473523[/C][/ROW]
[ROW][C]41[/C][C]0.006432[/C][C]0.0586[/C][C]0.476707[/C][/ROW]
[ROW][C]42[/C][C]0.082797[/C][C]0.7543[/C][C]0.226397[/C][/ROW]
[ROW][C]43[/C][C]0.099122[/C][C]0.903[/C][C]0.184559[/C][/ROW]
[ROW][C]44[/C][C]0.158164[/C][C]1.4409[/C][C]0.076682[/C][/ROW]
[ROW][C]45[/C][C]0.056487[/C][C]0.5146[/C][C]0.304094[/C][/ROW]
[ROW][C]46[/C][C]-1.7e-05[/C][C]-2e-04[/C][C]0.49994[/C][/ROW]
[ROW][C]47[/C][C]-0.073073[/C][C]-0.6657[/C][C]0.253717[/C][/ROW]
[ROW][C]48[/C][C]-0.015617[/C][C]-0.1423[/C][C]0.443601[/C][/ROW]
[/TABLE]
Source: https://freestatistics.org/blog/index.php?pk=228210&T=1

Globally Unique Identifier (entire table): ba.freestatistics.org/blog/index.php?pk=228210&T=1

As an alternative you can also use a QR Code:  

The GUIDs for individual cells are displayed in the table below:

Autocorrelation Function
Time lag kACF(k)T-STATP-value
10.4699564.28152.5e-05
20.2700212.460.007984
30.0053540.04880.480606
4-0.057011-0.51940.302433
5-0.217524-1.98170.025409
6-0.272303-2.48080.007564
7-0.209333-1.90710.029983
8-0.132321-1.20550.115718
9-0.154351-1.40620.081699
10-0.080381-0.73230.233023
11-0.002392-0.02180.491333
12-0.010826-0.09860.460833
13-0.072007-0.6560.256813
14-0.105622-0.96230.169356
15-0.017516-0.15960.436802
16-0.040497-0.36890.356554
17-0.009374-0.08540.466075
18-0.030456-0.27750.391055
190.0394690.35960.360038
20-0.026754-0.24370.404017
210.0752020.68510.247586
220.0850630.7750.220284
230.1383791.26070.105476
24-0.007292-0.06640.473596
250.0749160.68250.248406
26-0.103713-0.94490.173733
27-0.119102-1.08510.140515
28-0.138324-1.26020.105565
29-0.111227-1.01330.156925
30-0.054944-0.50060.309002
31-0.062486-0.56930.285353
320.0306550.27930.390362
330.1562361.42340.079187
340.1257881.1460.127548
350.0525820.4790.316583
36-0.017003-0.15490.438635
37-0.034673-0.31590.376442
38-0.03387-0.30860.379212
39-0.093237-0.84940.199043
400.0073120.06660.473523
410.0064320.05860.476707
420.0827970.75430.226397
430.0991220.9030.184559
440.1581641.44090.076682
450.0564870.51460.304094
46-1.7e-05-2e-040.49994
47-0.073073-0.66570.253717
48-0.015617-0.14230.443601


Partial Autocorrelation Function
Time lag kPACF(k)T-STATP-value
10.4699564.28152.5e-05
20.0630980.57480.283474
3-0.184514-1.6810.048261
4-0.015598-0.14210.443671
5-0.183415-1.6710.049245
6-0.137755-1.2550.106498
70.0275260.25080.401304
8-0.019251-0.17540.430604
9-0.152066-1.38540.084823
100.0046220.04210.483257
110.019020.17330.431428
12-0.120618-1.09890.137499
13-0.111832-1.01880.155621
14-0.089908-0.81910.207537
150.0286390.26090.397403
16-0.08102-0.73810.23126
17-0.019304-0.17590.430414
18-0.087929-0.80110.212689
19-0.020806-0.18950.425062
20-0.111905-1.01950.155464
210.0955720.87070.193214
22-0.000475-0.00430.498279
23-0.003877-0.03530.485954
24-0.138418-1.2610.105413
250.1157731.05470.147301
26-0.249878-2.27650.012695
27-0.092014-0.83830.20214
280.0448220.40840.342034
29-0.123157-1.1220.132547
30-0.028978-0.2640.396216
31-0.055557-0.50610.307047
32-0.023342-0.21270.416057
330.0764340.69630.24408
34-0.086053-0.7840.217642
35-0.099408-0.90560.183872
36-0.106957-0.97440.166339
37-0.046505-0.42370.336449
38-0.036814-0.33540.369087
39-0.075522-0.6880.246674
40-0.035675-0.3250.372995
41-0.066267-0.60370.273836
420.0269670.24570.403269
430.0532560.48520.314411
44-0.06233-0.56780.285835
45-0.107982-0.98380.164046
46-0.071066-0.64740.259568
47-0.048384-0.44080.330253
480.0301090.27430.392267

\begin{tabular}{lllllllll}
\hline
Partial Autocorrelation Function \tabularnewline
Time lag k & PACF(k) & T-STAT & P-value \tabularnewline
1 & 0.469956 & 4.2815 & 2.5e-05 \tabularnewline
2 & 0.063098 & 0.5748 & 0.283474 \tabularnewline
3 & -0.184514 & -1.681 & 0.048261 \tabularnewline
4 & -0.015598 & -0.1421 & 0.443671 \tabularnewline
5 & -0.183415 & -1.671 & 0.049245 \tabularnewline
6 & -0.137755 & -1.255 & 0.106498 \tabularnewline
7 & 0.027526 & 0.2508 & 0.401304 \tabularnewline
8 & -0.019251 & -0.1754 & 0.430604 \tabularnewline
9 & -0.152066 & -1.3854 & 0.084823 \tabularnewline
10 & 0.004622 & 0.0421 & 0.483257 \tabularnewline
11 & 0.01902 & 0.1733 & 0.431428 \tabularnewline
12 & -0.120618 & -1.0989 & 0.137499 \tabularnewline
13 & -0.111832 & -1.0188 & 0.155621 \tabularnewline
14 & -0.089908 & -0.8191 & 0.207537 \tabularnewline
15 & 0.028639 & 0.2609 & 0.397403 \tabularnewline
16 & -0.08102 & -0.7381 & 0.23126 \tabularnewline
17 & -0.019304 & -0.1759 & 0.430414 \tabularnewline
18 & -0.087929 & -0.8011 & 0.212689 \tabularnewline
19 & -0.020806 & -0.1895 & 0.425062 \tabularnewline
20 & -0.111905 & -1.0195 & 0.155464 \tabularnewline
21 & 0.095572 & 0.8707 & 0.193214 \tabularnewline
22 & -0.000475 & -0.0043 & 0.498279 \tabularnewline
23 & -0.003877 & -0.0353 & 0.485954 \tabularnewline
24 & -0.138418 & -1.261 & 0.105413 \tabularnewline
25 & 0.115773 & 1.0547 & 0.147301 \tabularnewline
26 & -0.249878 & -2.2765 & 0.012695 \tabularnewline
27 & -0.092014 & -0.8383 & 0.20214 \tabularnewline
28 & 0.044822 & 0.4084 & 0.342034 \tabularnewline
29 & -0.123157 & -1.122 & 0.132547 \tabularnewline
30 & -0.028978 & -0.264 & 0.396216 \tabularnewline
31 & -0.055557 & -0.5061 & 0.307047 \tabularnewline
32 & -0.023342 & -0.2127 & 0.416057 \tabularnewline
33 & 0.076434 & 0.6963 & 0.24408 \tabularnewline
34 & -0.086053 & -0.784 & 0.217642 \tabularnewline
35 & -0.099408 & -0.9056 & 0.183872 \tabularnewline
36 & -0.106957 & -0.9744 & 0.166339 \tabularnewline
37 & -0.046505 & -0.4237 & 0.336449 \tabularnewline
38 & -0.036814 & -0.3354 & 0.369087 \tabularnewline
39 & -0.075522 & -0.688 & 0.246674 \tabularnewline
40 & -0.035675 & -0.325 & 0.372995 \tabularnewline
41 & -0.066267 & -0.6037 & 0.273836 \tabularnewline
42 & 0.026967 & 0.2457 & 0.403269 \tabularnewline
43 & 0.053256 & 0.4852 & 0.314411 \tabularnewline
44 & -0.06233 & -0.5678 & 0.285835 \tabularnewline
45 & -0.107982 & -0.9838 & 0.164046 \tabularnewline
46 & -0.071066 & -0.6474 & 0.259568 \tabularnewline
47 & -0.048384 & -0.4408 & 0.330253 \tabularnewline
48 & 0.030109 & 0.2743 & 0.392267 \tabularnewline
\hline
\end{tabular}
%Source: https://freestatistics.org/blog/index.php?pk=228210&T=2

[TABLE]
[ROW][C]Partial Autocorrelation Function[/C][/ROW]
[ROW][C]Time lag k[/C][C]PACF(k)[/C][C]T-STAT[/C][C]P-value[/C][/ROW]
[ROW][C]1[/C][C]0.469956[/C][C]4.2815[/C][C]2.5e-05[/C][/ROW]
[ROW][C]2[/C][C]0.063098[/C][C]0.5748[/C][C]0.283474[/C][/ROW]
[ROW][C]3[/C][C]-0.184514[/C][C]-1.681[/C][C]0.048261[/C][/ROW]
[ROW][C]4[/C][C]-0.015598[/C][C]-0.1421[/C][C]0.443671[/C][/ROW]
[ROW][C]5[/C][C]-0.183415[/C][C]-1.671[/C][C]0.049245[/C][/ROW]
[ROW][C]6[/C][C]-0.137755[/C][C]-1.255[/C][C]0.106498[/C][/ROW]
[ROW][C]7[/C][C]0.027526[/C][C]0.2508[/C][C]0.401304[/C][/ROW]
[ROW][C]8[/C][C]-0.019251[/C][C]-0.1754[/C][C]0.430604[/C][/ROW]
[ROW][C]9[/C][C]-0.152066[/C][C]-1.3854[/C][C]0.084823[/C][/ROW]
[ROW][C]10[/C][C]0.004622[/C][C]0.0421[/C][C]0.483257[/C][/ROW]
[ROW][C]11[/C][C]0.01902[/C][C]0.1733[/C][C]0.431428[/C][/ROW]
[ROW][C]12[/C][C]-0.120618[/C][C]-1.0989[/C][C]0.137499[/C][/ROW]
[ROW][C]13[/C][C]-0.111832[/C][C]-1.0188[/C][C]0.155621[/C][/ROW]
[ROW][C]14[/C][C]-0.089908[/C][C]-0.8191[/C][C]0.207537[/C][/ROW]
[ROW][C]15[/C][C]0.028639[/C][C]0.2609[/C][C]0.397403[/C][/ROW]
[ROW][C]16[/C][C]-0.08102[/C][C]-0.7381[/C][C]0.23126[/C][/ROW]
[ROW][C]17[/C][C]-0.019304[/C][C]-0.1759[/C][C]0.430414[/C][/ROW]
[ROW][C]18[/C][C]-0.087929[/C][C]-0.8011[/C][C]0.212689[/C][/ROW]
[ROW][C]19[/C][C]-0.020806[/C][C]-0.1895[/C][C]0.425062[/C][/ROW]
[ROW][C]20[/C][C]-0.111905[/C][C]-1.0195[/C][C]0.155464[/C][/ROW]
[ROW][C]21[/C][C]0.095572[/C][C]0.8707[/C][C]0.193214[/C][/ROW]
[ROW][C]22[/C][C]-0.000475[/C][C]-0.0043[/C][C]0.498279[/C][/ROW]
[ROW][C]23[/C][C]-0.003877[/C][C]-0.0353[/C][C]0.485954[/C][/ROW]
[ROW][C]24[/C][C]-0.138418[/C][C]-1.261[/C][C]0.105413[/C][/ROW]
[ROW][C]25[/C][C]0.115773[/C][C]1.0547[/C][C]0.147301[/C][/ROW]
[ROW][C]26[/C][C]-0.249878[/C][C]-2.2765[/C][C]0.012695[/C][/ROW]
[ROW][C]27[/C][C]-0.092014[/C][C]-0.8383[/C][C]0.20214[/C][/ROW]
[ROW][C]28[/C][C]0.044822[/C][C]0.4084[/C][C]0.342034[/C][/ROW]
[ROW][C]29[/C][C]-0.123157[/C][C]-1.122[/C][C]0.132547[/C][/ROW]
[ROW][C]30[/C][C]-0.028978[/C][C]-0.264[/C][C]0.396216[/C][/ROW]
[ROW][C]31[/C][C]-0.055557[/C][C]-0.5061[/C][C]0.307047[/C][/ROW]
[ROW][C]32[/C][C]-0.023342[/C][C]-0.2127[/C][C]0.416057[/C][/ROW]
[ROW][C]33[/C][C]0.076434[/C][C]0.6963[/C][C]0.24408[/C][/ROW]
[ROW][C]34[/C][C]-0.086053[/C][C]-0.784[/C][C]0.217642[/C][/ROW]
[ROW][C]35[/C][C]-0.099408[/C][C]-0.9056[/C][C]0.183872[/C][/ROW]
[ROW][C]36[/C][C]-0.106957[/C][C]-0.9744[/C][C]0.166339[/C][/ROW]
[ROW][C]37[/C][C]-0.046505[/C][C]-0.4237[/C][C]0.336449[/C][/ROW]
[ROW][C]38[/C][C]-0.036814[/C][C]-0.3354[/C][C]0.369087[/C][/ROW]
[ROW][C]39[/C][C]-0.075522[/C][C]-0.688[/C][C]0.246674[/C][/ROW]
[ROW][C]40[/C][C]-0.035675[/C][C]-0.325[/C][C]0.372995[/C][/ROW]
[ROW][C]41[/C][C]-0.066267[/C][C]-0.6037[/C][C]0.273836[/C][/ROW]
[ROW][C]42[/C][C]0.026967[/C][C]0.2457[/C][C]0.403269[/C][/ROW]
[ROW][C]43[/C][C]0.053256[/C][C]0.4852[/C][C]0.314411[/C][/ROW]
[ROW][C]44[/C][C]-0.06233[/C][C]-0.5678[/C][C]0.285835[/C][/ROW]
[ROW][C]45[/C][C]-0.107982[/C][C]-0.9838[/C][C]0.164046[/C][/ROW]
[ROW][C]46[/C][C]-0.071066[/C][C]-0.6474[/C][C]0.259568[/C][/ROW]
[ROW][C]47[/C][C]-0.048384[/C][C]-0.4408[/C][C]0.330253[/C][/ROW]
[ROW][C]48[/C][C]0.030109[/C][C]0.2743[/C][C]0.392267[/C][/ROW]
[/TABLE]
Source: https://freestatistics.org/blog/index.php?pk=228210&T=2

Globally Unique Identifier (entire table): ba.freestatistics.org/blog/index.php?pk=228210&T=2

As an alternative you can also use a QR Code:  

The GUIDs for individual cells are displayed in the table below:

Partial Autocorrelation Function
Time lag kPACF(k)T-STATP-value
10.4699564.28152.5e-05
20.0630980.57480.283474
3-0.184514-1.6810.048261
4-0.015598-0.14210.443671
5-0.183415-1.6710.049245
6-0.137755-1.2550.106498
70.0275260.25080.401304
8-0.019251-0.17540.430604
9-0.152066-1.38540.084823
100.0046220.04210.483257
110.019020.17330.431428
12-0.120618-1.09890.137499
13-0.111832-1.01880.155621
14-0.089908-0.81910.207537
150.0286390.26090.397403
16-0.08102-0.73810.23126
17-0.019304-0.17590.430414
18-0.087929-0.80110.212689
19-0.020806-0.18950.425062
20-0.111905-1.01950.155464
210.0955720.87070.193214
22-0.000475-0.00430.498279
23-0.003877-0.03530.485954
24-0.138418-1.2610.105413
250.1157731.05470.147301
26-0.249878-2.27650.012695
27-0.092014-0.83830.20214
280.0448220.40840.342034
29-0.123157-1.1220.132547
30-0.028978-0.2640.396216
31-0.055557-0.50610.307047
32-0.023342-0.21270.416057
330.0764340.69630.24408
34-0.086053-0.7840.217642
35-0.099408-0.90560.183872
36-0.106957-0.97440.166339
37-0.046505-0.42370.336449
38-0.036814-0.33540.369087
39-0.075522-0.6880.246674
40-0.035675-0.3250.372995
41-0.066267-0.60370.273836
420.0269670.24570.403269
430.0532560.48520.314411
44-0.06233-0.56780.285835
45-0.107982-0.98380.164046
46-0.071066-0.64740.259568
47-0.048384-0.44080.330253
480.0301090.27430.392267


Parameters (Session):
par1 = 48 ; par2 = 1 ; par3 = 1 ; par4 = 0 ; par5 = 12 ; par6 = White Noise ; par7 = 0.95 ;
Parameters (R input):
par1 = 48 ; par2 = 1 ; par3 = 1 ; par4 = 0 ; par5 = 12 ; par6 = White Noise ; par7 = 0.95 ; par8 = ; par9 = ; par10 = ; par11 = ; par12 = ; par13 = ; par14 = ; par15 = ; par16 = ; par17 = ; par18 = ; par19 = ; par20 = ;
R code (references can be found in the software module):
if (par1 == 'Default') {
par1 = 10*log10(length(x))
} else {
par1 <- as.numeric(par1)
}
par2 <- as.numeric(par2)
par3 <- as.numeric(par3)
par4 <- as.numeric(par4)
par5 <- as.numeric(par5)
if (par6 == 'White Noise') par6 <- 'white' else par6 <- 'ma'
par7 <- as.numeric(par7)
if (par8 != '') par8 <- as.numeric(par8)
ox <- x
if (par8 == '') {
if (par2 == 0) {
x <- log(x)
} else {
x <- (x ^ par2 - 1) / par2
}
} else {
x <- log(x,base=par8)
}
if (par3 > 0) x <- diff(x,lag=1,difference=par3)
if (par4 > 0) x <- diff(x,lag=par5,difference=par4)
bitmap(file='picts.png')
op <- par(mfrow=c(2,1))
plot(ox,type='l',main='Original Time Series',xlab='time',ylab='value')
if (par8=='') {
mytitle <- paste('Working Time Series (lambda=',par2,', d=',par3,', D=',par4,')',sep='')
mysub <- paste('(lambda=',par2,', d=',par3,', D=',par4,', CI=', par7, ', CI type=',par6,')',sep='')
} else {
mytitle <- paste('Working Time Series (base=',par8,', d=',par3,', D=',par4,')',sep='')
mysub <- paste('(base=',par8,', d=',par3,', D=',par4,', CI=', par7, ', CI type=',par6,')',sep='')
}
plot(x,type='l', main=mytitle,xlab='time',ylab='value')
par(op)
dev.off()
bitmap(file='pic1.png')
racf <- acf(x, par1, main='Autocorrelation', xlab='time lag', ylab='ACF', ci.type=par6, ci=par7, sub=mysub)
dev.off()
bitmap(file='pic2.png')
rpacf <- pacf(x,par1,main='Partial Autocorrelation',xlab='lags',ylab='PACF',sub=mysub)
dev.off()
(myacf <- c(racf$acf))
(mypacf <- c(rpacf$acf))
lengthx <- length(x)
sqrtn <- sqrt(lengthx)
load(file='createtable')
a<-table.start()
a<-table.row.start(a)
a<-table.element(a,'Autocorrelation Function',4,TRUE)
a<-table.row.end(a)
a<-table.row.start(a)
a<-table.element(a,'Time lag k',header=TRUE)
a<-table.element(a,hyperlink('basics.htm','ACF(k)','click here for more information about the Autocorrelation Function'),header=TRUE)
a<-table.element(a,'T-STAT',header=TRUE)
a<-table.element(a,'P-value',header=TRUE)
a<-table.row.end(a)
for (i in 2:(par1+1)) {
a<-table.row.start(a)
a<-table.element(a,i-1,header=TRUE)
a<-table.element(a,round(myacf[i],6))
mytstat <- myacf[i]*sqrtn
a<-table.element(a,round(mytstat,4))
a<-table.element(a,round(1-pt(abs(mytstat),lengthx),6))
a<-table.row.end(a)
}
a<-table.end(a)
table.save(a,file='mytable.tab')
a<-table.start()
a<-table.row.start(a)
a<-table.element(a,'Partial Autocorrelation Function',4,TRUE)
a<-table.row.end(a)
a<-table.row.start(a)
a<-table.element(a,'Time lag k',header=TRUE)
a<-table.element(a,hyperlink('basics.htm','PACF(k)','click here for more information about the Partial Autocorrelation Function'),header=TRUE)
a<-table.element(a,'T-STAT',header=TRUE)
a<-table.element(a,'P-value',header=TRUE)
a<-table.row.end(a)
for (i in 1:par1) {
a<-table.row.start(a)
a<-table.element(a,i,header=TRUE)
a<-table.element(a,round(mypacf[i],6))
mytstat <- mypacf[i]*sqrtn
a<-table.element(a,round(mytstat,4))
a<-table.element(a,round(1-pt(abs(mytstat),lengthx),6))
a<-table.row.end(a)
}
a<-table.end(a)
table.save(a,file='mytable1.tab')