Free Statistics

of Irreproducible Research!

Author's title

Author*The author of this computation has been verified*
R Software Modulerwasp_autocorrelation.wasp
Title produced by software(Partial) Autocorrelation Function
Date of computationSat, 30 Nov 2013 08:53:19 -0500
Cite this page as followsStatistical Computations at FreeStatistics.org, Office for Research Development and Education, URL https://freestatistics.org/blog/index.php?v=date/2013/Nov/30/t1385819640sm15zfbuo98ibtl.htm/, Retrieved Fri, 03 May 2024 04:36:17 +0000
Statistical Computations at FreeStatistics.org, Office for Research Development and Education, URL https://freestatistics.org/blog/index.php?pk=229659, Retrieved Fri, 03 May 2024 04:36:17 +0000
QR Codes:

Original text written by user:
IsPrivate?No (this computation is public)
User-defined keywords
Estimated Impact113
Family? (F = Feedback message, R = changed R code, M = changed R Module, P = changed Parameters, D = changed Data)
-     [Variance Reduction Matrix] [WS9 SOLDIERS] [2013-11-30 12:31:57] [22b6f4a061c8797aa483199554a73d13]
- RMP   [(Partial) Autocorrelation Function] [WS9 AUTOCOR FUNCTION] [2013-11-30 13:46:13] [22b6f4a061c8797aa483199554a73d13]
- R P       [(Partial) Autocorrelation Function] [WS9 ACF 2] [2013-11-30 13:53:19] [8179ce7eb414aa418dc0ad56e90ed4f7] [Current]
Feedback Forum

Post a new message
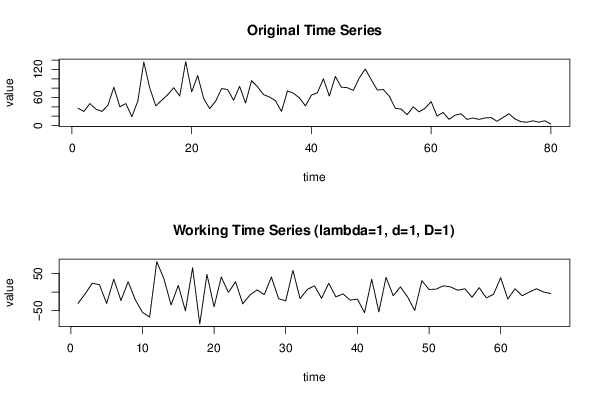
Dataseries X:
37
30
47
35
30
43
82
40
47
19
52
136
80
42
54
66
81
63
137
72
107
58
36
52
79
77
54
84
48
96
83
66
61
53
30
74
69
59
42
65
70
100
63
105
82
81
75
102
121
98
76
77
63
37
35
23
40
29
37
51
20
28
13
22
25
13
16
13
16
17
9
17
25
14
8
7
10
7
10
3


Summary of computational transaction
Raw Inputview raw input (R code)
Raw Outputview raw output of R engine
Computing time4 seconds
R Server'Gwilym Jenkins' @ jenkins.wessa.net

\begin{tabular}{lllllllll}
\hline
Summary of computational transaction \tabularnewline
Raw Input & view raw input (R code)  \tabularnewline
Raw Output & view raw output of R engine  \tabularnewline
Computing time & 4 seconds \tabularnewline
R Server & 'Gwilym Jenkins' @ jenkins.wessa.net \tabularnewline
\hline
\end{tabular}
%Source: https://freestatistics.org/blog/index.php?pk=229659&T=0

[TABLE]
[ROW][C]Summary of computational transaction[/C][/ROW]
[ROW][C]Raw Input[/C][C]view raw input (R code) [/C][/ROW]
[ROW][C]Raw Output[/C][C]view raw output of R engine [/C][/ROW]
[ROW][C]Computing time[/C][C]4 seconds[/C][/ROW]
[ROW][C]R Server[/C][C]'Gwilym Jenkins' @ jenkins.wessa.net[/C][/ROW]
[/TABLE]
Source: https://freestatistics.org/blog/index.php?pk=229659&T=0

Globally Unique Identifier (entire table): ba.freestatistics.org/blog/index.php?pk=229659&T=0

As an alternative you can also use a QR Code:  

The GUIDs for individual cells are displayed in the table below:

Summary of computational transaction
Raw Inputview raw input (R code)
Raw Outputview raw output of R engine
Computing time4 seconds
R Server'Gwilym Jenkins' @ jenkins.wessa.net


Autocorrelation Function
Time lag kACF(k)T-STATP-value
1-0.460995-3.77340.000172
20.1988851.62790.054116
3-0.24417-1.99860.024855
40.0925740.75770.225629
50.0070340.05760.477127
6-0.01968-0.16110.436253
7-0.045384-0.37150.355724
8-0.006668-0.05460.478317
90.1779971.4570.074898
10-0.12617-1.03270.152717
110.1495831.22440.112546
12-0.340062-2.78350.003491
130.1042030.85290.198365
14-0.024683-0.2020.420248
150.0393560.32210.374174
160.041210.33730.368464
17-0.084819-0.69430.244957
18-0.034638-0.28350.388826
190.1597541.30760.097732
20-0.177557-1.45340.075395
210.0857320.70170.242633
22-0.106937-0.87530.192264
230.1607651.31590.096343
24-0.103788-0.84950.199303
250.1388181.13630.129945
26-0.168092-1.37590.086719
270.0611570.50060.30915
28-0.051829-0.42420.336375
290.042620.34890.364144
300.0906890.74230.230244
31-0.094963-0.77730.219857
320.1593491.30430.098293
33-0.090921-0.74420.229673
340.095720.78350.218047
35-0.178582-1.46180.074241
360.022540.18450.42709
370.0025650.0210.491655
380.0993680.81340.209447
39-0.039771-0.32550.372893
400.0140870.11530.454272
410.0238280.1950.422974
42-0.076159-0.62340.267572
430.0735490.6020.274594
44-0.102235-0.83680.202831
450.0410630.33610.368917
46-0.037553-0.30740.379752
470.0589350.48240.315546
480.0315940.25860.398366

\begin{tabular}{lllllllll}
\hline
Autocorrelation Function \tabularnewline
Time lag k & ACF(k) & T-STAT & P-value \tabularnewline
1 & -0.460995 & -3.7734 & 0.000172 \tabularnewline
2 & 0.198885 & 1.6279 & 0.054116 \tabularnewline
3 & -0.24417 & -1.9986 & 0.024855 \tabularnewline
4 & 0.092574 & 0.7577 & 0.225629 \tabularnewline
5 & 0.007034 & 0.0576 & 0.477127 \tabularnewline
6 & -0.01968 & -0.1611 & 0.436253 \tabularnewline
7 & -0.045384 & -0.3715 & 0.355724 \tabularnewline
8 & -0.006668 & -0.0546 & 0.478317 \tabularnewline
9 & 0.177997 & 1.457 & 0.074898 \tabularnewline
10 & -0.12617 & -1.0327 & 0.152717 \tabularnewline
11 & 0.149583 & 1.2244 & 0.112546 \tabularnewline
12 & -0.340062 & -2.7835 & 0.003491 \tabularnewline
13 & 0.104203 & 0.8529 & 0.198365 \tabularnewline
14 & -0.024683 & -0.202 & 0.420248 \tabularnewline
15 & 0.039356 & 0.3221 & 0.374174 \tabularnewline
16 & 0.04121 & 0.3373 & 0.368464 \tabularnewline
17 & -0.084819 & -0.6943 & 0.244957 \tabularnewline
18 & -0.034638 & -0.2835 & 0.388826 \tabularnewline
19 & 0.159754 & 1.3076 & 0.097732 \tabularnewline
20 & -0.177557 & -1.4534 & 0.075395 \tabularnewline
21 & 0.085732 & 0.7017 & 0.242633 \tabularnewline
22 & -0.106937 & -0.8753 & 0.192264 \tabularnewline
23 & 0.160765 & 1.3159 & 0.096343 \tabularnewline
24 & -0.103788 & -0.8495 & 0.199303 \tabularnewline
25 & 0.138818 & 1.1363 & 0.129945 \tabularnewline
26 & -0.168092 & -1.3759 & 0.086719 \tabularnewline
27 & 0.061157 & 0.5006 & 0.30915 \tabularnewline
28 & -0.051829 & -0.4242 & 0.336375 \tabularnewline
29 & 0.04262 & 0.3489 & 0.364144 \tabularnewline
30 & 0.090689 & 0.7423 & 0.230244 \tabularnewline
31 & -0.094963 & -0.7773 & 0.219857 \tabularnewline
32 & 0.159349 & 1.3043 & 0.098293 \tabularnewline
33 & -0.090921 & -0.7442 & 0.229673 \tabularnewline
34 & 0.09572 & 0.7835 & 0.218047 \tabularnewline
35 & -0.178582 & -1.4618 & 0.074241 \tabularnewline
36 & 0.02254 & 0.1845 & 0.42709 \tabularnewline
37 & 0.002565 & 0.021 & 0.491655 \tabularnewline
38 & 0.099368 & 0.8134 & 0.209447 \tabularnewline
39 & -0.039771 & -0.3255 & 0.372893 \tabularnewline
40 & 0.014087 & 0.1153 & 0.454272 \tabularnewline
41 & 0.023828 & 0.195 & 0.422974 \tabularnewline
42 & -0.076159 & -0.6234 & 0.267572 \tabularnewline
43 & 0.073549 & 0.602 & 0.274594 \tabularnewline
44 & -0.102235 & -0.8368 & 0.202831 \tabularnewline
45 & 0.041063 & 0.3361 & 0.368917 \tabularnewline
46 & -0.037553 & -0.3074 & 0.379752 \tabularnewline
47 & 0.058935 & 0.4824 & 0.315546 \tabularnewline
48 & 0.031594 & 0.2586 & 0.398366 \tabularnewline
\hline
\end{tabular}
%Source: https://freestatistics.org/blog/index.php?pk=229659&T=1

[TABLE]
[ROW][C]Autocorrelation Function[/C][/ROW]
[ROW][C]Time lag k[/C][C]ACF(k)[/C][C]T-STAT[/C][C]P-value[/C][/ROW]
[ROW][C]1[/C][C]-0.460995[/C][C]-3.7734[/C][C]0.000172[/C][/ROW]
[ROW][C]2[/C][C]0.198885[/C][C]1.6279[/C][C]0.054116[/C][/ROW]
[ROW][C]3[/C][C]-0.24417[/C][C]-1.9986[/C][C]0.024855[/C][/ROW]
[ROW][C]4[/C][C]0.092574[/C][C]0.7577[/C][C]0.225629[/C][/ROW]
[ROW][C]5[/C][C]0.007034[/C][C]0.0576[/C][C]0.477127[/C][/ROW]
[ROW][C]6[/C][C]-0.01968[/C][C]-0.1611[/C][C]0.436253[/C][/ROW]
[ROW][C]7[/C][C]-0.045384[/C][C]-0.3715[/C][C]0.355724[/C][/ROW]
[ROW][C]8[/C][C]-0.006668[/C][C]-0.0546[/C][C]0.478317[/C][/ROW]
[ROW][C]9[/C][C]0.177997[/C][C]1.457[/C][C]0.074898[/C][/ROW]
[ROW][C]10[/C][C]-0.12617[/C][C]-1.0327[/C][C]0.152717[/C][/ROW]
[ROW][C]11[/C][C]0.149583[/C][C]1.2244[/C][C]0.112546[/C][/ROW]
[ROW][C]12[/C][C]-0.340062[/C][C]-2.7835[/C][C]0.003491[/C][/ROW]
[ROW][C]13[/C][C]0.104203[/C][C]0.8529[/C][C]0.198365[/C][/ROW]
[ROW][C]14[/C][C]-0.024683[/C][C]-0.202[/C][C]0.420248[/C][/ROW]
[ROW][C]15[/C][C]0.039356[/C][C]0.3221[/C][C]0.374174[/C][/ROW]
[ROW][C]16[/C][C]0.04121[/C][C]0.3373[/C][C]0.368464[/C][/ROW]
[ROW][C]17[/C][C]-0.084819[/C][C]-0.6943[/C][C]0.244957[/C][/ROW]
[ROW][C]18[/C][C]-0.034638[/C][C]-0.2835[/C][C]0.388826[/C][/ROW]
[ROW][C]19[/C][C]0.159754[/C][C]1.3076[/C][C]0.097732[/C][/ROW]
[ROW][C]20[/C][C]-0.177557[/C][C]-1.4534[/C][C]0.075395[/C][/ROW]
[ROW][C]21[/C][C]0.085732[/C][C]0.7017[/C][C]0.242633[/C][/ROW]
[ROW][C]22[/C][C]-0.106937[/C][C]-0.8753[/C][C]0.192264[/C][/ROW]
[ROW][C]23[/C][C]0.160765[/C][C]1.3159[/C][C]0.096343[/C][/ROW]
[ROW][C]24[/C][C]-0.103788[/C][C]-0.8495[/C][C]0.199303[/C][/ROW]
[ROW][C]25[/C][C]0.138818[/C][C]1.1363[/C][C]0.129945[/C][/ROW]
[ROW][C]26[/C][C]-0.168092[/C][C]-1.3759[/C][C]0.086719[/C][/ROW]
[ROW][C]27[/C][C]0.061157[/C][C]0.5006[/C][C]0.30915[/C][/ROW]
[ROW][C]28[/C][C]-0.051829[/C][C]-0.4242[/C][C]0.336375[/C][/ROW]
[ROW][C]29[/C][C]0.04262[/C][C]0.3489[/C][C]0.364144[/C][/ROW]
[ROW][C]30[/C][C]0.090689[/C][C]0.7423[/C][C]0.230244[/C][/ROW]
[ROW][C]31[/C][C]-0.094963[/C][C]-0.7773[/C][C]0.219857[/C][/ROW]
[ROW][C]32[/C][C]0.159349[/C][C]1.3043[/C][C]0.098293[/C][/ROW]
[ROW][C]33[/C][C]-0.090921[/C][C]-0.7442[/C][C]0.229673[/C][/ROW]
[ROW][C]34[/C][C]0.09572[/C][C]0.7835[/C][C]0.218047[/C][/ROW]
[ROW][C]35[/C][C]-0.178582[/C][C]-1.4618[/C][C]0.074241[/C][/ROW]
[ROW][C]36[/C][C]0.02254[/C][C]0.1845[/C][C]0.42709[/C][/ROW]
[ROW][C]37[/C][C]0.002565[/C][C]0.021[/C][C]0.491655[/C][/ROW]
[ROW][C]38[/C][C]0.099368[/C][C]0.8134[/C][C]0.209447[/C][/ROW]
[ROW][C]39[/C][C]-0.039771[/C][C]-0.3255[/C][C]0.372893[/C][/ROW]
[ROW][C]40[/C][C]0.014087[/C][C]0.1153[/C][C]0.454272[/C][/ROW]
[ROW][C]41[/C][C]0.023828[/C][C]0.195[/C][C]0.422974[/C][/ROW]
[ROW][C]42[/C][C]-0.076159[/C][C]-0.6234[/C][C]0.267572[/C][/ROW]
[ROW][C]43[/C][C]0.073549[/C][C]0.602[/C][C]0.274594[/C][/ROW]
[ROW][C]44[/C][C]-0.102235[/C][C]-0.8368[/C][C]0.202831[/C][/ROW]
[ROW][C]45[/C][C]0.041063[/C][C]0.3361[/C][C]0.368917[/C][/ROW]
[ROW][C]46[/C][C]-0.037553[/C][C]-0.3074[/C][C]0.379752[/C][/ROW]
[ROW][C]47[/C][C]0.058935[/C][C]0.4824[/C][C]0.315546[/C][/ROW]
[ROW][C]48[/C][C]0.031594[/C][C]0.2586[/C][C]0.398366[/C][/ROW]
[/TABLE]
Source: https://freestatistics.org/blog/index.php?pk=229659&T=1

Globally Unique Identifier (entire table): ba.freestatistics.org/blog/index.php?pk=229659&T=1

As an alternative you can also use a QR Code:  

The GUIDs for individual cells are displayed in the table below:

Autocorrelation Function
Time lag kACF(k)T-STATP-value
1-0.460995-3.77340.000172
20.1988851.62790.054116
3-0.24417-1.99860.024855
40.0925740.75770.225629
50.0070340.05760.477127
6-0.01968-0.16110.436253
7-0.045384-0.37150.355724
8-0.006668-0.05460.478317
90.1779971.4570.074898
10-0.12617-1.03270.152717
110.1495831.22440.112546
12-0.340062-2.78350.003491
130.1042030.85290.198365
14-0.024683-0.2020.420248
150.0393560.32210.374174
160.041210.33730.368464
17-0.084819-0.69430.244957
18-0.034638-0.28350.388826
190.1597541.30760.097732
20-0.177557-1.45340.075395
210.0857320.70170.242633
22-0.106937-0.87530.192264
230.1607651.31590.096343
24-0.103788-0.84950.199303
250.1388181.13630.129945
26-0.168092-1.37590.086719
270.0611570.50060.30915
28-0.051829-0.42420.336375
290.042620.34890.364144
300.0906890.74230.230244
31-0.094963-0.77730.219857
320.1593491.30430.098293
33-0.090921-0.74420.229673
340.095720.78350.218047
35-0.178582-1.46180.074241
360.022540.18450.42709
370.0025650.0210.491655
380.0993680.81340.209447
39-0.039771-0.32550.372893
400.0140870.11530.454272
410.0238280.1950.422974
42-0.076159-0.62340.267572
430.0735490.6020.274594
44-0.102235-0.83680.202831
450.0410630.33610.368917
46-0.037553-0.30740.379752
470.0589350.48240.315546
480.0315940.25860.398366


Partial Autocorrelation Function
Time lag kPACF(k)T-STATP-value
1-0.460995-3.77340.000172
2-0.017311-0.14170.443873
3-0.201815-1.65190.051615
4-0.123888-1.01410.1571
50.0229040.18750.425925
6-0.047145-0.38590.350398
7-0.107554-0.88040.190903
8-0.067112-0.54930.292301
90.1888371.54570.063445
100.0059680.04880.480593
110.1137490.93110.177578
12-0.218323-1.78710.039226
13-0.236513-1.93590.028548
14-0.0626-0.51240.305027
15-0.090041-0.7370.231842
160.0224930.18410.427241
17-0.054839-0.44890.327485
18-0.214252-1.75370.042025
190.0827510.67730.25026
20-0.160041-1.310.097336
210.0085350.06990.472256
22-0.031239-0.25570.399483
230.1080680.88460.189776
24-0.132333-1.08320.141302
25-0.031214-0.25550.399562
26-0.066605-0.54520.293717
27-0.147391-1.20640.115944
28-0.093068-0.76180.224428
29-0.046617-0.38160.351993
30-0.01717-0.14050.444328
310.0376030.30780.379597
320.0446690.36560.357895
330.1125170.9210.180179
340.0431860.35350.362415
35-0.052693-0.43130.333813
36-0.146003-1.19510.118133
37-0.006379-0.05220.479257
38-0.006652-0.05440.47837
39-0.060536-0.49550.310931
40-0.026342-0.21560.414969
410.018720.15320.439337
42-0.095286-0.77990.219084
430.1127810.92320.17962
440.0379850.31090.378414
450.1029430.84260.201219
46-0.018792-0.15380.439108
470.0018350.0150.494029
48-0.03981-0.32590.372773

\begin{tabular}{lllllllll}
\hline
Partial Autocorrelation Function \tabularnewline
Time lag k & PACF(k) & T-STAT & P-value \tabularnewline
1 & -0.460995 & -3.7734 & 0.000172 \tabularnewline
2 & -0.017311 & -0.1417 & 0.443873 \tabularnewline
3 & -0.201815 & -1.6519 & 0.051615 \tabularnewline
4 & -0.123888 & -1.0141 & 0.1571 \tabularnewline
5 & 0.022904 & 0.1875 & 0.425925 \tabularnewline
6 & -0.047145 & -0.3859 & 0.350398 \tabularnewline
7 & -0.107554 & -0.8804 & 0.190903 \tabularnewline
8 & -0.067112 & -0.5493 & 0.292301 \tabularnewline
9 & 0.188837 & 1.5457 & 0.063445 \tabularnewline
10 & 0.005968 & 0.0488 & 0.480593 \tabularnewline
11 & 0.113749 & 0.9311 & 0.177578 \tabularnewline
12 & -0.218323 & -1.7871 & 0.039226 \tabularnewline
13 & -0.236513 & -1.9359 & 0.028548 \tabularnewline
14 & -0.0626 & -0.5124 & 0.305027 \tabularnewline
15 & -0.090041 & -0.737 & 0.231842 \tabularnewline
16 & 0.022493 & 0.1841 & 0.427241 \tabularnewline
17 & -0.054839 & -0.4489 & 0.327485 \tabularnewline
18 & -0.214252 & -1.7537 & 0.042025 \tabularnewline
19 & 0.082751 & 0.6773 & 0.25026 \tabularnewline
20 & -0.160041 & -1.31 & 0.097336 \tabularnewline
21 & 0.008535 & 0.0699 & 0.472256 \tabularnewline
22 & -0.031239 & -0.2557 & 0.399483 \tabularnewline
23 & 0.108068 & 0.8846 & 0.189776 \tabularnewline
24 & -0.132333 & -1.0832 & 0.141302 \tabularnewline
25 & -0.031214 & -0.2555 & 0.399562 \tabularnewline
26 & -0.066605 & -0.5452 & 0.293717 \tabularnewline
27 & -0.147391 & -1.2064 & 0.115944 \tabularnewline
28 & -0.093068 & -0.7618 & 0.224428 \tabularnewline
29 & -0.046617 & -0.3816 & 0.351993 \tabularnewline
30 & -0.01717 & -0.1405 & 0.444328 \tabularnewline
31 & 0.037603 & 0.3078 & 0.379597 \tabularnewline
32 & 0.044669 & 0.3656 & 0.357895 \tabularnewline
33 & 0.112517 & 0.921 & 0.180179 \tabularnewline
34 & 0.043186 & 0.3535 & 0.362415 \tabularnewline
35 & -0.052693 & -0.4313 & 0.333813 \tabularnewline
36 & -0.146003 & -1.1951 & 0.118133 \tabularnewline
37 & -0.006379 & -0.0522 & 0.479257 \tabularnewline
38 & -0.006652 & -0.0544 & 0.47837 \tabularnewline
39 & -0.060536 & -0.4955 & 0.310931 \tabularnewline
40 & -0.026342 & -0.2156 & 0.414969 \tabularnewline
41 & 0.01872 & 0.1532 & 0.439337 \tabularnewline
42 & -0.095286 & -0.7799 & 0.219084 \tabularnewline
43 & 0.112781 & 0.9232 & 0.17962 \tabularnewline
44 & 0.037985 & 0.3109 & 0.378414 \tabularnewline
45 & 0.102943 & 0.8426 & 0.201219 \tabularnewline
46 & -0.018792 & -0.1538 & 0.439108 \tabularnewline
47 & 0.001835 & 0.015 & 0.494029 \tabularnewline
48 & -0.03981 & -0.3259 & 0.372773 \tabularnewline
\hline
\end{tabular}
%Source: https://freestatistics.org/blog/index.php?pk=229659&T=2

[TABLE]
[ROW][C]Partial Autocorrelation Function[/C][/ROW]
[ROW][C]Time lag k[/C][C]PACF(k)[/C][C]T-STAT[/C][C]P-value[/C][/ROW]
[ROW][C]1[/C][C]-0.460995[/C][C]-3.7734[/C][C]0.000172[/C][/ROW]
[ROW][C]2[/C][C]-0.017311[/C][C]-0.1417[/C][C]0.443873[/C][/ROW]
[ROW][C]3[/C][C]-0.201815[/C][C]-1.6519[/C][C]0.051615[/C][/ROW]
[ROW][C]4[/C][C]-0.123888[/C][C]-1.0141[/C][C]0.1571[/C][/ROW]
[ROW][C]5[/C][C]0.022904[/C][C]0.1875[/C][C]0.425925[/C][/ROW]
[ROW][C]6[/C][C]-0.047145[/C][C]-0.3859[/C][C]0.350398[/C][/ROW]
[ROW][C]7[/C][C]-0.107554[/C][C]-0.8804[/C][C]0.190903[/C][/ROW]
[ROW][C]8[/C][C]-0.067112[/C][C]-0.5493[/C][C]0.292301[/C][/ROW]
[ROW][C]9[/C][C]0.188837[/C][C]1.5457[/C][C]0.063445[/C][/ROW]
[ROW][C]10[/C][C]0.005968[/C][C]0.0488[/C][C]0.480593[/C][/ROW]
[ROW][C]11[/C][C]0.113749[/C][C]0.9311[/C][C]0.177578[/C][/ROW]
[ROW][C]12[/C][C]-0.218323[/C][C]-1.7871[/C][C]0.039226[/C][/ROW]
[ROW][C]13[/C][C]-0.236513[/C][C]-1.9359[/C][C]0.028548[/C][/ROW]
[ROW][C]14[/C][C]-0.0626[/C][C]-0.5124[/C][C]0.305027[/C][/ROW]
[ROW][C]15[/C][C]-0.090041[/C][C]-0.737[/C][C]0.231842[/C][/ROW]
[ROW][C]16[/C][C]0.022493[/C][C]0.1841[/C][C]0.427241[/C][/ROW]
[ROW][C]17[/C][C]-0.054839[/C][C]-0.4489[/C][C]0.327485[/C][/ROW]
[ROW][C]18[/C][C]-0.214252[/C][C]-1.7537[/C][C]0.042025[/C][/ROW]
[ROW][C]19[/C][C]0.082751[/C][C]0.6773[/C][C]0.25026[/C][/ROW]
[ROW][C]20[/C][C]-0.160041[/C][C]-1.31[/C][C]0.097336[/C][/ROW]
[ROW][C]21[/C][C]0.008535[/C][C]0.0699[/C][C]0.472256[/C][/ROW]
[ROW][C]22[/C][C]-0.031239[/C][C]-0.2557[/C][C]0.399483[/C][/ROW]
[ROW][C]23[/C][C]0.108068[/C][C]0.8846[/C][C]0.189776[/C][/ROW]
[ROW][C]24[/C][C]-0.132333[/C][C]-1.0832[/C][C]0.141302[/C][/ROW]
[ROW][C]25[/C][C]-0.031214[/C][C]-0.2555[/C][C]0.399562[/C][/ROW]
[ROW][C]26[/C][C]-0.066605[/C][C]-0.5452[/C][C]0.293717[/C][/ROW]
[ROW][C]27[/C][C]-0.147391[/C][C]-1.2064[/C][C]0.115944[/C][/ROW]
[ROW][C]28[/C][C]-0.093068[/C][C]-0.7618[/C][C]0.224428[/C][/ROW]
[ROW][C]29[/C][C]-0.046617[/C][C]-0.3816[/C][C]0.351993[/C][/ROW]
[ROW][C]30[/C][C]-0.01717[/C][C]-0.1405[/C][C]0.444328[/C][/ROW]
[ROW][C]31[/C][C]0.037603[/C][C]0.3078[/C][C]0.379597[/C][/ROW]
[ROW][C]32[/C][C]0.044669[/C][C]0.3656[/C][C]0.357895[/C][/ROW]
[ROW][C]33[/C][C]0.112517[/C][C]0.921[/C][C]0.180179[/C][/ROW]
[ROW][C]34[/C][C]0.043186[/C][C]0.3535[/C][C]0.362415[/C][/ROW]
[ROW][C]35[/C][C]-0.052693[/C][C]-0.4313[/C][C]0.333813[/C][/ROW]
[ROW][C]36[/C][C]-0.146003[/C][C]-1.1951[/C][C]0.118133[/C][/ROW]
[ROW][C]37[/C][C]-0.006379[/C][C]-0.0522[/C][C]0.479257[/C][/ROW]
[ROW][C]38[/C][C]-0.006652[/C][C]-0.0544[/C][C]0.47837[/C][/ROW]
[ROW][C]39[/C][C]-0.060536[/C][C]-0.4955[/C][C]0.310931[/C][/ROW]
[ROW][C]40[/C][C]-0.026342[/C][C]-0.2156[/C][C]0.414969[/C][/ROW]
[ROW][C]41[/C][C]0.01872[/C][C]0.1532[/C][C]0.439337[/C][/ROW]
[ROW][C]42[/C][C]-0.095286[/C][C]-0.7799[/C][C]0.219084[/C][/ROW]
[ROW][C]43[/C][C]0.112781[/C][C]0.9232[/C][C]0.17962[/C][/ROW]
[ROW][C]44[/C][C]0.037985[/C][C]0.3109[/C][C]0.378414[/C][/ROW]
[ROW][C]45[/C][C]0.102943[/C][C]0.8426[/C][C]0.201219[/C][/ROW]
[ROW][C]46[/C][C]-0.018792[/C][C]-0.1538[/C][C]0.439108[/C][/ROW]
[ROW][C]47[/C][C]0.001835[/C][C]0.015[/C][C]0.494029[/C][/ROW]
[ROW][C]48[/C][C]-0.03981[/C][C]-0.3259[/C][C]0.372773[/C][/ROW]
[/TABLE]
Source: https://freestatistics.org/blog/index.php?pk=229659&T=2

Globally Unique Identifier (entire table): ba.freestatistics.org/blog/index.php?pk=229659&T=2

As an alternative you can also use a QR Code:  

The GUIDs for individual cells are displayed in the table below:

Partial Autocorrelation Function
Time lag kPACF(k)T-STATP-value
1-0.460995-3.77340.000172
2-0.017311-0.14170.443873
3-0.201815-1.65190.051615
4-0.123888-1.01410.1571
50.0229040.18750.425925
6-0.047145-0.38590.350398
7-0.107554-0.88040.190903
8-0.067112-0.54930.292301
90.1888371.54570.063445
100.0059680.04880.480593
110.1137490.93110.177578
12-0.218323-1.78710.039226
13-0.236513-1.93590.028548
14-0.0626-0.51240.305027
15-0.090041-0.7370.231842
160.0224930.18410.427241
17-0.054839-0.44890.327485
18-0.214252-1.75370.042025
190.0827510.67730.25026
20-0.160041-1.310.097336
210.0085350.06990.472256
22-0.031239-0.25570.399483
230.1080680.88460.189776
24-0.132333-1.08320.141302
25-0.031214-0.25550.399562
26-0.066605-0.54520.293717
27-0.147391-1.20640.115944
28-0.093068-0.76180.224428
29-0.046617-0.38160.351993
30-0.01717-0.14050.444328
310.0376030.30780.379597
320.0446690.36560.357895
330.1125170.9210.180179
340.0431860.35350.362415
35-0.052693-0.43130.333813
36-0.146003-1.19510.118133
37-0.006379-0.05220.479257
38-0.006652-0.05440.47837
39-0.060536-0.49550.310931
40-0.026342-0.21560.414969
410.018720.15320.439337
42-0.095286-0.77990.219084
430.1127810.92320.17962
440.0379850.31090.378414
450.1029430.84260.201219
46-0.018792-0.15380.439108
470.0018350.0150.494029
48-0.03981-0.32590.372773


Parameters (Session):
par1 = 48 ; par2 = 1 ; par3 = 1 ; par4 = 1 ; par5 = 12 ; par6 = White Noise ; par7 = 0.95 ;
Parameters (R input):
par1 = 48 ; par2 = 1 ; par3 = 1 ; par4 = 1 ; par5 = 12 ; par6 = White Noise ; par7 = 0.95 ; par8 = ;
R code (references can be found in the software module):
if (par1 == 'Default') {
par1 = 10*log10(length(x))
} else {
par1 <- as.numeric(par1)
}
par2 <- as.numeric(par2)
par3 <- as.numeric(par3)
par4 <- as.numeric(par4)
par5 <- as.numeric(par5)
if (par6 == 'White Noise') par6 <- 'white' else par6 <- 'ma'
par7 <- as.numeric(par7)
if (par8 != '') par8 <- as.numeric(par8)
ox <- x
if (par8 == '') {
if (par2 == 0) {
x <- log(x)
} else {
x <- (x ^ par2 - 1) / par2
}
} else {
x <- log(x,base=par8)
}
if (par3 > 0) x <- diff(x,lag=1,difference=par3)
if (par4 > 0) x <- diff(x,lag=par5,difference=par4)
bitmap(file='picts.png')
op <- par(mfrow=c(2,1))
plot(ox,type='l',main='Original Time Series',xlab='time',ylab='value')
if (par8=='') {
mytitle <- paste('Working Time Series (lambda=',par2,', d=',par3,', D=',par4,')',sep='')
mysub <- paste('(lambda=',par2,', d=',par3,', D=',par4,', CI=', par7, ', CI type=',par6,')',sep='')
} else {
mytitle <- paste('Working Time Series (base=',par8,', d=',par3,', D=',par4,')',sep='')
mysub <- paste('(base=',par8,', d=',par3,', D=',par4,', CI=', par7, ', CI type=',par6,')',sep='')
}
plot(x,type='l', main=mytitle,xlab='time',ylab='value')
par(op)
dev.off()
bitmap(file='pic1.png')
racf <- acf(x, par1, main='Autocorrelation', xlab='time lag', ylab='ACF', ci.type=par6, ci=par7, sub=mysub)
dev.off()
bitmap(file='pic2.png')
rpacf <- pacf(x,par1,main='Partial Autocorrelation',xlab='lags',ylab='PACF',sub=mysub)
dev.off()
(myacf <- c(racf$acf))
(mypacf <- c(rpacf$acf))
lengthx <- length(x)
sqrtn <- sqrt(lengthx)
load(file='createtable')
a<-table.start()
a<-table.row.start(a)
a<-table.element(a,'Autocorrelation Function',4,TRUE)
a<-table.row.end(a)
a<-table.row.start(a)
a<-table.element(a,'Time lag k',header=TRUE)
a<-table.element(a,hyperlink('basics.htm','ACF(k)','click here for more information about the Autocorrelation Function'),header=TRUE)
a<-table.element(a,'T-STAT',header=TRUE)
a<-table.element(a,'P-value',header=TRUE)
a<-table.row.end(a)
for (i in 2:(par1+1)) {
a<-table.row.start(a)
a<-table.element(a,i-1,header=TRUE)
a<-table.element(a,round(myacf[i],6))
mytstat <- myacf[i]*sqrtn
a<-table.element(a,round(mytstat,4))
a<-table.element(a,round(1-pt(abs(mytstat),lengthx),6))
a<-table.row.end(a)
}
a<-table.end(a)
table.save(a,file='mytable.tab')
a<-table.start()
a<-table.row.start(a)
a<-table.element(a,'Partial Autocorrelation Function',4,TRUE)
a<-table.row.end(a)
a<-table.row.start(a)
a<-table.element(a,'Time lag k',header=TRUE)
a<-table.element(a,hyperlink('basics.htm','PACF(k)','click here for more information about the Partial Autocorrelation Function'),header=TRUE)
a<-table.element(a,'T-STAT',header=TRUE)
a<-table.element(a,'P-value',header=TRUE)
a<-table.row.end(a)
for (i in 1:par1) {
a<-table.row.start(a)
a<-table.element(a,i,header=TRUE)
a<-table.element(a,round(mypacf[i],6))
mytstat <- mypacf[i]*sqrtn
a<-table.element(a,round(mytstat,4))
a<-table.element(a,round(1-pt(abs(mytstat),lengthx),6))
a<-table.row.end(a)
}
a<-table.end(a)
table.save(a,file='mytable1.tab')