\begin{tabular}{lllllllll}
\hline
Summary of computational transaction \tabularnewline
Raw Input & view raw input (R code)  \tabularnewline
Raw Output & view raw output of R engine  \tabularnewline
Computing time & 2 seconds \tabularnewline
R Server & 'Sir Maurice George Kendall' @ kendall.wessa.net \tabularnewline
\hline
\end{tabular}
%Source: https://freestatistics.org/blog/index.php?pk=213132&T=0
[TABLE]
[ROW][C]Summary of computational transaction[/C][/ROW]
[ROW][C]Raw Input[/C][C]view raw input (R code) [/C][/ROW]
[ROW][C]Raw Output[/C][C]view raw output of R engine [/C][/ROW]
[ROW][C]Computing time[/C][C]2 seconds[/C][/ROW]
[ROW][C]R Server[/C][C]'Sir Maurice George Kendall' @ kendall.wessa.net[/C][/ROW]
[/TABLE]
Source: https://freestatistics.org/blog/index.php?pk=213132&T=0
If you paste this QR Code into your document, anyone with a smartphone or tablet will be able to scan it and view this table in a browser.
If you paste this QR Code into your document, anyone with a smartphone or tablet will be able to scan it and view this table in a browser.
If you paste this QR Code into your document, anyone with a smartphone or tablet will be able to scan it and view this table in a browser.
If you paste this QR Code into your document, anyone with a smartphone or tablet will be able to scan it and view this table in a browser.
If you paste this QR Code into your document, anyone with a smartphone or tablet will be able to scan it and view this table in a browser.
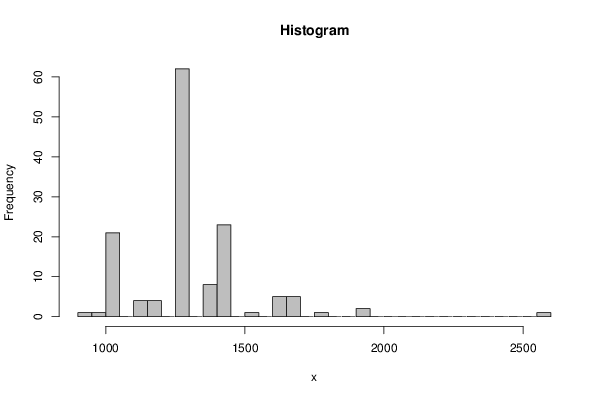
| Frequency Table (Histogram) | | Bins | Midpoint | Abs. Frequency | Rel. Frequency | Cumul. Rel. Freq. | Density | | [900,950[ | 925 | 1 | 0.007194 | 0.007194 | 0.000144 | | [950,1000[ | 975 | 1 | 0.007194 | 0.014388 | 0.000144 | | [1000,1050[ | 1025 | 21 | 0.151079 | 0.165468 | 0.003022 | | [1050,1100[ | 1075 | 0 | 0 | 0.165468 | 0 | | [1100,1150[ | 1125 | 4 | 0.028777 | 0.194245 | 0.000576 | | [1150,1200[ | 1175 | 4 | 0.028777 | 0.223022 | 0.000576 | | [1200,1250[ | 1225 | 0 | 0 | 0.223022 | 0 | | [1250,1300[ | 1275 | 62 | 0.446043 | 0.669065 | 0.008921 | | [1300,1350[ | 1325 | 0 | 0 | 0.669065 | 0 | | [1350,1400[ | 1375 | 8 | 0.057554 | 0.726619 | 0.001151 | | [1400,1450[ | 1425 | 23 | 0.165468 | 0.892086 | 0.003309 | | [1450,1500[ | 1475 | 0 | 0 | 0.892086 | 0 | | [1500,1550[ | 1525 | 1 | 0.007194 | 0.899281 | 0.000144 | | [1550,1600[ | 1575 | 0 | 0 | 0.899281 | 0 | | [1600,1650[ | 1625 | 5 | 0.035971 | 0.935252 | 0.000719 | | [1650,1700[ | 1675 | 5 | 0.035971 | 0.971223 | 0.000719 | | [1700,1750[ | 1725 | 0 | 0 | 0.971223 | 0 | | [1750,1800[ | 1775 | 1 | 0.007194 | 0.978417 | 0.000144 | | [1800,1850[ | 1825 | 0 | 0 | 0.978417 | 0 | | [1850,1900[ | 1875 | 0 | 0 | 0.978417 | 0 | | [1900,1950[ | 1925 | 2 | 0.014388 | 0.992806 | 0.000288 | | [1950,2000[ | 1975 | 0 | 0 | 0.992806 | 0 | | [2000,2050[ | 2025 | 0 | 0 | 0.992806 | 0 | | [2050,2100[ | 2075 | 0 | 0 | 0.992806 | 0 | | [2100,2150[ | 2125 | 0 | 0 | 0.992806 | 0 | | [2150,2200[ | 2175 | 0 | 0 | 0.992806 | 0 | | [2200,2250[ | 2225 | 0 | 0 | 0.992806 | 0 | | [2250,2300[ | 2275 | 0 | 0 | 0.992806 | 0 | | [2300,2350[ | 2325 | 0 | 0 | 0.992806 | 0 | | [2350,2400[ | 2375 | 0 | 0 | 0.992806 | 0 | | [2400,2450[ | 2425 | 0 | 0 | 0.992806 | 0 | | [2450,2500[ | 2475 | 0 | 0 | 0.992806 | 0 | | [2500,2550[ | 2525 | 0 | 0 | 0.992806 | 0 | | [2550,2600] | 2575 | 1 | 0.007194 | 1 | 0.000144 |
\begin{tabular}{lllllllll}
\hline
Frequency Table (Histogram) \tabularnewline
Bins & Midpoint & Abs. Frequency & Rel. Frequency & Cumul. Rel. Freq. & Density \tabularnewline
[900,950[ & 925 & 1 & 0.007194 & 0.007194 & 0.000144 \tabularnewline
[950,1000[ & 975 & 1 & 0.007194 & 0.014388 & 0.000144 \tabularnewline
[1000,1050[ & 1025 & 21 & 0.151079 & 0.165468 & 0.003022 \tabularnewline
[1050,1100[ & 1075 & 0 & 0 & 0.165468 & 0 \tabularnewline
[1100,1150[ & 1125 & 4 & 0.028777 & 0.194245 & 0.000576 \tabularnewline
[1150,1200[ & 1175 & 4 & 0.028777 & 0.223022 & 0.000576 \tabularnewline
[1200,1250[ & 1225 & 0 & 0 & 0.223022 & 0 \tabularnewline
[1250,1300[ & 1275 & 62 & 0.446043 & 0.669065 & 0.008921 \tabularnewline
[1300,1350[ & 1325 & 0 & 0 & 0.669065 & 0 \tabularnewline
[1350,1400[ & 1375 & 8 & 0.057554 & 0.726619 & 0.001151 \tabularnewline
[1400,1450[ & 1425 & 23 & 0.165468 & 0.892086 & 0.003309 \tabularnewline
[1450,1500[ & 1475 & 0 & 0 & 0.892086 & 0 \tabularnewline
[1500,1550[ & 1525 & 1 & 0.007194 & 0.899281 & 0.000144 \tabularnewline
[1550,1600[ & 1575 & 0 & 0 & 0.899281 & 0 \tabularnewline
[1600,1650[ & 1625 & 5 & 0.035971 & 0.935252 & 0.000719 \tabularnewline
[1650,1700[ & 1675 & 5 & 0.035971 & 0.971223 & 0.000719 \tabularnewline
[1700,1750[ & 1725 & 0 & 0 & 0.971223 & 0 \tabularnewline
[1750,1800[ & 1775 & 1 & 0.007194 & 0.978417 & 0.000144 \tabularnewline
[1800,1850[ & 1825 & 0 & 0 & 0.978417 & 0 \tabularnewline
[1850,1900[ & 1875 & 0 & 0 & 0.978417 & 0 \tabularnewline
[1900,1950[ & 1925 & 2 & 0.014388 & 0.992806 & 0.000288 \tabularnewline
[1950,2000[ & 1975 & 0 & 0 & 0.992806 & 0 \tabularnewline
[2000,2050[ & 2025 & 0 & 0 & 0.992806 & 0 \tabularnewline
[2050,2100[ & 2075 & 0 & 0 & 0.992806 & 0 \tabularnewline
[2100,2150[ & 2125 & 0 & 0 & 0.992806 & 0 \tabularnewline
[2150,2200[ & 2175 & 0 & 0 & 0.992806 & 0 \tabularnewline
[2200,2250[ & 2225 & 0 & 0 & 0.992806 & 0 \tabularnewline
[2250,2300[ & 2275 & 0 & 0 & 0.992806 & 0 \tabularnewline
[2300,2350[ & 2325 & 0 & 0 & 0.992806 & 0 \tabularnewline
[2350,2400[ & 2375 & 0 & 0 & 0.992806 & 0 \tabularnewline
[2400,2450[ & 2425 & 0 & 0 & 0.992806 & 0 \tabularnewline
[2450,2500[ & 2475 & 0 & 0 & 0.992806 & 0 \tabularnewline
[2500,2550[ & 2525 & 0 & 0 & 0.992806 & 0 \tabularnewline
[2550,2600] & 2575 & 1 & 0.007194 & 1 & 0.000144 \tabularnewline
\hline
\end{tabular}
%Source: https://freestatistics.org/blog/index.php?pk=213132&T=1
[TABLE]
[ROW][C]Frequency Table (Histogram)[/C][/ROW]
[ROW][C]Bins[/C][C]Midpoint[/C][C]Abs. Frequency[/C][C]Rel. Frequency[/C][C]Cumul. Rel. Freq.[/C][C]Density[/C][/ROW]
[ROW][C][900,950[[/C][C]925[/C][C]1[/C][C]0.007194[/C][C]0.007194[/C][C]0.000144[/C][/ROW]
[ROW][C][950,1000[[/C][C]975[/C][C]1[/C][C]0.007194[/C][C]0.014388[/C][C]0.000144[/C][/ROW]
[ROW][C][1000,1050[[/C][C]1025[/C][C]21[/C][C]0.151079[/C][C]0.165468[/C][C]0.003022[/C][/ROW]
[ROW][C][1050,1100[[/C][C]1075[/C][C]0[/C][C]0[/C][C]0.165468[/C][C]0[/C][/ROW]
[ROW][C][1100,1150[[/C][C]1125[/C][C]4[/C][C]0.028777[/C][C]0.194245[/C][C]0.000576[/C][/ROW]
[ROW][C][1150,1200[[/C][C]1175[/C][C]4[/C][C]0.028777[/C][C]0.223022[/C][C]0.000576[/C][/ROW]
[ROW][C][1200,1250[[/C][C]1225[/C][C]0[/C][C]0[/C][C]0.223022[/C][C]0[/C][/ROW]
[ROW][C][1250,1300[[/C][C]1275[/C][C]62[/C][C]0.446043[/C][C]0.669065[/C][C]0.008921[/C][/ROW]
[ROW][C][1300,1350[[/C][C]1325[/C][C]0[/C][C]0[/C][C]0.669065[/C][C]0[/C][/ROW]
[ROW][C][1350,1400[[/C][C]1375[/C][C]8[/C][C]0.057554[/C][C]0.726619[/C][C]0.001151[/C][/ROW]
[ROW][C][1400,1450[[/C][C]1425[/C][C]23[/C][C]0.165468[/C][C]0.892086[/C][C]0.003309[/C][/ROW]
[ROW][C][1450,1500[[/C][C]1475[/C][C]0[/C][C]0[/C][C]0.892086[/C][C]0[/C][/ROW]
[ROW][C][1500,1550[[/C][C]1525[/C][C]1[/C][C]0.007194[/C][C]0.899281[/C][C]0.000144[/C][/ROW]
[ROW][C][1550,1600[[/C][C]1575[/C][C]0[/C][C]0[/C][C]0.899281[/C][C]0[/C][/ROW]
[ROW][C][1600,1650[[/C][C]1625[/C][C]5[/C][C]0.035971[/C][C]0.935252[/C][C]0.000719[/C][/ROW]
[ROW][C][1650,1700[[/C][C]1675[/C][C]5[/C][C]0.035971[/C][C]0.971223[/C][C]0.000719[/C][/ROW]
[ROW][C][1700,1750[[/C][C]1725[/C][C]0[/C][C]0[/C][C]0.971223[/C][C]0[/C][/ROW]
[ROW][C][1750,1800[[/C][C]1775[/C][C]1[/C][C]0.007194[/C][C]0.978417[/C][C]0.000144[/C][/ROW]
[ROW][C][1800,1850[[/C][C]1825[/C][C]0[/C][C]0[/C][C]0.978417[/C][C]0[/C][/ROW]
[ROW][C][1850,1900[[/C][C]1875[/C][C]0[/C][C]0[/C][C]0.978417[/C][C]0[/C][/ROW]
[ROW][C][1900,1950[[/C][C]1925[/C][C]2[/C][C]0.014388[/C][C]0.992806[/C][C]0.000288[/C][/ROW]
[ROW][C][1950,2000[[/C][C]1975[/C][C]0[/C][C]0[/C][C]0.992806[/C][C]0[/C][/ROW]
[ROW][C][2000,2050[[/C][C]2025[/C][C]0[/C][C]0[/C][C]0.992806[/C][C]0[/C][/ROW]
[ROW][C][2050,2100[[/C][C]2075[/C][C]0[/C][C]0[/C][C]0.992806[/C][C]0[/C][/ROW]
[ROW][C][2100,2150[[/C][C]2125[/C][C]0[/C][C]0[/C][C]0.992806[/C][C]0[/C][/ROW]
[ROW][C][2150,2200[[/C][C]2175[/C][C]0[/C][C]0[/C][C]0.992806[/C][C]0[/C][/ROW]
[ROW][C][2200,2250[[/C][C]2225[/C][C]0[/C][C]0[/C][C]0.992806[/C][C]0[/C][/ROW]
[ROW][C][2250,2300[[/C][C]2275[/C][C]0[/C][C]0[/C][C]0.992806[/C][C]0[/C][/ROW]
[ROW][C][2300,2350[[/C][C]2325[/C][C]0[/C][C]0[/C][C]0.992806[/C][C]0[/C][/ROW]
[ROW][C][2350,2400[[/C][C]2375[/C][C]0[/C][C]0[/C][C]0.992806[/C][C]0[/C][/ROW]
[ROW][C][2400,2450[[/C][C]2425[/C][C]0[/C][C]0[/C][C]0.992806[/C][C]0[/C][/ROW]
[ROW][C][2450,2500[[/C][C]2475[/C][C]0[/C][C]0[/C][C]0.992806[/C][C]0[/C][/ROW]
[ROW][C][2500,2550[[/C][C]2525[/C][C]0[/C][C]0[/C][C]0.992806[/C][C]0[/C][/ROW]
[ROW][C][2550,2600][/C][C]2575[/C][C]1[/C][C]0.007194[/C][C]1[/C][C]0.000144[/C][/ROW]
[/TABLE]
Source: https://freestatistics.org/blog/index.php?pk=213132&T=1
Globally Unique Identifier (entire table): ba.freestatistics.org/blog/index.php?pk=213132&T=1
As an alternative you can also use a QR Code:
The GUIDs for individual cells are displayed in the table below:
| Frequency Table (Histogram) | | Bins | Midpoint | Abs. Frequency | Rel. Frequency | Cumul. Rel. Freq. | Density | | [900,950[ | 925 | 1 | 0.007194 | 0.007194 | 0.000144 | | [950,1000[ | 975 | 1 | 0.007194 | 0.014388 | 0.000144 | | [1000,1050[ | 1025 | 21 | 0.151079 | 0.165468 | 0.003022 | | [1050,1100[ | 1075 | 0 | 0 | 0.165468 | 0 | | [1100,1150[ | 1125 | 4 | 0.028777 | 0.194245 | 0.000576 | | [1150,1200[ | 1175 | 4 | 0.028777 | 0.223022 | 0.000576 | | [1200,1250[ | 1225 | 0 | 0 | 0.223022 | 0 | | [1250,1300[ | 1275 | 62 | 0.446043 | 0.669065 | 0.008921 | | [1300,1350[ | 1325 | 0 | 0 | 0.669065 | 0 | | [1350,1400[ | 1375 | 8 | 0.057554 | 0.726619 | 0.001151 | | [1400,1450[ | 1425 | 23 | 0.165468 | 0.892086 | 0.003309 | | [1450,1500[ | 1475 | 0 | 0 | 0.892086 | 0 | | [1500,1550[ | 1525 | 1 | 0.007194 | 0.899281 | 0.000144 | | [1550,1600[ | 1575 | 0 | 0 | 0.899281 | 0 | | [1600,1650[ | 1625 | 5 | 0.035971 | 0.935252 | 0.000719 | | [1650,1700[ | 1675 | 5 | 0.035971 | 0.971223 | 0.000719 | | [1700,1750[ | 1725 | 0 | 0 | 0.971223 | 0 | | [1750,1800[ | 1775 | 1 | 0.007194 | 0.978417 | 0.000144 | | [1800,1850[ | 1825 | 0 | 0 | 0.978417 | 0 | | [1850,1900[ | 1875 | 0 | 0 | 0.978417 | 0 | | [1900,1950[ | 1925 | 2 | 0.014388 | 0.992806 | 0.000288 | | [1950,2000[ | 1975 | 0 | 0 | 0.992806 | 0 | | [2000,2050[ | 2025 | 0 | 0 | 0.992806 | 0 | | [2050,2100[ | 2075 | 0 | 0 | 0.992806 | 0 | | [2100,2150[ | 2125 | 0 | 0 | 0.992806 | 0 | | [2150,2200[ | 2175 | 0 | 0 | 0.992806 | 0 | | [2200,2250[ | 2225 | 0 | 0 | 0.992806 | 0 | | [2250,2300[ | 2275 | 0 | 0 | 0.992806 | 0 | | [2300,2350[ | 2325 | 0 | 0 | 0.992806 | 0 | | [2350,2400[ | 2375 | 0 | 0 | 0.992806 | 0 | | [2400,2450[ | 2425 | 0 | 0 | 0.992806 | 0 | | [2450,2500[ | 2475 | 0 | 0 | 0.992806 | 0 | | [2500,2550[ | 2525 | 0 | 0 | 0.992806 | 0 | | [2550,2600] | 2575 | 1 | 0.007194 | 1 | 0.000144 |
If you paste this QR Code into your document, anyone with a smartphone or tablet will be able to scan it and view this table in a browser.
If you paste this QR Code into your document, anyone with a smartphone or tablet will be able to scan it and view this table in a browser.
If you paste this QR Code into your document, anyone with a smartphone or tablet will be able to scan it and view this table in a browser.
If you paste this QR Code into your document, anyone with a smartphone or tablet will be able to scan it and view this table in a browser.
If you paste this QR Code into your document, anyone with a smartphone or tablet will be able to scan it and view this table in a browser.
|