Free Statistics
of Irreproducible Research!
Description of Statistical Computation | |||||||||||||||||||||
|---|---|---|---|---|---|---|---|---|---|---|---|---|---|---|---|---|---|---|---|---|---|
| Author's title | |||||||||||||||||||||
| Author | *The author of this computation has been verified* | ||||||||||||||||||||
| R Software Module | rwasp_cloud.wasp | ||||||||||||||||||||
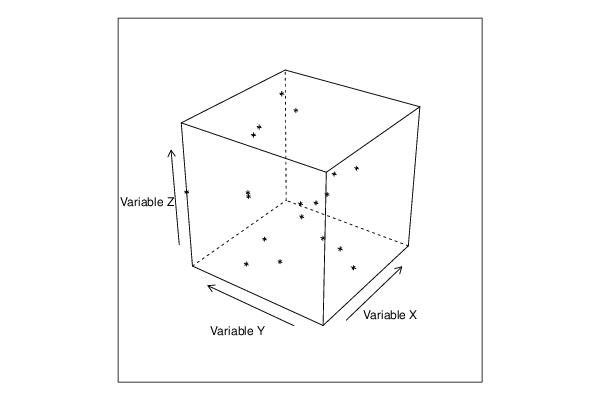
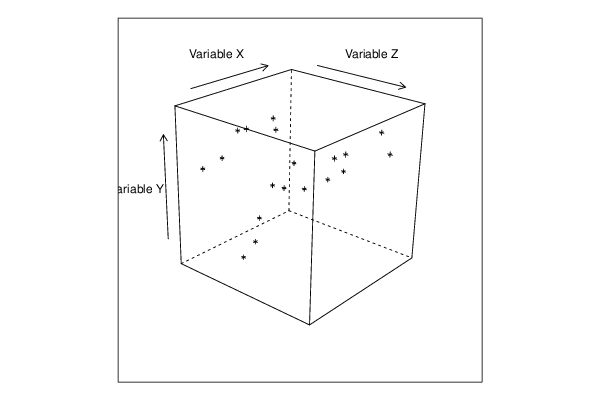
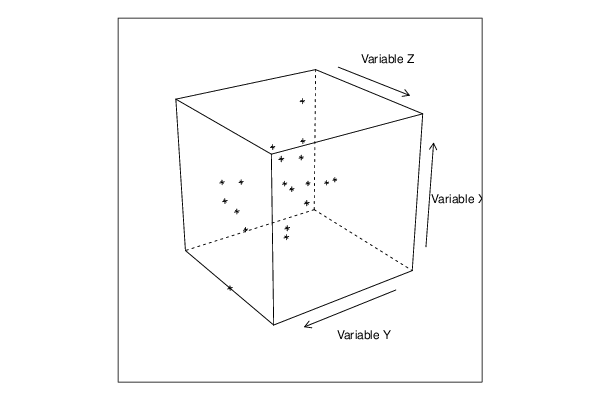
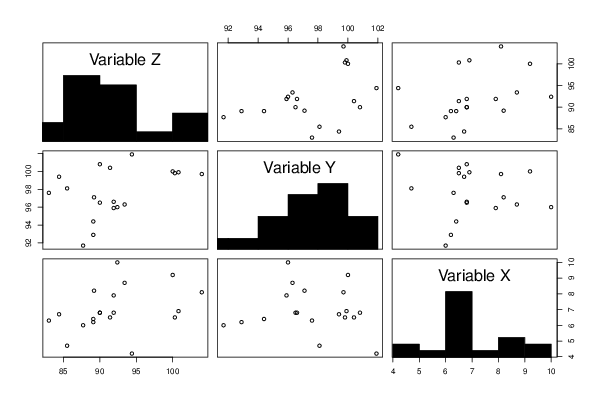
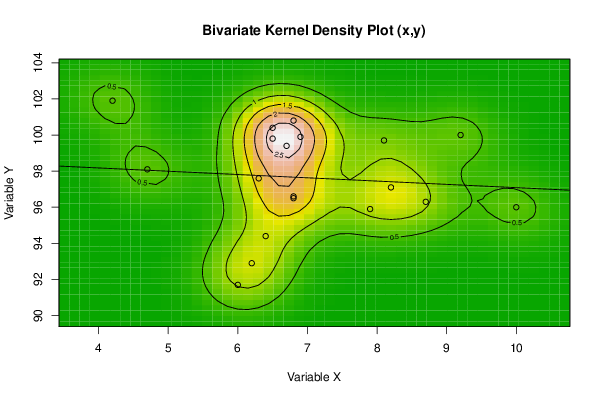
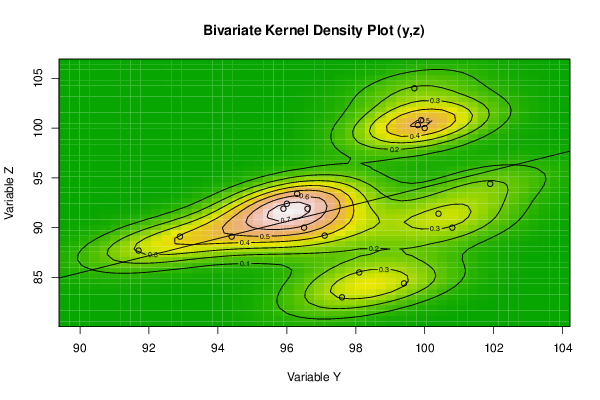
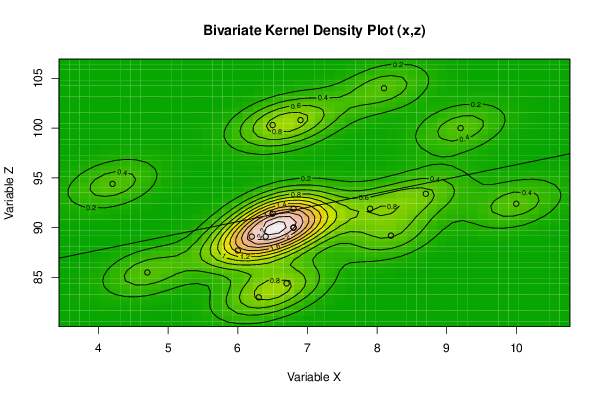
| Title produced by software | Trivariate Scatterplots | ||||||||||||||||||||
| Date of computation | Tue, 08 Oct 2013 14:11:43 -0400 | ||||||||||||||||||||
| Cite this page as follows | Statistical Computations at FreeStatistics.org, Office for Research Development and Education, URL https://freestatistics.org/blog/index.php?v=date/2013/Oct/08/t1381255927nyex1k95leurhk0.htm/, Retrieved Thu, 02 May 2024 08:05:48 +0000 | ||||||||||||||||||||
| Statistical Computations at FreeStatistics.org, Office for Research Development and Education, URL https://freestatistics.org/blog/index.php?pk=214180, Retrieved Thu, 02 May 2024 08:05:48 +0000 | |||||||||||||||||||||
| QR Codes: | |||||||||||||||||||||
|
| |||||||||||||||||||||
| Original text written by user: | |||||||||||||||||||||
| IsPrivate? | No (this computation is public) | ||||||||||||||||||||
| User-defined keywords | |||||||||||||||||||||
| Estimated Impact | 71 | ||||||||||||||||||||
Tree of Dependent Computations | |||||||||||||||||||||
| Family? (F = Feedback message, R = changed R code, M = changed R Module, P = changed Parameters, D = changed Data) | |||||||||||||||||||||
| - [Notched Boxplots] [Task 7] [2013-10-08 17:52:07] [c6f8b1ebc3c8db7b9216fced5f615834] - RMPD [Trivariate Scatterplots] [Task 8 ] [2013-10-08 18:11:43] [f8aff9f47a6e961fa8f039c54f435553] [Current] | |||||||||||||||||||||
| Feedback Forum | |||||||||||||||||||||
Post a new message | |||||||||||||||||||||
Dataset | |||||||||||||||||||||
| Dataseries X: | |||||||||||||||||||||
4.2 4.7 6.3 6.7 6.8 6.8 6.2 6.4 6 8.2 6.5 6.8 8.7 10 7.9 9.2 8.1 6.9 6.5 | |||||||||||||||||||||
| Dataseries Y: | |||||||||||||||||||||
101.9 98.1 97.6 99.4 100.8 96.5 92.9 94.4 91.7 97.1 100.4 96.6 96.3 96 95.9 100 99.7 99.9 99.8 | |||||||||||||||||||||
| Dataseries Z: | |||||||||||||||||||||
94.4 85.5 83 84.4 90 90 89.1 89.1 87.7 89.2 91.4 91.9 93.4 92.4 91.9 100 104 100.8 100.3 | |||||||||||||||||||||
Tables (Output of Computation) | |||||||||||||||||||||
| |||||||||||||||||||||
Figures (Output of Computation) | |||||||||||||||||||||
Input Parameters & R Code | |||||||||||||||||||||
| Parameters (Session): | |||||||||||||||||||||
| par1 = 50 ; par2 = 50 ; par3 = Y ; par4 = Y ; par5 = Variable X ; par6 = Variable Y ; par7 = Variable Z ; | |||||||||||||||||||||
| Parameters (R input): | |||||||||||||||||||||
| par1 = 50 ; par2 = 50 ; par3 = Y ; par4 = Y ; par5 = Variable X ; par6 = Variable Y ; par7 = Variable Z ; | |||||||||||||||||||||
| R code (references can be found in the software module): | |||||||||||||||||||||
x <- array(x,dim=c(length(x),1)) | |||||||||||||||||||||