Free Statistics

of Irreproducible Research!

Author's title

Author*Unverified author*
R Software Modulerwasp_centraltendency.wasp
Title produced by softwareCentral Tendency
Date of computationThu, 10 Oct 2013 12:54:54 -0400
Cite this page as followsStatistical Computations at FreeStatistics.org, Office for Research Development and Education, URL https://freestatistics.org/blog/index.php?v=date/2013/Oct/10/t13814241154l38yl56jpd695w.htm/, Retrieved Thu, 02 May 2024 23:29:03 +0000
Statistical Computations at FreeStatistics.org, Office for Research Development and Education, URL https://freestatistics.org/blog/index.php?pk=214657, Retrieved Thu, 02 May 2024 23:29:03 +0000
QR Codes:

Original text written by user:
IsPrivate?No (this computation is public)
User-defined keywords
Estimated Impact98
Family? (F = Feedback message, R = changed R code, M = changed R Module, P = changed Parameters, D = changed Data)
-       [Central Tendency] [] [2013-10-10 16:54:54] [da6056b86d6cc6ac74ca244744435ec9] [Current]
Feedback Forum

Post a new message
Dataseries X:
86,86
86,79
82,52
86,87
81,62
82,66
89,87
92,04
79,74
77,75
79,12
76,37
75,01
77,6
77,81
81,7
76,47
74,72
84,43
86,72
70,99
75,43
74,14
73,3
71,97
69,27
74,13
76,4
72,26
72,1
87,82
91,62
82,69
85,76
86,87
93,09
83,73
84,49
87,37
89,13
83,2
83,77
93,68
93,09
88,59
87,88
87,89
89,38
89,13
89,58
90,22
91,44
91,04
92,1
97,54
99,12
100
99,68
100,08
99,9
99,63
99,45
99,63
99,46
96,91
97,65
102,1
103,57
104,59
104,79
101,31
104,8
104,56
104,15
102,73
101,86
101,9
102,33
105,71
106,1
102,81
103,23
102,35
104,11


Summary of computational transaction
Raw Inputview raw input (R code)
Raw Outputview raw output of R engine
Computing time2 seconds
R Server'George Udny Yule' @ yule.wessa.net

\begin{tabular}{lllllllll}
\hline
Summary of computational transaction \tabularnewline
Raw Input & view raw input (R code)  \tabularnewline
Raw Output & view raw output of R engine  \tabularnewline
Computing time & 2 seconds \tabularnewline
R Server & 'George Udny Yule' @ yule.wessa.net \tabularnewline
\hline
\end{tabular}
%Source: https://freestatistics.org/blog/index.php?pk=214657&T=0

[TABLE]
[ROW][C]Summary of computational transaction[/C][/ROW]
[ROW][C]Raw Input[/C][C]view raw input (R code) [/C][/ROW]
[ROW][C]Raw Output[/C][C]view raw output of R engine [/C][/ROW]
[ROW][C]Computing time[/C][C]2 seconds[/C][/ROW]
[ROW][C]R Server[/C][C]'George Udny Yule' @ yule.wessa.net[/C][/ROW]
[/TABLE]
Source: https://freestatistics.org/blog/index.php?pk=214657&T=0

Globally Unique Identifier (entire table): ba.freestatistics.org/blog/index.php?pk=214657&T=0

As an alternative you can also use a QR Code:  

The GUIDs for individual cells are displayed in the table below:

Summary of computational transaction
Raw Inputview raw input (R code)
Raw Outputview raw output of R engine
Computing time2 seconds
R Server'George Udny Yule' @ yule.wessa.net


Central Tendency - Ungrouped Data
MeasureValueS.E.Value/S.E.
Arithmetic Mean89.78892857142861.1597118909658377.4234784267416
Geometric Mean89.1544467568236
Harmonic Mean88.509829610566
Quadratic Mean90.4084123443115
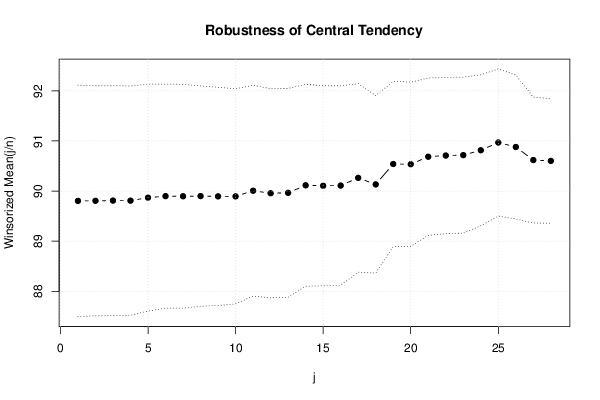
Winsorized Mean ( 1 / 28 )89.80476190476191.1547406152848277.7705059612987
Winsorized Mean ( 2 / 28 )89.80642857142861.1467590796551778.3132483227717
Winsorized Mean ( 3 / 28 )89.81071428571431.1458354935864278.3801119693111
Winsorized Mean ( 4 / 28 )89.80880952380951.1429293272408378.5777452579843
Winsorized Mean ( 5 / 28 )89.86892857142861.1314623154362579.4272397280669
Winsorized Mean ( 6 / 28 )89.89892857142861.1166452248460480.508049084098
Winsorized Mean ( 7 / 28 )89.89642857142861.1159914337367380.5529736643444
Winsorized Mean ( 8 / 28 )89.90023809523811.0988952750279681.8096502352786
Winsorized Mean ( 9 / 28 )89.8948809523811.0883305612796482.5988758844412
Winsorized Mean ( 10 / 28 )89.8948809523811.0728324355236683.7920983517823
Winsorized Mean ( 11 / 28 )90.00751.0516917480163485.5835373528113
Winsorized Mean ( 12 / 28 )89.95751.0431802251150886.233900752937
Winsorized Mean ( 13 / 28 )89.96523809523811.0410431085038586.4183599702544
Winsorized Mean ( 14 / 28 )90.11523809523811.0067299710168689.5128194149377
Winsorized Mean ( 15 / 28 )90.10630952380950.99762067456533490.3212130833887
Winsorized Mean ( 16 / 28 )90.11011904761910.99483203467949590.5782241689169
Winsorized Mean ( 17 / 28 )90.26392857142860.94033744473922295.9909967176314
Winsorized Mean ( 18 / 28 )90.13321428571430.884927222628637101.85381574993
Winsorized Mean ( 19 / 28 )90.54035714285710.82456964638135109.803165251348
Winsorized Mean ( 20 / 28 )90.53559523809520.818804250237056110.57049986231
Winsorized Mean ( 21 / 28 )90.68559523809520.785037599020457115.517518334472
Winsorized Mean ( 22 / 28 )90.70916666666670.778649039114529116.49557388502
Winsorized Mean ( 23 / 28 )90.71738095238090.777626692982419116.659293940199
Winsorized Mean ( 24 / 28 )90.81452380952380.752972430763961120.608033042304
Winsorized Mean ( 25 / 28 )90.96928571428570.733569573883685124.009076920507
Winsorized Mean ( 26 / 28 )90.87952380952380.71791797732581126.587614016915
Winsorized Mean ( 27 / 28 )90.61916666666670.628076049574074144.28056399877
Winsorized Mean ( 28 / 28 )90.60250.620761240216507145.95386137253
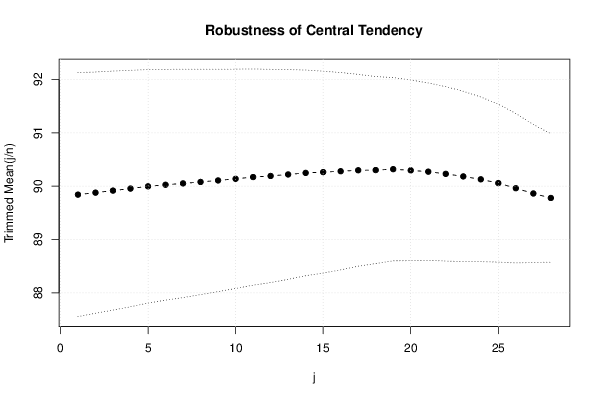
Trimmed Mean ( 1 / 28 )89.8402439024391.1437989993994178.5454821604256
Trimmed Mean ( 2 / 28 )89.87751.1308587458938379.4772117440372
Trimmed Mean ( 3 / 28 )89.91576923076921.1203625328895180.2559587554835
Trimmed Mean ( 4 / 28 )89.95447368421051.1081869402551981.1726527507135
Trimmed Mean ( 5 / 28 )89.99581081081081.0946190289162982.2165597650079
Trimmed Mean ( 6 / 28 )90.02541666666671.0817248792089883.2239494505278
Trimmed Mean ( 7 / 28 )90.05071428571431.069963048092284.162452569067
Trimmed Mean ( 8 / 28 )90.07794117647061.0557984374860885.3173654916099
Trimmed Mean ( 9 / 28 )90.10621212121211.0423062058788686.4488876809818
Trimmed Mean ( 10 / 28 )90.137031251.0279423670153687.6868530204801
Trimmed Mean ( 11 / 28 )90.16983870967741.0133309861882788.9835995727896
Trimmed Mean ( 12 / 28 )90.19050.9993343667430290.2505737833718
Trimmed Mean ( 13 / 28 )90.21862068965520.98340921036555991.7406708608297
Trimmed Mean ( 14 / 28 )90.24785714285710.9638689864320693.6308340793559
Trimmed Mean ( 15 / 28 )90.26259259259260.94595398606833695.4196440016608
Trimmed Mean ( 16 / 28 )90.27942307692310.9249743143252797.6020865431038
Trimmed Mean ( 17 / 28 )90.29720.898838118044056100.459913957025
Trimmed Mean ( 18 / 28 )90.3006250.876497523302546103.024392652882
Trimmed Mean ( 19 / 28 )90.31760869565220.85859987052186105.191733421479
Trimmed Mean ( 20 / 28 )90.29522727272730.846760990052362106.636026379939
Trimmed Mean ( 21 / 28 )90.27119047619050.831444330712094108.571538877266
Trimmed Mean ( 22 / 28 )90.229750.817180384277987110.41595189503
Trimmed Mean ( 23 / 28 )90.18157894736840.798286173345227112.96898525683
Trimmed Mean ( 24 / 28 )90.12722222222220.771766640763524116.780406747119
Trimmed Mean ( 25 / 28 )90.05647058823530.740494473031732121.616668142743
Trimmed Mean ( 26 / 28 )89.9606250.700426128576556128.43699189638
Trimmed Mean ( 27 / 28 )89.86166666666670.64697369474023138.895394661676
Trimmed Mean ( 28 / 28 )89.77750.601805841749664149.180173690214
Median89.255
Midrange87.685
Midmean - Weighted Average at Xnp90.0718604651163
Midmean - Weighted Average at X(n+1)p90.2711904761905
Midmean - Empirical Distribution Function90.0718604651163
Midmean - Empirical Distribution Function - Averaging90.2711904761905
Midmean - Empirical Distribution Function - Interpolation90.2711904761905
Midmean - Closest Observation90.0718604651163
Midmean - True Basic - Statistics Graphics Toolkit90.2711904761905
Midmean - MS Excel (old versions)90.2952272727273
Number of observations84

\begin{tabular}{lllllllll}
\hline
Central Tendency - Ungrouped Data \tabularnewline
Measure & Value & S.E. & Value/S.E. \tabularnewline
Arithmetic Mean & 89.7889285714286 & 1.15971189096583 & 77.4234784267416 \tabularnewline
Geometric Mean & 89.1544467568236 &  &  \tabularnewline
Harmonic Mean & 88.509829610566 &  &  \tabularnewline
Quadratic Mean & 90.4084123443115 &  &  \tabularnewline
Winsorized Mean ( 1 / 28 ) & 89.8047619047619 & 1.15474061528482 & 77.7705059612987 \tabularnewline
Winsorized Mean ( 2 / 28 ) & 89.8064285714286 & 1.14675907965517 & 78.3132483227717 \tabularnewline
Winsorized Mean ( 3 / 28 ) & 89.8107142857143 & 1.14583549358642 & 78.3801119693111 \tabularnewline
Winsorized Mean ( 4 / 28 ) & 89.8088095238095 & 1.14292932724083 & 78.5777452579843 \tabularnewline
Winsorized Mean ( 5 / 28 ) & 89.8689285714286 & 1.13146231543625 & 79.4272397280669 \tabularnewline
Winsorized Mean ( 6 / 28 ) & 89.8989285714286 & 1.11664522484604 & 80.508049084098 \tabularnewline
Winsorized Mean ( 7 / 28 ) & 89.8964285714286 & 1.11599143373673 & 80.5529736643444 \tabularnewline
Winsorized Mean ( 8 / 28 ) & 89.9002380952381 & 1.09889527502796 & 81.8096502352786 \tabularnewline
Winsorized Mean ( 9 / 28 ) & 89.894880952381 & 1.08833056127964 & 82.5988758844412 \tabularnewline
Winsorized Mean ( 10 / 28 ) & 89.894880952381 & 1.07283243552366 & 83.7920983517823 \tabularnewline
Winsorized Mean ( 11 / 28 ) & 90.0075 & 1.05169174801634 & 85.5835373528113 \tabularnewline
Winsorized Mean ( 12 / 28 ) & 89.9575 & 1.04318022511508 & 86.233900752937 \tabularnewline
Winsorized Mean ( 13 / 28 ) & 89.9652380952381 & 1.04104310850385 & 86.4183599702544 \tabularnewline
Winsorized Mean ( 14 / 28 ) & 90.1152380952381 & 1.00672997101686 & 89.5128194149377 \tabularnewline
Winsorized Mean ( 15 / 28 ) & 90.1063095238095 & 0.997620674565334 & 90.3212130833887 \tabularnewline
Winsorized Mean ( 16 / 28 ) & 90.1101190476191 & 0.994832034679495 & 90.5782241689169 \tabularnewline
Winsorized Mean ( 17 / 28 ) & 90.2639285714286 & 0.940337444739222 & 95.9909967176314 \tabularnewline
Winsorized Mean ( 18 / 28 ) & 90.1332142857143 & 0.884927222628637 & 101.85381574993 \tabularnewline
Winsorized Mean ( 19 / 28 ) & 90.5403571428571 & 0.82456964638135 & 109.803165251348 \tabularnewline
Winsorized Mean ( 20 / 28 ) & 90.5355952380952 & 0.818804250237056 & 110.57049986231 \tabularnewline
Winsorized Mean ( 21 / 28 ) & 90.6855952380952 & 0.785037599020457 & 115.517518334472 \tabularnewline
Winsorized Mean ( 22 / 28 ) & 90.7091666666667 & 0.778649039114529 & 116.49557388502 \tabularnewline
Winsorized Mean ( 23 / 28 ) & 90.7173809523809 & 0.777626692982419 & 116.659293940199 \tabularnewline
Winsorized Mean ( 24 / 28 ) & 90.8145238095238 & 0.752972430763961 & 120.608033042304 \tabularnewline
Winsorized Mean ( 25 / 28 ) & 90.9692857142857 & 0.733569573883685 & 124.009076920507 \tabularnewline
Winsorized Mean ( 26 / 28 ) & 90.8795238095238 & 0.71791797732581 & 126.587614016915 \tabularnewline
Winsorized Mean ( 27 / 28 ) & 90.6191666666667 & 0.628076049574074 & 144.28056399877 \tabularnewline
Winsorized Mean ( 28 / 28 ) & 90.6025 & 0.620761240216507 & 145.95386137253 \tabularnewline
Trimmed Mean ( 1 / 28 ) & 89.840243902439 & 1.14379899939941 & 78.5454821604256 \tabularnewline
Trimmed Mean ( 2 / 28 ) & 89.8775 & 1.13085874589383 & 79.4772117440372 \tabularnewline
Trimmed Mean ( 3 / 28 ) & 89.9157692307692 & 1.12036253288951 & 80.2559587554835 \tabularnewline
Trimmed Mean ( 4 / 28 ) & 89.9544736842105 & 1.10818694025519 & 81.1726527507135 \tabularnewline
Trimmed Mean ( 5 / 28 ) & 89.9958108108108 & 1.09461902891629 & 82.2165597650079 \tabularnewline
Trimmed Mean ( 6 / 28 ) & 90.0254166666667 & 1.08172487920898 & 83.2239494505278 \tabularnewline
Trimmed Mean ( 7 / 28 ) & 90.0507142857143 & 1.0699630480922 & 84.162452569067 \tabularnewline
Trimmed Mean ( 8 / 28 ) & 90.0779411764706 & 1.05579843748608 & 85.3173654916099 \tabularnewline
Trimmed Mean ( 9 / 28 ) & 90.1062121212121 & 1.04230620587886 & 86.4488876809818 \tabularnewline
Trimmed Mean ( 10 / 28 ) & 90.13703125 & 1.02794236701536 & 87.6868530204801 \tabularnewline
Trimmed Mean ( 11 / 28 ) & 90.1698387096774 & 1.01333098618827 & 88.9835995727896 \tabularnewline
Trimmed Mean ( 12 / 28 ) & 90.1905 & 0.99933436674302 & 90.2505737833718 \tabularnewline
Trimmed Mean ( 13 / 28 ) & 90.2186206896552 & 0.983409210365559 & 91.7406708608297 \tabularnewline
Trimmed Mean ( 14 / 28 ) & 90.2478571428571 & 0.96386898643206 & 93.6308340793559 \tabularnewline
Trimmed Mean ( 15 / 28 ) & 90.2625925925926 & 0.945953986068336 & 95.4196440016608 \tabularnewline
Trimmed Mean ( 16 / 28 ) & 90.2794230769231 & 0.92497431432527 & 97.6020865431038 \tabularnewline
Trimmed Mean ( 17 / 28 ) & 90.2972 & 0.898838118044056 & 100.459913957025 \tabularnewline
Trimmed Mean ( 18 / 28 ) & 90.300625 & 0.876497523302546 & 103.024392652882 \tabularnewline
Trimmed Mean ( 19 / 28 ) & 90.3176086956522 & 0.85859987052186 & 105.191733421479 \tabularnewline
Trimmed Mean ( 20 / 28 ) & 90.2952272727273 & 0.846760990052362 & 106.636026379939 \tabularnewline
Trimmed Mean ( 21 / 28 ) & 90.2711904761905 & 0.831444330712094 & 108.571538877266 \tabularnewline
Trimmed Mean ( 22 / 28 ) & 90.22975 & 0.817180384277987 & 110.41595189503 \tabularnewline
Trimmed Mean ( 23 / 28 ) & 90.1815789473684 & 0.798286173345227 & 112.96898525683 \tabularnewline
Trimmed Mean ( 24 / 28 ) & 90.1272222222222 & 0.771766640763524 & 116.780406747119 \tabularnewline
Trimmed Mean ( 25 / 28 ) & 90.0564705882353 & 0.740494473031732 & 121.616668142743 \tabularnewline
Trimmed Mean ( 26 / 28 ) & 89.960625 & 0.700426128576556 & 128.43699189638 \tabularnewline
Trimmed Mean ( 27 / 28 ) & 89.8616666666667 & 0.64697369474023 & 138.895394661676 \tabularnewline
Trimmed Mean ( 28 / 28 ) & 89.7775 & 0.601805841749664 & 149.180173690214 \tabularnewline
Median & 89.255 &  &  \tabularnewline
Midrange & 87.685 &  &  \tabularnewline
Midmean - Weighted Average at Xnp & 90.0718604651163 &  &  \tabularnewline
Midmean - Weighted Average at X(n+1)p & 90.2711904761905 &  &  \tabularnewline
Midmean - Empirical Distribution Function & 90.0718604651163 &  &  \tabularnewline
Midmean - Empirical Distribution Function - Averaging & 90.2711904761905 &  &  \tabularnewline
Midmean - Empirical Distribution Function - Interpolation & 90.2711904761905 &  &  \tabularnewline
Midmean - Closest Observation & 90.0718604651163 &  &  \tabularnewline
Midmean - True Basic - Statistics Graphics Toolkit & 90.2711904761905 &  &  \tabularnewline
Midmean - MS Excel (old versions) & 90.2952272727273 &  &  \tabularnewline
Number of observations & 84 &  &  \tabularnewline
\hline
\end{tabular}
%Source: https://freestatistics.org/blog/index.php?pk=214657&T=1

[TABLE]
[ROW][C]Central Tendency - Ungrouped Data[/C][/ROW]
[ROW][C]Measure[/C][C]Value[/C][C]S.E.[/C][C]Value/S.E.[/C][/ROW]
[ROW][C]Arithmetic Mean[/C][C]89.7889285714286[/C][C]1.15971189096583[/C][C]77.4234784267416[/C][/ROW]
[ROW][C]Geometric Mean[/C][C]89.1544467568236[/C][C][/C][C][/C][/ROW]
[ROW][C]Harmonic Mean[/C][C]88.509829610566[/C][C][/C][C][/C][/ROW]
[ROW][C]Quadratic Mean[/C][C]90.4084123443115[/C][C][/C][C][/C][/ROW]
[ROW][C]Winsorized Mean ( 1 / 28 )[/C][C]89.8047619047619[/C][C]1.15474061528482[/C][C]77.7705059612987[/C][/ROW]
[ROW][C]Winsorized Mean ( 2 / 28 )[/C][C]89.8064285714286[/C][C]1.14675907965517[/C][C]78.3132483227717[/C][/ROW]
[ROW][C]Winsorized Mean ( 3 / 28 )[/C][C]89.8107142857143[/C][C]1.14583549358642[/C][C]78.3801119693111[/C][/ROW]
[ROW][C]Winsorized Mean ( 4 / 28 )[/C][C]89.8088095238095[/C][C]1.14292932724083[/C][C]78.5777452579843[/C][/ROW]
[ROW][C]Winsorized Mean ( 5 / 28 )[/C][C]89.8689285714286[/C][C]1.13146231543625[/C][C]79.4272397280669[/C][/ROW]
[ROW][C]Winsorized Mean ( 6 / 28 )[/C][C]89.8989285714286[/C][C]1.11664522484604[/C][C]80.508049084098[/C][/ROW]
[ROW][C]Winsorized Mean ( 7 / 28 )[/C][C]89.8964285714286[/C][C]1.11599143373673[/C][C]80.5529736643444[/C][/ROW]
[ROW][C]Winsorized Mean ( 8 / 28 )[/C][C]89.9002380952381[/C][C]1.09889527502796[/C][C]81.8096502352786[/C][/ROW]
[ROW][C]Winsorized Mean ( 9 / 28 )[/C][C]89.894880952381[/C][C]1.08833056127964[/C][C]82.5988758844412[/C][/ROW]
[ROW][C]Winsorized Mean ( 10 / 28 )[/C][C]89.894880952381[/C][C]1.07283243552366[/C][C]83.7920983517823[/C][/ROW]
[ROW][C]Winsorized Mean ( 11 / 28 )[/C][C]90.0075[/C][C]1.05169174801634[/C][C]85.5835373528113[/C][/ROW]
[ROW][C]Winsorized Mean ( 12 / 28 )[/C][C]89.9575[/C][C]1.04318022511508[/C][C]86.233900752937[/C][/ROW]
[ROW][C]Winsorized Mean ( 13 / 28 )[/C][C]89.9652380952381[/C][C]1.04104310850385[/C][C]86.4183599702544[/C][/ROW]
[ROW][C]Winsorized Mean ( 14 / 28 )[/C][C]90.1152380952381[/C][C]1.00672997101686[/C][C]89.5128194149377[/C][/ROW]
[ROW][C]Winsorized Mean ( 15 / 28 )[/C][C]90.1063095238095[/C][C]0.997620674565334[/C][C]90.3212130833887[/C][/ROW]
[ROW][C]Winsorized Mean ( 16 / 28 )[/C][C]90.1101190476191[/C][C]0.994832034679495[/C][C]90.5782241689169[/C][/ROW]
[ROW][C]Winsorized Mean ( 17 / 28 )[/C][C]90.2639285714286[/C][C]0.940337444739222[/C][C]95.9909967176314[/C][/ROW]
[ROW][C]Winsorized Mean ( 18 / 28 )[/C][C]90.1332142857143[/C][C]0.884927222628637[/C][C]101.85381574993[/C][/ROW]
[ROW][C]Winsorized Mean ( 19 / 28 )[/C][C]90.5403571428571[/C][C]0.82456964638135[/C][C]109.803165251348[/C][/ROW]
[ROW][C]Winsorized Mean ( 20 / 28 )[/C][C]90.5355952380952[/C][C]0.818804250237056[/C][C]110.57049986231[/C][/ROW]
[ROW][C]Winsorized Mean ( 21 / 28 )[/C][C]90.6855952380952[/C][C]0.785037599020457[/C][C]115.517518334472[/C][/ROW]
[ROW][C]Winsorized Mean ( 22 / 28 )[/C][C]90.7091666666667[/C][C]0.778649039114529[/C][C]116.49557388502[/C][/ROW]
[ROW][C]Winsorized Mean ( 23 / 28 )[/C][C]90.7173809523809[/C][C]0.777626692982419[/C][C]116.659293940199[/C][/ROW]
[ROW][C]Winsorized Mean ( 24 / 28 )[/C][C]90.8145238095238[/C][C]0.752972430763961[/C][C]120.608033042304[/C][/ROW]
[ROW][C]Winsorized Mean ( 25 / 28 )[/C][C]90.9692857142857[/C][C]0.733569573883685[/C][C]124.009076920507[/C][/ROW]
[ROW][C]Winsorized Mean ( 26 / 28 )[/C][C]90.8795238095238[/C][C]0.71791797732581[/C][C]126.587614016915[/C][/ROW]
[ROW][C]Winsorized Mean ( 27 / 28 )[/C][C]90.6191666666667[/C][C]0.628076049574074[/C][C]144.28056399877[/C][/ROW]
[ROW][C]Winsorized Mean ( 28 / 28 )[/C][C]90.6025[/C][C]0.620761240216507[/C][C]145.95386137253[/C][/ROW]
[ROW][C]Trimmed Mean ( 1 / 28 )[/C][C]89.840243902439[/C][C]1.14379899939941[/C][C]78.5454821604256[/C][/ROW]
[ROW][C]Trimmed Mean ( 2 / 28 )[/C][C]89.8775[/C][C]1.13085874589383[/C][C]79.4772117440372[/C][/ROW]
[ROW][C]Trimmed Mean ( 3 / 28 )[/C][C]89.9157692307692[/C][C]1.12036253288951[/C][C]80.2559587554835[/C][/ROW]
[ROW][C]Trimmed Mean ( 4 / 28 )[/C][C]89.9544736842105[/C][C]1.10818694025519[/C][C]81.1726527507135[/C][/ROW]
[ROW][C]Trimmed Mean ( 5 / 28 )[/C][C]89.9958108108108[/C][C]1.09461902891629[/C][C]82.2165597650079[/C][/ROW]
[ROW][C]Trimmed Mean ( 6 / 28 )[/C][C]90.0254166666667[/C][C]1.08172487920898[/C][C]83.2239494505278[/C][/ROW]
[ROW][C]Trimmed Mean ( 7 / 28 )[/C][C]90.0507142857143[/C][C]1.0699630480922[/C][C]84.162452569067[/C][/ROW]
[ROW][C]Trimmed Mean ( 8 / 28 )[/C][C]90.0779411764706[/C][C]1.05579843748608[/C][C]85.3173654916099[/C][/ROW]
[ROW][C]Trimmed Mean ( 9 / 28 )[/C][C]90.1062121212121[/C][C]1.04230620587886[/C][C]86.4488876809818[/C][/ROW]
[ROW][C]Trimmed Mean ( 10 / 28 )[/C][C]90.13703125[/C][C]1.02794236701536[/C][C]87.6868530204801[/C][/ROW]
[ROW][C]Trimmed Mean ( 11 / 28 )[/C][C]90.1698387096774[/C][C]1.01333098618827[/C][C]88.9835995727896[/C][/ROW]
[ROW][C]Trimmed Mean ( 12 / 28 )[/C][C]90.1905[/C][C]0.99933436674302[/C][C]90.2505737833718[/C][/ROW]
[ROW][C]Trimmed Mean ( 13 / 28 )[/C][C]90.2186206896552[/C][C]0.983409210365559[/C][C]91.7406708608297[/C][/ROW]
[ROW][C]Trimmed Mean ( 14 / 28 )[/C][C]90.2478571428571[/C][C]0.96386898643206[/C][C]93.6308340793559[/C][/ROW]
[ROW][C]Trimmed Mean ( 15 / 28 )[/C][C]90.2625925925926[/C][C]0.945953986068336[/C][C]95.4196440016608[/C][/ROW]
[ROW][C]Trimmed Mean ( 16 / 28 )[/C][C]90.2794230769231[/C][C]0.92497431432527[/C][C]97.6020865431038[/C][/ROW]
[ROW][C]Trimmed Mean ( 17 / 28 )[/C][C]90.2972[/C][C]0.898838118044056[/C][C]100.459913957025[/C][/ROW]
[ROW][C]Trimmed Mean ( 18 / 28 )[/C][C]90.300625[/C][C]0.876497523302546[/C][C]103.024392652882[/C][/ROW]
[ROW][C]Trimmed Mean ( 19 / 28 )[/C][C]90.3176086956522[/C][C]0.85859987052186[/C][C]105.191733421479[/C][/ROW]
[ROW][C]Trimmed Mean ( 20 / 28 )[/C][C]90.2952272727273[/C][C]0.846760990052362[/C][C]106.636026379939[/C][/ROW]
[ROW][C]Trimmed Mean ( 21 / 28 )[/C][C]90.2711904761905[/C][C]0.831444330712094[/C][C]108.571538877266[/C][/ROW]
[ROW][C]Trimmed Mean ( 22 / 28 )[/C][C]90.22975[/C][C]0.817180384277987[/C][C]110.41595189503[/C][/ROW]
[ROW][C]Trimmed Mean ( 23 / 28 )[/C][C]90.1815789473684[/C][C]0.798286173345227[/C][C]112.96898525683[/C][/ROW]
[ROW][C]Trimmed Mean ( 24 / 28 )[/C][C]90.1272222222222[/C][C]0.771766640763524[/C][C]116.780406747119[/C][/ROW]
[ROW][C]Trimmed Mean ( 25 / 28 )[/C][C]90.0564705882353[/C][C]0.740494473031732[/C][C]121.616668142743[/C][/ROW]
[ROW][C]Trimmed Mean ( 26 / 28 )[/C][C]89.960625[/C][C]0.700426128576556[/C][C]128.43699189638[/C][/ROW]
[ROW][C]Trimmed Mean ( 27 / 28 )[/C][C]89.8616666666667[/C][C]0.64697369474023[/C][C]138.895394661676[/C][/ROW]
[ROW][C]Trimmed Mean ( 28 / 28 )[/C][C]89.7775[/C][C]0.601805841749664[/C][C]149.180173690214[/C][/ROW]
[ROW][C]Median[/C][C]89.255[/C][C][/C][C][/C][/ROW]
[ROW][C]Midrange[/C][C]87.685[/C][C][/C][C][/C][/ROW]
[ROW][C]Midmean - Weighted Average at Xnp[/C][C]90.0718604651163[/C][C][/C][C][/C][/ROW]
[ROW][C]Midmean - Weighted Average at X(n+1)p[/C][C]90.2711904761905[/C][C][/C][C][/C][/ROW]
[ROW][C]Midmean - Empirical Distribution Function[/C][C]90.0718604651163[/C][C][/C][C][/C][/ROW]
[ROW][C]Midmean - Empirical Distribution Function - Averaging[/C][C]90.2711904761905[/C][C][/C][C][/C][/ROW]
[ROW][C]Midmean - Empirical Distribution Function - Interpolation[/C][C]90.2711904761905[/C][C][/C][C][/C][/ROW]
[ROW][C]Midmean - Closest Observation[/C][C]90.0718604651163[/C][C][/C][C][/C][/ROW]
[ROW][C]Midmean - True Basic - Statistics Graphics Toolkit[/C][C]90.2711904761905[/C][C][/C][C][/C][/ROW]
[ROW][C]Midmean - MS Excel (old versions)[/C][C]90.2952272727273[/C][C][/C][C][/C][/ROW]
[ROW][C]Number of observations[/C][C]84[/C][C][/C][C][/C][/ROW]
[/TABLE]
Source: https://freestatistics.org/blog/index.php?pk=214657&T=1

Globally Unique Identifier (entire table): ba.freestatistics.org/blog/index.php?pk=214657&T=1

As an alternative you can also use a QR Code:  

The GUIDs for individual cells are displayed in the table below:

Central Tendency - Ungrouped Data
MeasureValueS.E.Value/S.E.
Arithmetic Mean89.78892857142861.1597118909658377.4234784267416
Geometric Mean89.1544467568236
Harmonic Mean88.509829610566
Quadratic Mean90.4084123443115
Winsorized Mean ( 1 / 28 )89.80476190476191.1547406152848277.7705059612987
Winsorized Mean ( 2 / 28 )89.80642857142861.1467590796551778.3132483227717
Winsorized Mean ( 3 / 28 )89.81071428571431.1458354935864278.3801119693111
Winsorized Mean ( 4 / 28 )89.80880952380951.1429293272408378.5777452579843
Winsorized Mean ( 5 / 28 )89.86892857142861.1314623154362579.4272397280669
Winsorized Mean ( 6 / 28 )89.89892857142861.1166452248460480.508049084098
Winsorized Mean ( 7 / 28 )89.89642857142861.1159914337367380.5529736643444
Winsorized Mean ( 8 / 28 )89.90023809523811.0988952750279681.8096502352786
Winsorized Mean ( 9 / 28 )89.8948809523811.0883305612796482.5988758844412
Winsorized Mean ( 10 / 28 )89.8948809523811.0728324355236683.7920983517823
Winsorized Mean ( 11 / 28 )90.00751.0516917480163485.5835373528113
Winsorized Mean ( 12 / 28 )89.95751.0431802251150886.233900752937
Winsorized Mean ( 13 / 28 )89.96523809523811.0410431085038586.4183599702544
Winsorized Mean ( 14 / 28 )90.11523809523811.0067299710168689.5128194149377
Winsorized Mean ( 15 / 28 )90.10630952380950.99762067456533490.3212130833887
Winsorized Mean ( 16 / 28 )90.11011904761910.99483203467949590.5782241689169
Winsorized Mean ( 17 / 28 )90.26392857142860.94033744473922295.9909967176314
Winsorized Mean ( 18 / 28 )90.13321428571430.884927222628637101.85381574993
Winsorized Mean ( 19 / 28 )90.54035714285710.82456964638135109.803165251348
Winsorized Mean ( 20 / 28 )90.53559523809520.818804250237056110.57049986231
Winsorized Mean ( 21 / 28 )90.68559523809520.785037599020457115.517518334472
Winsorized Mean ( 22 / 28 )90.70916666666670.778649039114529116.49557388502
Winsorized Mean ( 23 / 28 )90.71738095238090.777626692982419116.659293940199
Winsorized Mean ( 24 / 28 )90.81452380952380.752972430763961120.608033042304
Winsorized Mean ( 25 / 28 )90.96928571428570.733569573883685124.009076920507
Winsorized Mean ( 26 / 28 )90.87952380952380.71791797732581126.587614016915
Winsorized Mean ( 27 / 28 )90.61916666666670.628076049574074144.28056399877
Winsorized Mean ( 28 / 28 )90.60250.620761240216507145.95386137253
Trimmed Mean ( 1 / 28 )89.8402439024391.1437989993994178.5454821604256
Trimmed Mean ( 2 / 28 )89.87751.1308587458938379.4772117440372
Trimmed Mean ( 3 / 28 )89.91576923076921.1203625328895180.2559587554835
Trimmed Mean ( 4 / 28 )89.95447368421051.1081869402551981.1726527507135
Trimmed Mean ( 5 / 28 )89.99581081081081.0946190289162982.2165597650079
Trimmed Mean ( 6 / 28 )90.02541666666671.0817248792089883.2239494505278
Trimmed Mean ( 7 / 28 )90.05071428571431.069963048092284.162452569067
Trimmed Mean ( 8 / 28 )90.07794117647061.0557984374860885.3173654916099
Trimmed Mean ( 9 / 28 )90.10621212121211.0423062058788686.4488876809818
Trimmed Mean ( 10 / 28 )90.137031251.0279423670153687.6868530204801
Trimmed Mean ( 11 / 28 )90.16983870967741.0133309861882788.9835995727896
Trimmed Mean ( 12 / 28 )90.19050.9993343667430290.2505737833718
Trimmed Mean ( 13 / 28 )90.21862068965520.98340921036555991.7406708608297
Trimmed Mean ( 14 / 28 )90.24785714285710.9638689864320693.6308340793559
Trimmed Mean ( 15 / 28 )90.26259259259260.94595398606833695.4196440016608
Trimmed Mean ( 16 / 28 )90.27942307692310.9249743143252797.6020865431038
Trimmed Mean ( 17 / 28 )90.29720.898838118044056100.459913957025
Trimmed Mean ( 18 / 28 )90.3006250.876497523302546103.024392652882
Trimmed Mean ( 19 / 28 )90.31760869565220.85859987052186105.191733421479
Trimmed Mean ( 20 / 28 )90.29522727272730.846760990052362106.636026379939
Trimmed Mean ( 21 / 28 )90.27119047619050.831444330712094108.571538877266
Trimmed Mean ( 22 / 28 )90.229750.817180384277987110.41595189503
Trimmed Mean ( 23 / 28 )90.18157894736840.798286173345227112.96898525683
Trimmed Mean ( 24 / 28 )90.12722222222220.771766640763524116.780406747119
Trimmed Mean ( 25 / 28 )90.05647058823530.740494473031732121.616668142743
Trimmed Mean ( 26 / 28 )89.9606250.700426128576556128.43699189638
Trimmed Mean ( 27 / 28 )89.86166666666670.64697369474023138.895394661676
Trimmed Mean ( 28 / 28 )89.77750.601805841749664149.180173690214
Median89.255
Midrange87.685
Midmean - Weighted Average at Xnp90.0718604651163
Midmean - Weighted Average at X(n+1)p90.2711904761905
Midmean - Empirical Distribution Function90.0718604651163
Midmean - Empirical Distribution Function - Averaging90.2711904761905
Midmean - Empirical Distribution Function - Interpolation90.2711904761905
Midmean - Closest Observation90.0718604651163
Midmean - True Basic - Statistics Graphics Toolkit90.2711904761905
Midmean - MS Excel (old versions)90.2952272727273
Number of observations84


Parameters (Session):
Parameters (R input):
R code (references can be found in the software module):
geomean <- function(x) {
return(exp(mean(log(x))))
}
harmean <- function(x) {
return(1/mean(1/x))
}
quamean <- function(x) {
return(sqrt(mean(x*x)))
}
winmean <- function(x) {
x <-sort(x[!is.na(x)])
n<-length(x)
denom <- 3
nodenom <- n/denom
if (nodenom>40) denom <- n/40
sqrtn = sqrt(n)
roundnodenom = floor(nodenom)
win <- array(NA,dim=c(roundnodenom,2))
for (j in 1:roundnodenom) {
win[j,1] <- (j*x[j+1]+sum(x[(j+1):(n-j)])+j*x[n-j])/n
win[j,2] <- sd(c(rep(x[j+1],j),x[(j+1):(n-j)],rep(x[n-j],j)))/sqrtn
}
return(win)
}
trimean <- function(x) {
x <-sort(x[!is.na(x)])
n<-length(x)
denom <- 3
nodenom <- n/denom
if (nodenom>40) denom <- n/40
sqrtn = sqrt(n)
roundnodenom = floor(nodenom)
tri <- array(NA,dim=c(roundnodenom,2))
for (j in 1:roundnodenom) {
tri[j,1] <- mean(x,trim=j/n)
tri[j,2] <- sd(x[(j+1):(n-j)]) / sqrt(n-j*2)
}
return(tri)
}
midrange <- function(x) {
return((max(x)+min(x))/2)
}
q1 <- function(data,n,p,i,f) {
np <- n*p;
i <<- floor(np)
f <<- np - i
qvalue <- (1-f)*data[i] + f*data[i+1]
}
q2 <- function(data,n,p,i,f) {
np <- (n+1)*p
i <<- floor(np)
f <<- np - i
qvalue <- (1-f)*data[i] + f*data[i+1]
}
q3 <- function(data,n,p,i,f) {
np <- n*p
i <<- floor(np)
f <<- np - i
if (f==0) {
qvalue <- data[i]
} else {
qvalue <- data[i+1]
}
}
q4 <- function(data,n,p,i,f) {
np <- n*p
i <<- floor(np)
f <<- np - i
if (f==0) {
qvalue <- (data[i]+data[i+1])/2
} else {
qvalue <- data[i+1]
}
}
q5 <- function(data,n,p,i,f) {
np <- (n-1)*p
i <<- floor(np)
f <<- np - i
if (f==0) {
qvalue <- data[i+1]
} else {
qvalue <- data[i+1] + f*(data[i+2]-data[i+1])
}
}
q6 <- function(data,n,p,i,f) {
np <- n*p+0.5
i <<- floor(np)
f <<- np - i
qvalue <- data[i]
}
q7 <- function(data,n,p,i,f) {
np <- (n+1)*p
i <<- floor(np)
f <<- np - i
if (f==0) {
qvalue <- data[i]
} else {
qvalue <- f*data[i] + (1-f)*data[i+1]
}
}
q8 <- function(data,n,p,i,f) {
np <- (n+1)*p
i <<- floor(np)
f <<- np - i
if (f==0) {
qvalue <- data[i]
} else {
if (f == 0.5) {
qvalue <- (data[i]+data[i+1])/2
} else {
if (f < 0.5) {
qvalue <- data[i]
} else {
qvalue <- data[i+1]
}
}
}
}
midmean <- function(x,def) {
x <-sort(x[!is.na(x)])
n<-length(x)
if (def==1) {
qvalue1 <- q1(x,n,0.25,i,f)
qvalue3 <- q1(x,n,0.75,i,f)
}
if (def==2) {
qvalue1 <- q2(x,n,0.25,i,f)
qvalue3 <- q2(x,n,0.75,i,f)
}
if (def==3) {
qvalue1 <- q3(x,n,0.25,i,f)
qvalue3 <- q3(x,n,0.75,i,f)
}
if (def==4) {
qvalue1 <- q4(x,n,0.25,i,f)
qvalue3 <- q4(x,n,0.75,i,f)
}
if (def==5) {
qvalue1 <- q5(x,n,0.25,i,f)
qvalue3 <- q5(x,n,0.75,i,f)
}
if (def==6) {
qvalue1 <- q6(x,n,0.25,i,f)
qvalue3 <- q6(x,n,0.75,i,f)
}
if (def==7) {
qvalue1 <- q7(x,n,0.25,i,f)
qvalue3 <- q7(x,n,0.75,i,f)
}
if (def==8) {
qvalue1 <- q8(x,n,0.25,i,f)
qvalue3 <- q8(x,n,0.75,i,f)
}
midm <- 0
myn <- 0
roundno4 <- round(n/4)
round3no4 <- round(3*n/4)
for (i in 1:n) {
if ((x[i]>=qvalue1) & (x[i]<=qvalue3)){
midm = midm + x[i]
myn = myn + 1
}
}
midm = midm / myn
return(midm)
}
(arm <- mean(x))
sqrtn <- sqrt(length(x))
(armse <- sd(x) / sqrtn)
(armose <- arm / armse)
(geo <- geomean(x))
(har <- harmean(x))
(qua <- quamean(x))
(win <- winmean(x))
(tri <- trimean(x))
(midr <- midrange(x))
midm <- array(NA,dim=8)
for (j in 1:8) midm[j] <- midmean(x,j)
midm
bitmap(file='test1.png')
lb <- win[,1] - 2*win[,2]
ub <- win[,1] + 2*win[,2]
if ((ylimmin == '') | (ylimmax == '')) plot(win[,1],type='b',main=main, xlab='j', pch=19, ylab='Winsorized Mean(j/n)', ylim=c(min(lb),max(ub))) else plot(win[,1],type='l',main=main, xlab='j', pch=19, ylab='Winsorized Mean(j/n)', ylim=c(ylimmin,ylimmax))
lines(ub,lty=3)
lines(lb,lty=3)
grid()
dev.off()
bitmap(file='test2.png')
lb <- tri[,1] - 2*tri[,2]
ub <- tri[,1] + 2*tri[,2]
if ((ylimmin == '') | (ylimmax == '')) plot(tri[,1],type='b',main=main, xlab='j', pch=19, ylab='Trimmed Mean(j/n)', ylim=c(min(lb),max(ub))) else plot(tri[,1],type='l',main=main, xlab='j', pch=19, ylab='Trimmed Mean(j/n)', ylim=c(ylimmin,ylimmax))
lines(ub,lty=3)
lines(lb,lty=3)
grid()
dev.off()
load(file='createtable')
a<-table.start()
a<-table.row.start(a)
a<-table.element(a,'Central Tendency - Ungrouped Data',4,TRUE)
a<-table.row.end(a)
a<-table.row.start(a)
a<-table.element(a,'Measure',header=TRUE)
a<-table.element(a,'Value',header=TRUE)
a<-table.element(a,'S.E.',header=TRUE)
a<-table.element(a,'Value/S.E.',header=TRUE)
a<-table.row.end(a)
a<-table.row.start(a)
a<-table.element(a,hyperlink('arithmetic_mean.htm', 'Arithmetic Mean', 'click to view the definition of the Arithmetic Mean'),header=TRUE)
a<-table.element(a,arm)
a<-table.element(a,hyperlink('arithmetic_mean_standard_error.htm', armse, 'click to view the definition of the Standard Error of the Arithmetic Mean'))
a<-table.element(a,armose)
a<-table.row.end(a)
a<-table.row.start(a)
a<-table.element(a,hyperlink('geometric_mean.htm', 'Geometric Mean', 'click to view the definition of the Geometric Mean'),header=TRUE)
a<-table.element(a,geo)
a<-table.element(a,'')
a<-table.row.end(a)
a<-table.row.start(a)
a<-table.element(a,hyperlink('harmonic_mean.htm', 'Harmonic Mean', 'click to view the definition of the Harmonic Mean'),header=TRUE)
a<-table.element(a,har)
a<-table.element(a,'')
a<-table.row.end(a)
a<-table.row.start(a)
a<-table.element(a,hyperlink('quadratic_mean.htm', 'Quadratic Mean', 'click to view the definition of the Quadratic Mean'),header=TRUE)
a<-table.element(a,qua)
a<-table.element(a,'')
a<-table.row.end(a)
for (j in 1:length(win[,1])) {
a<-table.row.start(a)
mylabel <- paste('Winsorized Mean (',j)
mylabel <- paste(mylabel,'/')
mylabel <- paste(mylabel,length(win[,1]))
mylabel <- paste(mylabel,')')
a<-table.element(a,hyperlink('winsorized_mean.htm', mylabel, 'click to view the definition of the Winsorized Mean'),header=TRUE)
a<-table.element(a,win[j,1])
a<-table.element(a,win[j,2])
a<-table.element(a,win[j,1]/win[j,2])
a<-table.row.end(a)
}
for (j in 1:length(tri[,1])) {
a<-table.row.start(a)
mylabel <- paste('Trimmed Mean (',j)
mylabel <- paste(mylabel,'/')
mylabel <- paste(mylabel,length(tri[,1]))
mylabel <- paste(mylabel,')')
a<-table.element(a,hyperlink('arithmetic_mean.htm', mylabel, 'click to view the definition of the Trimmed Mean'),header=TRUE)
a<-table.element(a,tri[j,1])
a<-table.element(a,tri[j,2])
a<-table.element(a,tri[j,1]/tri[j,2])
a<-table.row.end(a)
}
a<-table.row.start(a)
a<-table.element(a,hyperlink('median_1.htm', 'Median', 'click to view the definition of the Median'),header=TRUE)
a<-table.element(a,median(x))
a<-table.element(a,'')
a<-table.row.end(a)
a<-table.row.start(a)
a<-table.element(a,hyperlink('midrange.htm', 'Midrange', 'click to view the definition of the Midrange'),header=TRUE)
a<-table.element(a,midr)
a<-table.element(a,'')
a<-table.row.end(a)
a<-table.row.start(a)
mymid <- hyperlink('midmean.htm', 'Midmean', 'click to view the definition of the Midmean')
mylabel <- paste(mymid,hyperlink('method_1.htm','Weighted Average at Xnp',''),sep=' - ')
a<-table.element(a,mylabel,header=TRUE)
a<-table.element(a,midm[1])
a<-table.element(a,'')
a<-table.row.end(a)
a<-table.row.start(a)
mymid <- hyperlink('midmean.htm', 'Midmean', 'click to view the definition of the Midmean')
mylabel <- paste(mymid,hyperlink('method_2.htm','Weighted Average at X(n+1)p',''),sep=' - ')
a<-table.element(a,mylabel,header=TRUE)
a<-table.element(a,midm[2])
a<-table.element(a,'')
a<-table.row.end(a)
a<-table.row.start(a)
mymid <- hyperlink('midmean.htm', 'Midmean', 'click to view the definition of the Midmean')
mylabel <- paste(mymid,hyperlink('method_3.htm','Empirical Distribution Function',''),sep=' - ')
a<-table.element(a,mylabel,header=TRUE)
a<-table.element(a,midm[3])
a<-table.element(a,'')
a<-table.row.end(a)
a<-table.row.start(a)
mymid <- hyperlink('midmean.htm', 'Midmean', 'click to view the definition of the Midmean')
mylabel <- paste(mymid,hyperlink('method_4.htm','Empirical Distribution Function - Averaging',''),sep=' - ')
a<-table.element(a,mylabel,header=TRUE)
a<-table.element(a,midm[4])
a<-table.element(a,'')
a<-table.row.end(a)
a<-table.row.start(a)
mymid <- hyperlink('midmean.htm', 'Midmean', 'click to view the definition of the Midmean')
mylabel <- paste(mymid,hyperlink('method_5.htm','Empirical Distribution Function - Interpolation',''),sep=' - ')
a<-table.element(a,mylabel,header=TRUE)
a<-table.element(a,midm[5])
a<-table.element(a,'')
a<-table.row.end(a)
a<-table.row.start(a)
mymid <- hyperlink('midmean.htm', 'Midmean', 'click to view the definition of the Midmean')
mylabel <- paste(mymid,hyperlink('method_6.htm','Closest Observation',''),sep=' - ')
a<-table.element(a,mylabel,header=TRUE)
a<-table.element(a,midm[6])
a<-table.element(a,'')
a<-table.row.end(a)
a<-table.row.start(a)
mymid <- hyperlink('midmean.htm', 'Midmean', 'click to view the definition of the Midmean')
mylabel <- paste(mymid,hyperlink('method_7.htm','True Basic - Statistics Graphics Toolkit',''),sep=' - ')
a<-table.element(a,mylabel,header=TRUE)
a<-table.element(a,midm[7])
a<-table.element(a,'')
a<-table.row.end(a)
a<-table.row.start(a)
mymid <- hyperlink('midmean.htm', 'Midmean', 'click to view the definition of the Midmean')
mylabel <- paste(mymid,hyperlink('method_8.htm','MS Excel (old versions)',''),sep=' - ')
a<-table.element(a,mylabel,header=TRUE)
a<-table.element(a,midm[8])
a<-table.element(a,'')
a<-table.row.end(a)
a<-table.row.start(a)
a<-table.element(a,'Number of observations',header=TRUE)
a<-table.element(a,length(x))
a<-table.element(a,'')
a<-table.row.end(a)
a<-table.end(a)
table.save(a,file='mytable.tab')