Free Statistics

of Irreproducible Research!

Author's title

Author*Unverified author*
R Software Modulerwasp_logisticregression.wasp
Title produced by softwareBias-Reduced Logistic Regression
Date of computationTue, 03 Sep 2013 07:09:58 -0400
Cite this page as followsStatistical Computations at FreeStatistics.org, Office for Research Development and Education, URL https://freestatistics.org/blog/index.php?v=date/2013/Sep/03/t1378206671eqrsu04ztddeb8d.htm/, Retrieved Sun, 28 Apr 2024 21:57:28 +0000
Statistical Computations at FreeStatistics.org, Office for Research Development and Education, URL https://freestatistics.org/blog/index.php?pk=211385, Retrieved Sun, 28 Apr 2024 21:57:28 +0000
QR Codes:

Original text written by user:
IsPrivate?No (this computation is public)
User-defined keywords
Estimated Impact195
Family? (F = Feedback message, R = changed R code, M = changed R Module, P = changed Parameters, D = changed Data)
-       [Bias-Reduced Logistic Regression] [] [2013-09-03 11:09:58] [d41d8cd98f00b204e9800998ecf8427e] [Current]
Feedback Forum

Post a new message
Dataseries X:
0	0	2	9	3	1	2	7
0	0	3	8	5	2	0	2
0	0	4	14	2	2	1	4
1	4	3	15	4	0	1	4
1	17	3	9	0	1	4	7
1	4	9	5	0	1	4	4
0	0	6	1	0	4	4	3
0	13	5	0	0	2	6	1
1	0	11	13	2	8	6	5
1	0	9	13	5	4	4	2
0	3	7	9	3	0	4	3
0	1	7	10	3	0	5	3
1	3	6	4	0	2	5	5
1	5	3	6	0	1	5	4
0	1	5	3	0	3	7	3
1	3	11	6	3	1	9	8
1	12	5	2	4	4	8	2
0	0	12	0	4	5	0	3
1	11	5	6	3	5	4	7
1	16	8	4	3	8	3	5
0	10	7	9	5	5	4	9
1	16	3	21	10	10	7	4
0	7	8	7	5	7	5	5
1	8	3	11	3	6	8	12
1	19	6	14	1	8	3	10
1	13	5	10	0	4	6	17
0	16	8	14	1	6	6	10
1	10	9	6	13	5	3	9
1	13	9	22	7	6	8	10
1	9	12	6	10	3	7	8
0	10	9	2	5	2	3	11
0	13	8	13	4	7	6	5
0	2	14	6	3	12	6	10
0	25	8	9	1	8	7	5
0	5	4	5	1	6	0	8
0	12	7	8	0	7	6	6
0	11	1	8	0	4	10	5
0	6	4	7	2	4	4	4
0	27	5	5	3	3	12	5
0	12	4	10	2	3	4	0
0	10	12	16	7	7	11	16
0	10	8	14	11	5	23	4
0	17	10	18	7	9	10	17
0	24	16	10	8	15	4	24
0	2	18	18	9	6	9	24
0	7	9	13	7	6	7	0
0	8	11	8	12	10	5	8
0	12	22	10	6	5	4	4
0	13	18	20	5	7	4	3
0	14	10	20	7	7	11	24
0	15	24	14	17	12	20	0
0	14	10	35	3	11	17	3
0	14	7	35	11	14	7	22
0	12	2	28	7	13	12	2
0	13	3	12	12	3	10	16
0	22	5	24	8	6	12	21
0	24	5	20	6	8	9	22
1	16	6	14	30	0	16	16
0	8	5	11	9	8	18	7
0	41	10	23	8	14	22	7
1	31	11	31	28	36	5	38
0	30	19	17	33	17	23	15
0	25	24	18	28	37	25	43
0	28	12	25	24	23	8	13
0	26	17	34	35	20	14	17
0	26	19	11	21	38	14	19
0	28	12	11	11	18	10	32
0	32	10	30	7	39	24	33
0	10	20	23	48	20	9	17
0	34	21	15	4	40	20	33
0	13	23	11	32	32	13	35
0	32	25	18	15	28	7	11
0	21	18	24	9	10	11	10
0	20	28	20	35	12	33	28
0	22	28	17	33	18	14	34
1	38	24	28	34	13	30	30
0	12	11	19	24	30	20	37
0	15	11	16	21	10	11	20
0	15	11	16	21	10	7	21
0	15	11	16	21	10	7	21


Summary of computational transaction
Raw Inputview raw input (R code)
Raw Outputview raw output of R engine
Computing time2 seconds
R Server'Sir Ronald Aylmer Fisher' @ fisher.wessa.net

\begin{tabular}{lllllllll}
\hline
Summary of computational transaction \tabularnewline
Raw Input & view raw input (R code)  \tabularnewline
Raw Output & view raw output of R engine  \tabularnewline
Computing time & 2 seconds \tabularnewline
R Server & 'Sir Ronald Aylmer Fisher' @ fisher.wessa.net \tabularnewline
\hline
\end{tabular}
%Source: https://freestatistics.org/blog/index.php?pk=211385&T=0

[TABLE]
[ROW][C]Summary of computational transaction[/C][/ROW]
[ROW][C]Raw Input[/C][C]view raw input (R code) [/C][/ROW]
[ROW][C]Raw Output[/C][C]view raw output of R engine [/C][/ROW]
[ROW][C]Computing time[/C][C]2 seconds[/C][/ROW]
[ROW][C]R Server[/C][C]'Sir Ronald Aylmer Fisher' @ fisher.wessa.net[/C][/ROW]
[/TABLE]
Source: https://freestatistics.org/blog/index.php?pk=211385&T=0

Globally Unique Identifier (entire table): ba.freestatistics.org/blog/index.php?pk=211385&T=0

As an alternative you can also use a QR Code:  

The GUIDs for individual cells are displayed in the table below:

Summary of computational transaction
Raw Inputview raw input (R code)
Raw Outputview raw output of R engine
Computing time2 seconds
R Server'Sir Ronald Aylmer Fisher' @ fisher.wessa.net


Coefficients of Bias-Reduced Logistic Regression
VariableParameterS.E.t-stat2-sided p-value
(Intercept)-0.07167602904378710.627404580729864-0.114242119431780.909363841814595
X10.02846558966095940.04075626465374450.6984347045244760.487155175947454
X2-0.06038360850326520.0627877661291137-0.9617097760588460.339414152560151
X3-0.007445492318209270.0434632336242405-0.1713055310743550.864464066160995
X40.03554878429242430.04110539078894530.8648204921575540.39000960231494
X5-0.07286379343922510.0585623467027098-1.244208907971470.217457949851749
X6-0.05160786633451650.0607213955560832-0.849912388572340.398191182366369
X70.01652061115415820.04170468440173430.3961332255872730.69317826450167

\begin{tabular}{lllllllll}
\hline
Coefficients of Bias-Reduced Logistic Regression \tabularnewline
Variable & Parameter & S.E. & t-stat & 2-sided p-value \tabularnewline
(Intercept) & -0.0716760290437871 & 0.627404580729864 & -0.11424211943178 & 0.909363841814595 \tabularnewline
X1 & 0.0284655896609594 & 0.0407562646537445 & 0.698434704524476 & 0.487155175947454 \tabularnewline
X2 & -0.0603836085032652 & 0.0627877661291137 & -0.961709776058846 & 0.339414152560151 \tabularnewline
X3 & -0.00744549231820927 & 0.0434632336242405 & -0.171305531074355 & 0.864464066160995 \tabularnewline
X4 & 0.0355487842924243 & 0.0411053907889453 & 0.864820492157554 & 0.39000960231494 \tabularnewline
X5 & -0.0728637934392251 & 0.0585623467027098 & -1.24420890797147 & 0.217457949851749 \tabularnewline
X6 & -0.0516078663345165 & 0.0607213955560832 & -0.84991238857234 & 0.398191182366369 \tabularnewline
X7 & 0.0165206111541582 & 0.0417046844017343 & 0.396133225587273 & 0.69317826450167 \tabularnewline
\hline
\end{tabular}
%Source: https://freestatistics.org/blog/index.php?pk=211385&T=1

[TABLE]
[ROW][C]Coefficients of Bias-Reduced Logistic Regression[/C][/ROW]
[ROW][C]Variable[/C][C]Parameter[/C][C]S.E.[/C][C]t-stat[/C][C]2-sided p-value[/C][/ROW]
[ROW][C](Intercept)[/C][C]-0.0716760290437871[/C][C]0.627404580729864[/C][C]-0.11424211943178[/C][C]0.909363841814595[/C][/ROW]
[ROW][C]X1[/C][C]0.0284655896609594[/C][C]0.0407562646537445[/C][C]0.698434704524476[/C][C]0.487155175947454[/C][/ROW]
[ROW][C]X2[/C][C]-0.0603836085032652[/C][C]0.0627877661291137[/C][C]-0.961709776058846[/C][C]0.339414152560151[/C][/ROW]
[ROW][C]X3[/C][C]-0.00744549231820927[/C][C]0.0434632336242405[/C][C]-0.171305531074355[/C][C]0.864464066160995[/C][/ROW]
[ROW][C]X4[/C][C]0.0355487842924243[/C][C]0.0411053907889453[/C][C]0.864820492157554[/C][C]0.39000960231494[/C][/ROW]
[ROW][C]X5[/C][C]-0.0728637934392251[/C][C]0.0585623467027098[/C][C]-1.24420890797147[/C][C]0.217457949851749[/C][/ROW]
[ROW][C]X6[/C][C]-0.0516078663345165[/C][C]0.0607213955560832[/C][C]-0.84991238857234[/C][C]0.398191182366369[/C][/ROW]
[ROW][C]X7[/C][C]0.0165206111541582[/C][C]0.0417046844017343[/C][C]0.396133225587273[/C][C]0.69317826450167[/C][/ROW]
[/TABLE]
Source: https://freestatistics.org/blog/index.php?pk=211385&T=1

Globally Unique Identifier (entire table): ba.freestatistics.org/blog/index.php?pk=211385&T=1

As an alternative you can also use a QR Code:  

The GUIDs for individual cells are displayed in the table below:

Coefficients of Bias-Reduced Logistic Regression
VariableParameterS.E.t-stat2-sided p-value
(Intercept)-0.07167602904378710.627404580729864-0.114242119431780.909363841814595
X10.02846558966095940.04075626465374450.6984347045244760.487155175947454
X2-0.06038360850326520.0627877661291137-0.9617097760588460.339414152560151
X3-0.007445492318209270.0434632336242405-0.1713055310743550.864464066160995
X40.03554878429242430.04110539078894530.8648204921575540.39000960231494
X5-0.07286379343922510.0585623467027098-1.244208907971470.217457949851749
X6-0.05160786633451650.0607213955560832-0.849912388572340.398191182366369
X70.01652061115415820.04170468440173430.3961332255872730.69317826450167


Summary of Bias-Reduced Logistic Regression
Deviance83.4094230114754
Penalized deviance36.6731208308847
Residual Degrees of Freedom72
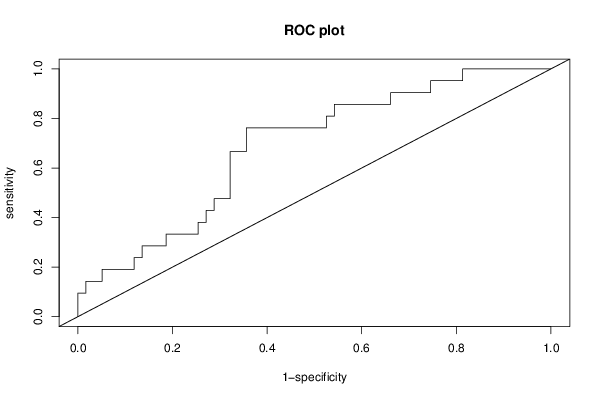
ROC Area0.685230024213075
Hosmer–Lemeshow test
Chi-square6.56643362327143
Degrees of Freedom8
P(>Chi)0.584048582410693

\begin{tabular}{lllllllll}
\hline
Summary of Bias-Reduced Logistic Regression \tabularnewline
Deviance & 83.4094230114754 \tabularnewline
Penalized deviance & 36.6731208308847 \tabularnewline
Residual Degrees of Freedom & 72 \tabularnewline
ROC Area & 0.685230024213075 \tabularnewline
Hosmer–Lemeshow test \tabularnewline
Chi-square & 6.56643362327143 \tabularnewline
Degrees of Freedom & 8 \tabularnewline
P(>Chi) & 0.584048582410693 \tabularnewline
\hline
\end{tabular}
%Source: https://freestatistics.org/blog/index.php?pk=211385&T=2

[TABLE]
[ROW][C]Summary of Bias-Reduced Logistic Regression[/C][/ROW]
[ROW][C]Deviance[/C][C]83.4094230114754[/C][/ROW]
[ROW][C]Penalized deviance[/C][C]36.6731208308847[/C][/ROW]
[ROW][C]Residual Degrees of Freedom[/C][C]72[/C][/ROW]
[ROW][C]ROC Area[/C][C]0.685230024213075[/C][/ROW]
[ROW][C]Hosmer–Lemeshow test[/C][/ROW]
[ROW][C]Chi-square[/C][C]6.56643362327143[/C][/ROW]
[ROW][C]Degrees of Freedom[/C][C]8[/C][/ROW]
[ROW][C]P(>Chi)[/C][C]0.584048582410693[/C][/ROW]
[/TABLE]
Source: https://freestatistics.org/blog/index.php?pk=211385&T=2

Globally Unique Identifier (entire table): ba.freestatistics.org/blog/index.php?pk=211385&T=2

As an alternative you can also use a QR Code:  

The GUIDs for individual cells are displayed in the table below:

Summary of Bias-Reduced Logistic Regression
Deviance83.4094230114754
Penalized deviance36.6731208308847
Residual Degrees of Freedom72
ROC Area0.685230024213075
Hosmer–Lemeshow test
Chi-square6.56643362327143
Degrees of Freedom8
P(>Chi)0.584048582410693


Fit of Logistic Regression
IndexActualFittedError
100.44689070331572-0.44689070331572
200.438479989037766-0.438479989037766
300.382818349714424-0.382818349714424
410.4765229846606580.523477015339342
510.5001069395285340.499893060471466
610.3204495936065540.679550406393446
700.291161838662597-0.291161838662597
800.391170298837663-0.391170298837663
910.1719963874616690.828003612538331
1010.2691338691041940.730866130895806
1100.371404259758119-0.371404259758119
1200.344753514545556-0.344753514545556
1310.3319171633219820.668082836678018
1410.3965185350928210.603481464907178
1500.289513180874367-0.289513180874367
1610.2701828136117780.729817186388222
1710.3598581825215690.640141817478431
1800.275111510417849-0.275111510417849
1910.3885039067002190.611496093299781
2010.3368056627511290.663194337248871
2100.372610053086996-0.372610053086996
2210.3493141113636440.650685888636356
2300.285907714301524-0.285907714301524
2410.3425041771308740.657495822869126
2510.3695034934752040.630496506524796
2610.4017332745819610.598266725418039
2700.320906848546325-0.320906848546325
2810.4296036494470920.570396350552908
2910.3005090974030810.699490902596919
3010.3369410992578280.663058900742172
3100.42887462361861-0.42887462361861
3200.29392866102918-0.29392866102918
3300.139800422461423-0.139800422461423
3400.323851388517152-0.323851388517152
3500.382823956869788-0.382823956869788
3600.282335069065897-0.282335069065897
3700.353558700237624-0.353558700237624
3800.364649082895631-0.364649082895631
3900.427786733561762-0.427786733561762
4000.401311477981663-0.401311477981663
4100.232310034311067-0.232310034311067
4200.187169692200259-0.187169692200259
4300.275323839633929-0.275323839633929
4400.259686624879592-0.259686624879592
4500.194522333263953-0.194522333263953
4600.256878353799476-0.256878353799476
4700.269795196241547-0.269795196241547
4800.193979210362284-0.193979210362284
4900.193627368374547-0.193627368374547
5000.297694514734268-0.297694514734268
5100.0758351054045488-0.0758351054045488
5200.113024439070432-0.113024439070432
5300.272238797180089-0.272238797180089
5400.20685779516367-0.20685779516367
5500.496031345729327-0.496031345729327
5600.413092190864126-0.413092190864126
5700.423123340712283-0.423123340712283
5810.6040340404652330.395965959534767
5900.21348614967079-0.21348614967079
6000.192305152579133-0.192305152579133
6110.2071387439040520.792861256095948
6200.182975527311065-0.182975527311065
6300.0382847586610879-0.0382847586610879
6400.23037915368045-0.23037915368045
6500.219948427298393-0.219948427298393
6600.0478032583099287-0.0478032583099287
6700.27109501934184-0.27109501934184
6800.0364658019421961-0.0364658019421961
6900.249647484504908-0.249647484504908
7000.023136897080999-0.023136897080999
7100.0787750492944729-0.0787750492944729
7200.0765007793222567-0.0765007793222567
7300.174988840620275-0.174988840620275
7400.0986197487382554-0.0986197487382554
7500.173360533240052-0.173360533240052
7610.1917231370623080.808276862937692
7700.0920037681037263-0.0920037681037263
7800.343569472471536-0.343569472471536
7900.395446312013599-0.395446312013599
8000.395446312013599-0.395446312013599

\begin{tabular}{lllllllll}
\hline
Fit of Logistic Regression \tabularnewline
Index & Actual & Fitted & Error \tabularnewline
1 & 0 & 0.44689070331572 & -0.44689070331572 \tabularnewline
2 & 0 & 0.438479989037766 & -0.438479989037766 \tabularnewline
3 & 0 & 0.382818349714424 & -0.382818349714424 \tabularnewline
4 & 1 & 0.476522984660658 & 0.523477015339342 \tabularnewline
5 & 1 & 0.500106939528534 & 0.499893060471466 \tabularnewline
6 & 1 & 0.320449593606554 & 0.679550406393446 \tabularnewline
7 & 0 & 0.291161838662597 & -0.291161838662597 \tabularnewline
8 & 0 & 0.391170298837663 & -0.391170298837663 \tabularnewline
9 & 1 & 0.171996387461669 & 0.828003612538331 \tabularnewline
10 & 1 & 0.269133869104194 & 0.730866130895806 \tabularnewline
11 & 0 & 0.371404259758119 & -0.371404259758119 \tabularnewline
12 & 0 & 0.344753514545556 & -0.344753514545556 \tabularnewline
13 & 1 & 0.331917163321982 & 0.668082836678018 \tabularnewline
14 & 1 & 0.396518535092821 & 0.603481464907178 \tabularnewline
15 & 0 & 0.289513180874367 & -0.289513180874367 \tabularnewline
16 & 1 & 0.270182813611778 & 0.729817186388222 \tabularnewline
17 & 1 & 0.359858182521569 & 0.640141817478431 \tabularnewline
18 & 0 & 0.275111510417849 & -0.275111510417849 \tabularnewline
19 & 1 & 0.388503906700219 & 0.611496093299781 \tabularnewline
20 & 1 & 0.336805662751129 & 0.663194337248871 \tabularnewline
21 & 0 & 0.372610053086996 & -0.372610053086996 \tabularnewline
22 & 1 & 0.349314111363644 & 0.650685888636356 \tabularnewline
23 & 0 & 0.285907714301524 & -0.285907714301524 \tabularnewline
24 & 1 & 0.342504177130874 & 0.657495822869126 \tabularnewline
25 & 1 & 0.369503493475204 & 0.630496506524796 \tabularnewline
26 & 1 & 0.401733274581961 & 0.598266725418039 \tabularnewline
27 & 0 & 0.320906848546325 & -0.320906848546325 \tabularnewline
28 & 1 & 0.429603649447092 & 0.570396350552908 \tabularnewline
29 & 1 & 0.300509097403081 & 0.699490902596919 \tabularnewline
30 & 1 & 0.336941099257828 & 0.663058900742172 \tabularnewline
31 & 0 & 0.42887462361861 & -0.42887462361861 \tabularnewline
32 & 0 & 0.29392866102918 & -0.29392866102918 \tabularnewline
33 & 0 & 0.139800422461423 & -0.139800422461423 \tabularnewline
34 & 0 & 0.323851388517152 & -0.323851388517152 \tabularnewline
35 & 0 & 0.382823956869788 & -0.382823956869788 \tabularnewline
36 & 0 & 0.282335069065897 & -0.282335069065897 \tabularnewline
37 & 0 & 0.353558700237624 & -0.353558700237624 \tabularnewline
38 & 0 & 0.364649082895631 & -0.364649082895631 \tabularnewline
39 & 0 & 0.427786733561762 & -0.427786733561762 \tabularnewline
40 & 0 & 0.401311477981663 & -0.401311477981663 \tabularnewline
41 & 0 & 0.232310034311067 & -0.232310034311067 \tabularnewline
42 & 0 & 0.187169692200259 & -0.187169692200259 \tabularnewline
43 & 0 & 0.275323839633929 & -0.275323839633929 \tabularnewline
44 & 0 & 0.259686624879592 & -0.259686624879592 \tabularnewline
45 & 0 & 0.194522333263953 & -0.194522333263953 \tabularnewline
46 & 0 & 0.256878353799476 & -0.256878353799476 \tabularnewline
47 & 0 & 0.269795196241547 & -0.269795196241547 \tabularnewline
48 & 0 & 0.193979210362284 & -0.193979210362284 \tabularnewline
49 & 0 & 0.193627368374547 & -0.193627368374547 \tabularnewline
50 & 0 & 0.297694514734268 & -0.297694514734268 \tabularnewline
51 & 0 & 0.0758351054045488 & -0.0758351054045488 \tabularnewline
52 & 0 & 0.113024439070432 & -0.113024439070432 \tabularnewline
53 & 0 & 0.272238797180089 & -0.272238797180089 \tabularnewline
54 & 0 & 0.20685779516367 & -0.20685779516367 \tabularnewline
55 & 0 & 0.496031345729327 & -0.496031345729327 \tabularnewline
56 & 0 & 0.413092190864126 & -0.413092190864126 \tabularnewline
57 & 0 & 0.423123340712283 & -0.423123340712283 \tabularnewline
58 & 1 & 0.604034040465233 & 0.395965959534767 \tabularnewline
59 & 0 & 0.21348614967079 & -0.21348614967079 \tabularnewline
60 & 0 & 0.192305152579133 & -0.192305152579133 \tabularnewline
61 & 1 & 0.207138743904052 & 0.792861256095948 \tabularnewline
62 & 0 & 0.182975527311065 & -0.182975527311065 \tabularnewline
63 & 0 & 0.0382847586610879 & -0.0382847586610879 \tabularnewline
64 & 0 & 0.23037915368045 & -0.23037915368045 \tabularnewline
65 & 0 & 0.219948427298393 & -0.219948427298393 \tabularnewline
66 & 0 & 0.0478032583099287 & -0.0478032583099287 \tabularnewline
67 & 0 & 0.27109501934184 & -0.27109501934184 \tabularnewline
68 & 0 & 0.0364658019421961 & -0.0364658019421961 \tabularnewline
69 & 0 & 0.249647484504908 & -0.249647484504908 \tabularnewline
70 & 0 & 0.023136897080999 & -0.023136897080999 \tabularnewline
71 & 0 & 0.0787750492944729 & -0.0787750492944729 \tabularnewline
72 & 0 & 0.0765007793222567 & -0.0765007793222567 \tabularnewline
73 & 0 & 0.174988840620275 & -0.174988840620275 \tabularnewline
74 & 0 & 0.0986197487382554 & -0.0986197487382554 \tabularnewline
75 & 0 & 0.173360533240052 & -0.173360533240052 \tabularnewline
76 & 1 & 0.191723137062308 & 0.808276862937692 \tabularnewline
77 & 0 & 0.0920037681037263 & -0.0920037681037263 \tabularnewline
78 & 0 & 0.343569472471536 & -0.343569472471536 \tabularnewline
79 & 0 & 0.395446312013599 & -0.395446312013599 \tabularnewline
80 & 0 & 0.395446312013599 & -0.395446312013599 \tabularnewline
\hline
\end{tabular}
%Source: https://freestatistics.org/blog/index.php?pk=211385&T=3

[TABLE]
[ROW][C]Fit of Logistic Regression[/C][/ROW]
[ROW][C]Index[/C][C]Actual[/C][C]Fitted[/C][C]Error[/C][/ROW]
[ROW][C]1[/C][C]0[/C][C]0.44689070331572[/C][C]-0.44689070331572[/C][/ROW]
[ROW][C]2[/C][C]0[/C][C]0.438479989037766[/C][C]-0.438479989037766[/C][/ROW]
[ROW][C]3[/C][C]0[/C][C]0.382818349714424[/C][C]-0.382818349714424[/C][/ROW]
[ROW][C]4[/C][C]1[/C][C]0.476522984660658[/C][C]0.523477015339342[/C][/ROW]
[ROW][C]5[/C][C]1[/C][C]0.500106939528534[/C][C]0.499893060471466[/C][/ROW]
[ROW][C]6[/C][C]1[/C][C]0.320449593606554[/C][C]0.679550406393446[/C][/ROW]
[ROW][C]7[/C][C]0[/C][C]0.291161838662597[/C][C]-0.291161838662597[/C][/ROW]
[ROW][C]8[/C][C]0[/C][C]0.391170298837663[/C][C]-0.391170298837663[/C][/ROW]
[ROW][C]9[/C][C]1[/C][C]0.171996387461669[/C][C]0.828003612538331[/C][/ROW]
[ROW][C]10[/C][C]1[/C][C]0.269133869104194[/C][C]0.730866130895806[/C][/ROW]
[ROW][C]11[/C][C]0[/C][C]0.371404259758119[/C][C]-0.371404259758119[/C][/ROW]
[ROW][C]12[/C][C]0[/C][C]0.344753514545556[/C][C]-0.344753514545556[/C][/ROW]
[ROW][C]13[/C][C]1[/C][C]0.331917163321982[/C][C]0.668082836678018[/C][/ROW]
[ROW][C]14[/C][C]1[/C][C]0.396518535092821[/C][C]0.603481464907178[/C][/ROW]
[ROW][C]15[/C][C]0[/C][C]0.289513180874367[/C][C]-0.289513180874367[/C][/ROW]
[ROW][C]16[/C][C]1[/C][C]0.270182813611778[/C][C]0.729817186388222[/C][/ROW]
[ROW][C]17[/C][C]1[/C][C]0.359858182521569[/C][C]0.640141817478431[/C][/ROW]
[ROW][C]18[/C][C]0[/C][C]0.275111510417849[/C][C]-0.275111510417849[/C][/ROW]
[ROW][C]19[/C][C]1[/C][C]0.388503906700219[/C][C]0.611496093299781[/C][/ROW]
[ROW][C]20[/C][C]1[/C][C]0.336805662751129[/C][C]0.663194337248871[/C][/ROW]
[ROW][C]21[/C][C]0[/C][C]0.372610053086996[/C][C]-0.372610053086996[/C][/ROW]
[ROW][C]22[/C][C]1[/C][C]0.349314111363644[/C][C]0.650685888636356[/C][/ROW]
[ROW][C]23[/C][C]0[/C][C]0.285907714301524[/C][C]-0.285907714301524[/C][/ROW]
[ROW][C]24[/C][C]1[/C][C]0.342504177130874[/C][C]0.657495822869126[/C][/ROW]
[ROW][C]25[/C][C]1[/C][C]0.369503493475204[/C][C]0.630496506524796[/C][/ROW]
[ROW][C]26[/C][C]1[/C][C]0.401733274581961[/C][C]0.598266725418039[/C][/ROW]
[ROW][C]27[/C][C]0[/C][C]0.320906848546325[/C][C]-0.320906848546325[/C][/ROW]
[ROW][C]28[/C][C]1[/C][C]0.429603649447092[/C][C]0.570396350552908[/C][/ROW]
[ROW][C]29[/C][C]1[/C][C]0.300509097403081[/C][C]0.699490902596919[/C][/ROW]
[ROW][C]30[/C][C]1[/C][C]0.336941099257828[/C][C]0.663058900742172[/C][/ROW]
[ROW][C]31[/C][C]0[/C][C]0.42887462361861[/C][C]-0.42887462361861[/C][/ROW]
[ROW][C]32[/C][C]0[/C][C]0.29392866102918[/C][C]-0.29392866102918[/C][/ROW]
[ROW][C]33[/C][C]0[/C][C]0.139800422461423[/C][C]-0.139800422461423[/C][/ROW]
[ROW][C]34[/C][C]0[/C][C]0.323851388517152[/C][C]-0.323851388517152[/C][/ROW]
[ROW][C]35[/C][C]0[/C][C]0.382823956869788[/C][C]-0.382823956869788[/C][/ROW]
[ROW][C]36[/C][C]0[/C][C]0.282335069065897[/C][C]-0.282335069065897[/C][/ROW]
[ROW][C]37[/C][C]0[/C][C]0.353558700237624[/C][C]-0.353558700237624[/C][/ROW]
[ROW][C]38[/C][C]0[/C][C]0.364649082895631[/C][C]-0.364649082895631[/C][/ROW]
[ROW][C]39[/C][C]0[/C][C]0.427786733561762[/C][C]-0.427786733561762[/C][/ROW]
[ROW][C]40[/C][C]0[/C][C]0.401311477981663[/C][C]-0.401311477981663[/C][/ROW]
[ROW][C]41[/C][C]0[/C][C]0.232310034311067[/C][C]-0.232310034311067[/C][/ROW]
[ROW][C]42[/C][C]0[/C][C]0.187169692200259[/C][C]-0.187169692200259[/C][/ROW]
[ROW][C]43[/C][C]0[/C][C]0.275323839633929[/C][C]-0.275323839633929[/C][/ROW]
[ROW][C]44[/C][C]0[/C][C]0.259686624879592[/C][C]-0.259686624879592[/C][/ROW]
[ROW][C]45[/C][C]0[/C][C]0.194522333263953[/C][C]-0.194522333263953[/C][/ROW]
[ROW][C]46[/C][C]0[/C][C]0.256878353799476[/C][C]-0.256878353799476[/C][/ROW]
[ROW][C]47[/C][C]0[/C][C]0.269795196241547[/C][C]-0.269795196241547[/C][/ROW]
[ROW][C]48[/C][C]0[/C][C]0.193979210362284[/C][C]-0.193979210362284[/C][/ROW]
[ROW][C]49[/C][C]0[/C][C]0.193627368374547[/C][C]-0.193627368374547[/C][/ROW]
[ROW][C]50[/C][C]0[/C][C]0.297694514734268[/C][C]-0.297694514734268[/C][/ROW]
[ROW][C]51[/C][C]0[/C][C]0.0758351054045488[/C][C]-0.0758351054045488[/C][/ROW]
[ROW][C]52[/C][C]0[/C][C]0.113024439070432[/C][C]-0.113024439070432[/C][/ROW]
[ROW][C]53[/C][C]0[/C][C]0.272238797180089[/C][C]-0.272238797180089[/C][/ROW]
[ROW][C]54[/C][C]0[/C][C]0.20685779516367[/C][C]-0.20685779516367[/C][/ROW]
[ROW][C]55[/C][C]0[/C][C]0.496031345729327[/C][C]-0.496031345729327[/C][/ROW]
[ROW][C]56[/C][C]0[/C][C]0.413092190864126[/C][C]-0.413092190864126[/C][/ROW]
[ROW][C]57[/C][C]0[/C][C]0.423123340712283[/C][C]-0.423123340712283[/C][/ROW]
[ROW][C]58[/C][C]1[/C][C]0.604034040465233[/C][C]0.395965959534767[/C][/ROW]
[ROW][C]59[/C][C]0[/C][C]0.21348614967079[/C][C]-0.21348614967079[/C][/ROW]
[ROW][C]60[/C][C]0[/C][C]0.192305152579133[/C][C]-0.192305152579133[/C][/ROW]
[ROW][C]61[/C][C]1[/C][C]0.207138743904052[/C][C]0.792861256095948[/C][/ROW]
[ROW][C]62[/C][C]0[/C][C]0.182975527311065[/C][C]-0.182975527311065[/C][/ROW]
[ROW][C]63[/C][C]0[/C][C]0.0382847586610879[/C][C]-0.0382847586610879[/C][/ROW]
[ROW][C]64[/C][C]0[/C][C]0.23037915368045[/C][C]-0.23037915368045[/C][/ROW]
[ROW][C]65[/C][C]0[/C][C]0.219948427298393[/C][C]-0.219948427298393[/C][/ROW]
[ROW][C]66[/C][C]0[/C][C]0.0478032583099287[/C][C]-0.0478032583099287[/C][/ROW]
[ROW][C]67[/C][C]0[/C][C]0.27109501934184[/C][C]-0.27109501934184[/C][/ROW]
[ROW][C]68[/C][C]0[/C][C]0.0364658019421961[/C][C]-0.0364658019421961[/C][/ROW]
[ROW][C]69[/C][C]0[/C][C]0.249647484504908[/C][C]-0.249647484504908[/C][/ROW]
[ROW][C]70[/C][C]0[/C][C]0.023136897080999[/C][C]-0.023136897080999[/C][/ROW]
[ROW][C]71[/C][C]0[/C][C]0.0787750492944729[/C][C]-0.0787750492944729[/C][/ROW]
[ROW][C]72[/C][C]0[/C][C]0.0765007793222567[/C][C]-0.0765007793222567[/C][/ROW]
[ROW][C]73[/C][C]0[/C][C]0.174988840620275[/C][C]-0.174988840620275[/C][/ROW]
[ROW][C]74[/C][C]0[/C][C]0.0986197487382554[/C][C]-0.0986197487382554[/C][/ROW]
[ROW][C]75[/C][C]0[/C][C]0.173360533240052[/C][C]-0.173360533240052[/C][/ROW]
[ROW][C]76[/C][C]1[/C][C]0.191723137062308[/C][C]0.808276862937692[/C][/ROW]
[ROW][C]77[/C][C]0[/C][C]0.0920037681037263[/C][C]-0.0920037681037263[/C][/ROW]
[ROW][C]78[/C][C]0[/C][C]0.343569472471536[/C][C]-0.343569472471536[/C][/ROW]
[ROW][C]79[/C][C]0[/C][C]0.395446312013599[/C][C]-0.395446312013599[/C][/ROW]
[ROW][C]80[/C][C]0[/C][C]0.395446312013599[/C][C]-0.395446312013599[/C][/ROW]
[/TABLE]
Source: https://freestatistics.org/blog/index.php?pk=211385&T=3

Globally Unique Identifier (entire table): ba.freestatistics.org/blog/index.php?pk=211385&T=3

As an alternative you can also use a QR Code:  

The GUIDs for individual cells are displayed in the table below:

Fit of Logistic Regression
IndexActualFittedError
100.44689070331572-0.44689070331572
200.438479989037766-0.438479989037766
300.382818349714424-0.382818349714424
410.4765229846606580.523477015339342
510.5001069395285340.499893060471466
610.3204495936065540.679550406393446
700.291161838662597-0.291161838662597
800.391170298837663-0.391170298837663
910.1719963874616690.828003612538331
1010.2691338691041940.730866130895806
1100.371404259758119-0.371404259758119
1200.344753514545556-0.344753514545556
1310.3319171633219820.668082836678018
1410.3965185350928210.603481464907178
1500.289513180874367-0.289513180874367
1610.2701828136117780.729817186388222
1710.3598581825215690.640141817478431
1800.275111510417849-0.275111510417849
1910.3885039067002190.611496093299781
2010.3368056627511290.663194337248871
2100.372610053086996-0.372610053086996
2210.3493141113636440.650685888636356
2300.285907714301524-0.285907714301524
2410.3425041771308740.657495822869126
2510.3695034934752040.630496506524796
2610.4017332745819610.598266725418039
2700.320906848546325-0.320906848546325
2810.4296036494470920.570396350552908
2910.3005090974030810.699490902596919
3010.3369410992578280.663058900742172
3100.42887462361861-0.42887462361861
3200.29392866102918-0.29392866102918
3300.139800422461423-0.139800422461423
3400.323851388517152-0.323851388517152
3500.382823956869788-0.382823956869788
3600.282335069065897-0.282335069065897
3700.353558700237624-0.353558700237624
3800.364649082895631-0.364649082895631
3900.427786733561762-0.427786733561762
4000.401311477981663-0.401311477981663
4100.232310034311067-0.232310034311067
4200.187169692200259-0.187169692200259
4300.275323839633929-0.275323839633929
4400.259686624879592-0.259686624879592
4500.194522333263953-0.194522333263953
4600.256878353799476-0.256878353799476
4700.269795196241547-0.269795196241547
4800.193979210362284-0.193979210362284
4900.193627368374547-0.193627368374547
5000.297694514734268-0.297694514734268
5100.0758351054045488-0.0758351054045488
5200.113024439070432-0.113024439070432
5300.272238797180089-0.272238797180089
5400.20685779516367-0.20685779516367
5500.496031345729327-0.496031345729327
5600.413092190864126-0.413092190864126
5700.423123340712283-0.423123340712283
5810.6040340404652330.395965959534767
5900.21348614967079-0.21348614967079
6000.192305152579133-0.192305152579133
6110.2071387439040520.792861256095948
6200.182975527311065-0.182975527311065
6300.0382847586610879-0.0382847586610879
6400.23037915368045-0.23037915368045
6500.219948427298393-0.219948427298393
6600.0478032583099287-0.0478032583099287
6700.27109501934184-0.27109501934184
6800.0364658019421961-0.0364658019421961
6900.249647484504908-0.249647484504908
7000.023136897080999-0.023136897080999
7100.0787750492944729-0.0787750492944729
7200.0765007793222567-0.0765007793222567
7300.174988840620275-0.174988840620275
7400.0986197487382554-0.0986197487382554
7500.173360533240052-0.173360533240052
7610.1917231370623080.808276862937692
7700.0920037681037263-0.0920037681037263
7800.343569472471536-0.343569472471536
7900.395446312013599-0.395446312013599
8000.395446312013599-0.395446312013599


Type I & II errors for various threshold values
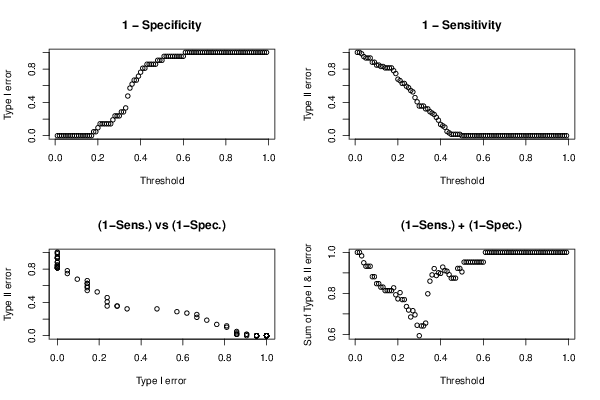
ThresholdType IType II
0.0101
0.0201
0.0300.983050847457627
0.0400.949152542372881
0.0500.932203389830508
0.0600.932203389830508
0.0700.932203389830508
0.0800.88135593220339
0.0900.88135593220339
0.100.847457627118644
0.1100.847457627118644
0.1200.830508474576271
0.1300.830508474576271
0.1400.813559322033898
0.1500.813559322033898
0.1600.813559322033898
0.1700.813559322033898
0.180.04761904761904760.779661016949153
0.190.04761904761904760.745762711864407
0.20.09523809523809520.677966101694915
0.210.1428571428571430.661016949152542
0.220.1428571428571430.627118644067797
0.230.1428571428571430.627118644067797
0.240.1428571428571430.593220338983051
0.250.1428571428571430.576271186440678
0.260.1428571428571430.542372881355932
0.270.190476190476190.525423728813559
0.280.2380952380952380.457627118644068
0.290.2380952380952380.406779661016949
0.30.2380952380952380.355932203389831
0.310.2857142857142860.355932203389831
0.320.2857142857142860.355932203389831
0.330.3333333333333330.322033898305085
0.340.4761904761904760.322033898305085
0.350.5714285714285710.288135593220339
0.360.6190476190476190.271186440677966
0.370.6666666666666670.254237288135593
0.380.6666666666666670.220338983050847
0.390.7142857142857140.186440677966102
0.40.7619047619047620.135593220338983
0.410.809523809523810.11864406779661
0.420.809523809523810.101694915254237
0.430.8571428571428570.0508474576271186
0.440.8571428571428570.0338983050847458
0.450.8571428571428570.0169491525423729
0.460.8571428571428570.0169491525423729
0.470.8571428571428570.0169491525423729
0.480.9047619047619050.0169491525423729
0.490.9047619047619050.0169491525423729
0.50.9047619047619050
0.510.9523809523809520
0.520.9523809523809520
0.530.9523809523809520
0.540.9523809523809520
0.550.9523809523809520
0.560.9523809523809520
0.570.9523809523809520
0.580.9523809523809520
0.590.9523809523809520
0.60.9523809523809520
0.6110
0.6210
0.6310
0.6410
0.6510
0.6610
0.6710
0.6810
0.6910
0.710
0.7110
0.7210
0.7310
0.7410
0.7510
0.7610
0.7710
0.7810
0.7910
0.810
0.8110
0.8210
0.8310
0.8410
0.8510
0.8610
0.8710
0.8810
0.8910
0.910
0.9110
0.9210
0.9310
0.9410
0.9510
0.9610
0.9710
0.9810
0.9910

\begin{tabular}{lllllllll}
\hline
Type I & II errors for various threshold values \tabularnewline
Threshold & Type I & Type II \tabularnewline
0.01 & 0 & 1 \tabularnewline
0.02 & 0 & 1 \tabularnewline
0.03 & 0 & 0.983050847457627 \tabularnewline
0.04 & 0 & 0.949152542372881 \tabularnewline
0.05 & 0 & 0.932203389830508 \tabularnewline
0.06 & 0 & 0.932203389830508 \tabularnewline
0.07 & 0 & 0.932203389830508 \tabularnewline
0.08 & 0 & 0.88135593220339 \tabularnewline
0.09 & 0 & 0.88135593220339 \tabularnewline
0.1 & 0 & 0.847457627118644 \tabularnewline
0.11 & 0 & 0.847457627118644 \tabularnewline
0.12 & 0 & 0.830508474576271 \tabularnewline
0.13 & 0 & 0.830508474576271 \tabularnewline
0.14 & 0 & 0.813559322033898 \tabularnewline
0.15 & 0 & 0.813559322033898 \tabularnewline
0.16 & 0 & 0.813559322033898 \tabularnewline
0.17 & 0 & 0.813559322033898 \tabularnewline
0.18 & 0.0476190476190476 & 0.779661016949153 \tabularnewline
0.19 & 0.0476190476190476 & 0.745762711864407 \tabularnewline
0.2 & 0.0952380952380952 & 0.677966101694915 \tabularnewline
0.21 & 0.142857142857143 & 0.661016949152542 \tabularnewline
0.22 & 0.142857142857143 & 0.627118644067797 \tabularnewline
0.23 & 0.142857142857143 & 0.627118644067797 \tabularnewline
0.24 & 0.142857142857143 & 0.593220338983051 \tabularnewline
0.25 & 0.142857142857143 & 0.576271186440678 \tabularnewline
0.26 & 0.142857142857143 & 0.542372881355932 \tabularnewline
0.27 & 0.19047619047619 & 0.525423728813559 \tabularnewline
0.28 & 0.238095238095238 & 0.457627118644068 \tabularnewline
0.29 & 0.238095238095238 & 0.406779661016949 \tabularnewline
0.3 & 0.238095238095238 & 0.355932203389831 \tabularnewline
0.31 & 0.285714285714286 & 0.355932203389831 \tabularnewline
0.32 & 0.285714285714286 & 0.355932203389831 \tabularnewline
0.33 & 0.333333333333333 & 0.322033898305085 \tabularnewline
0.34 & 0.476190476190476 & 0.322033898305085 \tabularnewline
0.35 & 0.571428571428571 & 0.288135593220339 \tabularnewline
0.36 & 0.619047619047619 & 0.271186440677966 \tabularnewline
0.37 & 0.666666666666667 & 0.254237288135593 \tabularnewline
0.38 & 0.666666666666667 & 0.220338983050847 \tabularnewline
0.39 & 0.714285714285714 & 0.186440677966102 \tabularnewline
0.4 & 0.761904761904762 & 0.135593220338983 \tabularnewline
0.41 & 0.80952380952381 & 0.11864406779661 \tabularnewline
0.42 & 0.80952380952381 & 0.101694915254237 \tabularnewline
0.43 & 0.857142857142857 & 0.0508474576271186 \tabularnewline
0.44 & 0.857142857142857 & 0.0338983050847458 \tabularnewline
0.45 & 0.857142857142857 & 0.0169491525423729 \tabularnewline
0.46 & 0.857142857142857 & 0.0169491525423729 \tabularnewline
0.47 & 0.857142857142857 & 0.0169491525423729 \tabularnewline
0.48 & 0.904761904761905 & 0.0169491525423729 \tabularnewline
0.49 & 0.904761904761905 & 0.0169491525423729 \tabularnewline
0.5 & 0.904761904761905 & 0 \tabularnewline
0.51 & 0.952380952380952 & 0 \tabularnewline
0.52 & 0.952380952380952 & 0 \tabularnewline
0.53 & 0.952380952380952 & 0 \tabularnewline
0.54 & 0.952380952380952 & 0 \tabularnewline
0.55 & 0.952380952380952 & 0 \tabularnewline
0.56 & 0.952380952380952 & 0 \tabularnewline
0.57 & 0.952380952380952 & 0 \tabularnewline
0.58 & 0.952380952380952 & 0 \tabularnewline
0.59 & 0.952380952380952 & 0 \tabularnewline
0.6 & 0.952380952380952 & 0 \tabularnewline
0.61 & 1 & 0 \tabularnewline
0.62 & 1 & 0 \tabularnewline
0.63 & 1 & 0 \tabularnewline
0.64 & 1 & 0 \tabularnewline
0.65 & 1 & 0 \tabularnewline
0.66 & 1 & 0 \tabularnewline
0.67 & 1 & 0 \tabularnewline
0.68 & 1 & 0 \tabularnewline
0.69 & 1 & 0 \tabularnewline
0.7 & 1 & 0 \tabularnewline
0.71 & 1 & 0 \tabularnewline
0.72 & 1 & 0 \tabularnewline
0.73 & 1 & 0 \tabularnewline
0.74 & 1 & 0 \tabularnewline
0.75 & 1 & 0 \tabularnewline
0.76 & 1 & 0 \tabularnewline
0.77 & 1 & 0 \tabularnewline
0.78 & 1 & 0 \tabularnewline
0.79 & 1 & 0 \tabularnewline
0.8 & 1 & 0 \tabularnewline
0.81 & 1 & 0 \tabularnewline
0.82 & 1 & 0 \tabularnewline
0.83 & 1 & 0 \tabularnewline
0.84 & 1 & 0 \tabularnewline
0.85 & 1 & 0 \tabularnewline
0.86 & 1 & 0 \tabularnewline
0.87 & 1 & 0 \tabularnewline
0.88 & 1 & 0 \tabularnewline
0.89 & 1 & 0 \tabularnewline
0.9 & 1 & 0 \tabularnewline
0.91 & 1 & 0 \tabularnewline
0.92 & 1 & 0 \tabularnewline
0.93 & 1 & 0 \tabularnewline
0.94 & 1 & 0 \tabularnewline
0.95 & 1 & 0 \tabularnewline
0.96 & 1 & 0 \tabularnewline
0.97 & 1 & 0 \tabularnewline
0.98 & 1 & 0 \tabularnewline
0.99 & 1 & 0 \tabularnewline
\hline
\end{tabular}
%Source: https://freestatistics.org/blog/index.php?pk=211385&T=4

[TABLE]
[ROW][C]Type I & II errors for various threshold values[/C][/ROW]
[ROW][C]Threshold[/C][C]Type I[/C][C]Type II[/C][/ROW]
[ROW][C]0.01[/C][C]0[/C][C]1[/C][/ROW]
[ROW][C]0.02[/C][C]0[/C][C]1[/C][/ROW]
[ROW][C]0.03[/C][C]0[/C][C]0.983050847457627[/C][/ROW]
[ROW][C]0.04[/C][C]0[/C][C]0.949152542372881[/C][/ROW]
[ROW][C]0.05[/C][C]0[/C][C]0.932203389830508[/C][/ROW]
[ROW][C]0.06[/C][C]0[/C][C]0.932203389830508[/C][/ROW]
[ROW][C]0.07[/C][C]0[/C][C]0.932203389830508[/C][/ROW]
[ROW][C]0.08[/C][C]0[/C][C]0.88135593220339[/C][/ROW]
[ROW][C]0.09[/C][C]0[/C][C]0.88135593220339[/C][/ROW]
[ROW][C]0.1[/C][C]0[/C][C]0.847457627118644[/C][/ROW]
[ROW][C]0.11[/C][C]0[/C][C]0.847457627118644[/C][/ROW]
[ROW][C]0.12[/C][C]0[/C][C]0.830508474576271[/C][/ROW]
[ROW][C]0.13[/C][C]0[/C][C]0.830508474576271[/C][/ROW]
[ROW][C]0.14[/C][C]0[/C][C]0.813559322033898[/C][/ROW]
[ROW][C]0.15[/C][C]0[/C][C]0.813559322033898[/C][/ROW]
[ROW][C]0.16[/C][C]0[/C][C]0.813559322033898[/C][/ROW]
[ROW][C]0.17[/C][C]0[/C][C]0.813559322033898[/C][/ROW]
[ROW][C]0.18[/C][C]0.0476190476190476[/C][C]0.779661016949153[/C][/ROW]
[ROW][C]0.19[/C][C]0.0476190476190476[/C][C]0.745762711864407[/C][/ROW]
[ROW][C]0.2[/C][C]0.0952380952380952[/C][C]0.677966101694915[/C][/ROW]
[ROW][C]0.21[/C][C]0.142857142857143[/C][C]0.661016949152542[/C][/ROW]
[ROW][C]0.22[/C][C]0.142857142857143[/C][C]0.627118644067797[/C][/ROW]
[ROW][C]0.23[/C][C]0.142857142857143[/C][C]0.627118644067797[/C][/ROW]
[ROW][C]0.24[/C][C]0.142857142857143[/C][C]0.593220338983051[/C][/ROW]
[ROW][C]0.25[/C][C]0.142857142857143[/C][C]0.576271186440678[/C][/ROW]
[ROW][C]0.26[/C][C]0.142857142857143[/C][C]0.542372881355932[/C][/ROW]
[ROW][C]0.27[/C][C]0.19047619047619[/C][C]0.525423728813559[/C][/ROW]
[ROW][C]0.28[/C][C]0.238095238095238[/C][C]0.457627118644068[/C][/ROW]
[ROW][C]0.29[/C][C]0.238095238095238[/C][C]0.406779661016949[/C][/ROW]
[ROW][C]0.3[/C][C]0.238095238095238[/C][C]0.355932203389831[/C][/ROW]
[ROW][C]0.31[/C][C]0.285714285714286[/C][C]0.355932203389831[/C][/ROW]
[ROW][C]0.32[/C][C]0.285714285714286[/C][C]0.355932203389831[/C][/ROW]
[ROW][C]0.33[/C][C]0.333333333333333[/C][C]0.322033898305085[/C][/ROW]
[ROW][C]0.34[/C][C]0.476190476190476[/C][C]0.322033898305085[/C][/ROW]
[ROW][C]0.35[/C][C]0.571428571428571[/C][C]0.288135593220339[/C][/ROW]
[ROW][C]0.36[/C][C]0.619047619047619[/C][C]0.271186440677966[/C][/ROW]
[ROW][C]0.37[/C][C]0.666666666666667[/C][C]0.254237288135593[/C][/ROW]
[ROW][C]0.38[/C][C]0.666666666666667[/C][C]0.220338983050847[/C][/ROW]
[ROW][C]0.39[/C][C]0.714285714285714[/C][C]0.186440677966102[/C][/ROW]
[ROW][C]0.4[/C][C]0.761904761904762[/C][C]0.135593220338983[/C][/ROW]
[ROW][C]0.41[/C][C]0.80952380952381[/C][C]0.11864406779661[/C][/ROW]
[ROW][C]0.42[/C][C]0.80952380952381[/C][C]0.101694915254237[/C][/ROW]
[ROW][C]0.43[/C][C]0.857142857142857[/C][C]0.0508474576271186[/C][/ROW]
[ROW][C]0.44[/C][C]0.857142857142857[/C][C]0.0338983050847458[/C][/ROW]
[ROW][C]0.45[/C][C]0.857142857142857[/C][C]0.0169491525423729[/C][/ROW]
[ROW][C]0.46[/C][C]0.857142857142857[/C][C]0.0169491525423729[/C][/ROW]
[ROW][C]0.47[/C][C]0.857142857142857[/C][C]0.0169491525423729[/C][/ROW]
[ROW][C]0.48[/C][C]0.904761904761905[/C][C]0.0169491525423729[/C][/ROW]
[ROW][C]0.49[/C][C]0.904761904761905[/C][C]0.0169491525423729[/C][/ROW]
[ROW][C]0.5[/C][C]0.904761904761905[/C][C]0[/C][/ROW]
[ROW][C]0.51[/C][C]0.952380952380952[/C][C]0[/C][/ROW]
[ROW][C]0.52[/C][C]0.952380952380952[/C][C]0[/C][/ROW]
[ROW][C]0.53[/C][C]0.952380952380952[/C][C]0[/C][/ROW]
[ROW][C]0.54[/C][C]0.952380952380952[/C][C]0[/C][/ROW]
[ROW][C]0.55[/C][C]0.952380952380952[/C][C]0[/C][/ROW]
[ROW][C]0.56[/C][C]0.952380952380952[/C][C]0[/C][/ROW]
[ROW][C]0.57[/C][C]0.952380952380952[/C][C]0[/C][/ROW]
[ROW][C]0.58[/C][C]0.952380952380952[/C][C]0[/C][/ROW]
[ROW][C]0.59[/C][C]0.952380952380952[/C][C]0[/C][/ROW]
[ROW][C]0.6[/C][C]0.952380952380952[/C][C]0[/C][/ROW]
[ROW][C]0.61[/C][C]1[/C][C]0[/C][/ROW]
[ROW][C]0.62[/C][C]1[/C][C]0[/C][/ROW]
[ROW][C]0.63[/C][C]1[/C][C]0[/C][/ROW]
[ROW][C]0.64[/C][C]1[/C][C]0[/C][/ROW]
[ROW][C]0.65[/C][C]1[/C][C]0[/C][/ROW]
[ROW][C]0.66[/C][C]1[/C][C]0[/C][/ROW]
[ROW][C]0.67[/C][C]1[/C][C]0[/C][/ROW]
[ROW][C]0.68[/C][C]1[/C][C]0[/C][/ROW]
[ROW][C]0.69[/C][C]1[/C][C]0[/C][/ROW]
[ROW][C]0.7[/C][C]1[/C][C]0[/C][/ROW]
[ROW][C]0.71[/C][C]1[/C][C]0[/C][/ROW]
[ROW][C]0.72[/C][C]1[/C][C]0[/C][/ROW]
[ROW][C]0.73[/C][C]1[/C][C]0[/C][/ROW]
[ROW][C]0.74[/C][C]1[/C][C]0[/C][/ROW]
[ROW][C]0.75[/C][C]1[/C][C]0[/C][/ROW]
[ROW][C]0.76[/C][C]1[/C][C]0[/C][/ROW]
[ROW][C]0.77[/C][C]1[/C][C]0[/C][/ROW]
[ROW][C]0.78[/C][C]1[/C][C]0[/C][/ROW]
[ROW][C]0.79[/C][C]1[/C][C]0[/C][/ROW]
[ROW][C]0.8[/C][C]1[/C][C]0[/C][/ROW]
[ROW][C]0.81[/C][C]1[/C][C]0[/C][/ROW]
[ROW][C]0.82[/C][C]1[/C][C]0[/C][/ROW]
[ROW][C]0.83[/C][C]1[/C][C]0[/C][/ROW]
[ROW][C]0.84[/C][C]1[/C][C]0[/C][/ROW]
[ROW][C]0.85[/C][C]1[/C][C]0[/C][/ROW]
[ROW][C]0.86[/C][C]1[/C][C]0[/C][/ROW]
[ROW][C]0.87[/C][C]1[/C][C]0[/C][/ROW]
[ROW][C]0.88[/C][C]1[/C][C]0[/C][/ROW]
[ROW][C]0.89[/C][C]1[/C][C]0[/C][/ROW]
[ROW][C]0.9[/C][C]1[/C][C]0[/C][/ROW]
[ROW][C]0.91[/C][C]1[/C][C]0[/C][/ROW]
[ROW][C]0.92[/C][C]1[/C][C]0[/C][/ROW]
[ROW][C]0.93[/C][C]1[/C][C]0[/C][/ROW]
[ROW][C]0.94[/C][C]1[/C][C]0[/C][/ROW]
[ROW][C]0.95[/C][C]1[/C][C]0[/C][/ROW]
[ROW][C]0.96[/C][C]1[/C][C]0[/C][/ROW]
[ROW][C]0.97[/C][C]1[/C][C]0[/C][/ROW]
[ROW][C]0.98[/C][C]1[/C][C]0[/C][/ROW]
[ROW][C]0.99[/C][C]1[/C][C]0[/C][/ROW]
[/TABLE]
Source: https://freestatistics.org/blog/index.php?pk=211385&T=4

Globally Unique Identifier (entire table): ba.freestatistics.org/blog/index.php?pk=211385&T=4

As an alternative you can also use a QR Code:  

The GUIDs for individual cells are displayed in the table below:

Type I & II errors for various threshold values
ThresholdType IType II
0.0101
0.0201
0.0300.983050847457627
0.0400.949152542372881
0.0500.932203389830508
0.0600.932203389830508
0.0700.932203389830508
0.0800.88135593220339
0.0900.88135593220339
0.100.847457627118644
0.1100.847457627118644
0.1200.830508474576271
0.1300.830508474576271
0.1400.813559322033898
0.1500.813559322033898
0.1600.813559322033898
0.1700.813559322033898
0.180.04761904761904760.779661016949153
0.190.04761904761904760.745762711864407
0.20.09523809523809520.677966101694915
0.210.1428571428571430.661016949152542
0.220.1428571428571430.627118644067797
0.230.1428571428571430.627118644067797
0.240.1428571428571430.593220338983051
0.250.1428571428571430.576271186440678
0.260.1428571428571430.542372881355932
0.270.190476190476190.525423728813559
0.280.2380952380952380.457627118644068
0.290.2380952380952380.406779661016949
0.30.2380952380952380.355932203389831
0.310.2857142857142860.355932203389831
0.320.2857142857142860.355932203389831
0.330.3333333333333330.322033898305085
0.340.4761904761904760.322033898305085
0.350.5714285714285710.288135593220339
0.360.6190476190476190.271186440677966
0.370.6666666666666670.254237288135593
0.380.6666666666666670.220338983050847
0.390.7142857142857140.186440677966102
0.40.7619047619047620.135593220338983
0.410.809523809523810.11864406779661
0.420.809523809523810.101694915254237
0.430.8571428571428570.0508474576271186
0.440.8571428571428570.0338983050847458
0.450.8571428571428570.0169491525423729
0.460.8571428571428570.0169491525423729
0.470.8571428571428570.0169491525423729
0.480.9047619047619050.0169491525423729
0.490.9047619047619050.0169491525423729
0.50.9047619047619050
0.510.9523809523809520
0.520.9523809523809520
0.530.9523809523809520
0.540.9523809523809520
0.550.9523809523809520
0.560.9523809523809520
0.570.9523809523809520
0.580.9523809523809520
0.590.9523809523809520
0.60.9523809523809520
0.6110
0.6210
0.6310
0.6410
0.6510
0.6610
0.6710
0.6810
0.6910
0.710
0.7110
0.7210
0.7310
0.7410
0.7510
0.7610
0.7710
0.7810
0.7910
0.810
0.8110
0.8210
0.8310
0.8410
0.8510
0.8610
0.8710
0.8810
0.8910
0.910
0.9110
0.9210
0.9310
0.9410
0.9510
0.9610
0.9710
0.9810
0.9910


Parameters (Session):
Parameters (R input):
R code (references can be found in the software module):
library(brglm)
roc.plot <- function (sd, sdc, newplot = TRUE, ...)
{
sall <- sort(c(sd, sdc))
sens <- 0
specc <- 0
for (i in length(sall):1) {
sens <- c(sens, mean(sd >= sall[i], na.rm = T))
specc <- c(specc, mean(sdc >= sall[i], na.rm = T))
}
if (newplot) {
plot(specc, sens, xlim = c(0, 1), ylim = c(0, 1), type = 'l',
xlab = '1-specificity', ylab = 'sensitivity', main = 'ROC plot', ...)
abline(0, 1)
}
else lines(specc, sens, ...)
npoints <- length(sens)
area <- sum(0.5 * (sens[-1] + sens[-npoints]) * (specc[-1] -
specc[-npoints]))
lift <- (sens - specc)[-1]
cutoff <- sall[lift == max(lift)][1]
sensopt <- sens[-1][lift == max(lift)][1]
specopt <- 1 - specc[-1][lift == max(lift)][1]
list(area = area, cutoff = cutoff, sensopt = sensopt, specopt = specopt)
}
roc.analysis <- function (object, newdata = NULL, newplot = TRUE, ...)
{
if (is.null(newdata)) {
sd <- object$fitted[object$y == 1]
sdc <- object$fitted[object$y == 0]
}
else {
sd <- predict(object, newdata, type = 'response')[newdata$y ==
1]
sdc <- predict(object, newdata, type = 'response')[newdata$y ==
0]
}
roc.plot(sd, sdc, newplot, ...)
}
hosmerlem <- function (y, yhat, g = 10)
{
cutyhat <- cut(yhat, breaks = quantile(yhat, probs = seq(0,
1, 1/g)), include.lowest = T)
obs <- xtabs(cbind(1 - y, y) ~ cutyhat)
expect <- xtabs(cbind(1 - yhat, yhat) ~ cutyhat)
chisq <- sum((obs - expect)^2/expect)
P <- 1 - pchisq(chisq, g - 2)
c('X^2' = chisq, Df = g - 2, 'P(>Chi)' = P)
}
x <- as.data.frame(t(y))
r <- brglm(x)
summary(r)
rc <- summary(r)$coeff
try(hm <- hosmerlem(y[1,],r$fitted.values),silent=T)
try(hm,silent=T)
bitmap(file='test0.png')
ra <- roc.analysis(r)
dev.off()
te <- array(0,dim=c(2,99))
for (i in 1:99) {
threshold <- i / 100
numcorr1 <- 0
numfaul1 <- 0
numcorr0 <- 0
numfaul0 <- 0
for (j in 1:length(r$fitted.values)) {
if (y[1,j] > 0.99) {
if (r$fitted.values[j] >= threshold) numcorr1 = numcorr1 + 1 else numfaul1 = numfaul1 + 1
} else {
if (r$fitted.values[j] < threshold) numcorr0 = numcorr0 + 1 else numfaul0 = numfaul0 + 1
}
}
te[1,i] <- numfaul1 / (numfaul1 + numcorr1)
te[2,i] <- numfaul0 / (numfaul0 + numcorr0)
}
bitmap(file='test1.png')
op <- par(mfrow=c(2,2))
plot((1:99)/100,te[1,],xlab='Threshold',ylab='Type I error', main='1 - Specificity')
plot((1:99)/100,te[2,],xlab='Threshold',ylab='Type II error', main='1 - Sensitivity')
plot(te[1,],te[2,],xlab='Type I error',ylab='Type II error', main='(1-Sens.) vs (1-Spec.)')
plot((1:99)/100,te[1,]+te[2,],xlab='Threshold',ylab='Sum of Type I & II error', main='(1-Sens.) + (1-Spec.)')
par(op)
dev.off()
load(file='createtable')
a<-table.start()
a<-table.row.start(a)
a<-table.element(a,'Coefficients of Bias-Reduced Logistic Regression',5,TRUE)
a<-table.row.end(a)
a<-table.row.start(a)
a<-table.element(a,'Variable',header=TRUE)
a<-table.element(a,'Parameter',header=TRUE)
a<-table.element(a,'S.E.',header=TRUE)
a<-table.element(a,'t-stat',header=TRUE)
a<-table.element(a,'2-sided p-value',header=TRUE)
a<-table.row.end(a)
for (i in 1:length(rc[,1])) {
a<-table.row.start(a)
a<-table.element(a,labels(rc)[[1]][i],header=TRUE)
a<-table.element(a,rc[i,1])
a<-table.element(a,rc[i,2])
a<-table.element(a,rc[i,3])
a<-table.element(a,2*(1-pt(abs(rc[i,3]),r$df.residual)))
a<-table.row.end(a)
}
a<-table.end(a)
table.save(a,file='mytable.tab')
a<-table.start()
a<-table.row.start(a)
a<-table.element(a,'Summary of Bias-Reduced Logistic Regression',2,TRUE)
a<-table.row.end(a)
a<-table.row.start(a)
a<-table.element(a,'Deviance',1,TRUE)
a<-table.element(a,r$deviance)
a<-table.row.end(a)
a<-table.row.start(a)
a<-table.element(a,'Penalized deviance',1,TRUE)
a<-table.element(a,r$penalized.deviance)
a<-table.row.end(a)
a<-table.row.start(a)
a<-table.element(a,'Residual Degrees of Freedom',1,TRUE)
a<-table.element(a,r$df.residual)
a<-table.row.end(a)
a<-table.row.start(a)
a<-table.element(a,'ROC Area',1,TRUE)
a<-table.element(a,ra$area)
a<-table.row.end(a)
a<-table.row.start(a)
a<-table.element(a,'Hosmer–Lemeshow test',2,TRUE)
a<-table.row.end(a)
a<-table.row.start(a)
a<-table.element(a,'Chi-square',1,TRUE)
phm <- array('NA',dim=3)
for (i in 1:3) { try(phm[i] <- hm[i],silent=T) }
a<-table.element(a,phm[1])
a<-table.row.end(a)
a<-table.row.start(a)
a<-table.element(a,'Degrees of Freedom',1,TRUE)
a<-table.element(a,phm[2])
a<-table.row.end(a)
a<-table.row.start(a)
a<-table.element(a,'P(>Chi)',1,TRUE)
a<-table.element(a,phm[3])
a<-table.row.end(a)
a<-table.end(a)
table.save(a,file='mytable1.tab')
a<-table.start()
a<-table.row.start(a)
a<-table.element(a,'Fit of Logistic Regression',4,TRUE)
a<-table.row.end(a)
a<-table.row.start(a)
a<-table.element(a,'Index',1,TRUE)
a<-table.element(a,'Actual',1,TRUE)
a<-table.element(a,'Fitted',1,TRUE)
a<-table.element(a,'Error',1,TRUE)
a<-table.row.end(a)
for (i in 1:length(r$fitted.values)) {
a<-table.row.start(a)
a<-table.element(a,i,1,TRUE)
a<-table.element(a,y[1,i])
a<-table.element(a,r$fitted.values[i])
a<-table.element(a,y[1,i]-r$fitted.values[i])
a<-table.row.end(a)
}
a<-table.end(a)
table.save(a,file='mytable2.tab')
a<-table.start()
a<-table.row.start(a)
a<-table.element(a,'Type I & II errors for various threshold values',3,TRUE)
a<-table.row.end(a)
a<-table.row.start(a)
a<-table.element(a,'Threshold',1,TRUE)
a<-table.element(a,'Type I',1,TRUE)
a<-table.element(a,'Type II',1,TRUE)
a<-table.row.end(a)
for (i in 1:99) {
a<-table.row.start(a)
a<-table.element(a,i/100,1,TRUE)
a<-table.element(a,te[1,i])
a<-table.element(a,te[2,i])
a<-table.row.end(a)
}
a<-table.end(a)
table.save(a,file='mytable3.tab')