Free Statistics

of Irreproducible Research!

Author's title

Author*Unverified author*
R Software Modulerwasp_density.wasp
Title produced by softwareKernel Density Estimation
Date of computationSat, 28 Sep 2013 02:56:29 -0400
Cite this page as followsStatistical Computations at FreeStatistics.org, Office for Research Development and Education, URL https://freestatistics.org/blog/index.php?v=date/2013/Sep/28/t13803515116emyrapfn2c68z9.htm/, Retrieved Mon, 29 Apr 2024 10:04:59 +0000
Statistical Computations at FreeStatistics.org, Office for Research Development and Education, URL https://freestatistics.org/blog/index.php?pk=212285, Retrieved Mon, 29 Apr 2024 10:04:59 +0000
QR Codes:

Original text written by user:
IsPrivate?No (this computation is public)
User-defined keywords
Estimated Impact127
Family? (F = Feedback message, R = changed R code, M = changed R Module, P = changed Parameters, D = changed Data)
-       [Kernel Density Estimation] [] [2013-09-28 06:56:29] [a1de13929df8f72ca0bba4a56316571d] [Current]
Feedback Forum

Post a new message
Dataseries X:
3875
3863
3876
3878
3881
3883
3884
3885
3895
3903
3911
3929
3946
3965
3992
4010
4015
4020
4037
4059
4083
4102
4126
4145
4162
4169
4178
4174
4168
4170
4159
4159
4143
4159
4167
4176
4185
4195
4210
4226
4250
4259
4270
4277
4286
4303
4320
4336
4352
4371
4392
4415
4442
4457
4472
4474
4461
4453
4446
4450
4459
4474
4492
4509
4526
4541
4550
4562
4555
4554
4551
4553


Summary of computational transaction
Raw Inputview raw input (R code)
Raw Outputview raw output of R engine
Computing time4 seconds
R Server'George Udny Yule' @ yule.wessa.net

\begin{tabular}{lllllllll}
\hline
Summary of computational transaction \tabularnewline
Raw Input & view raw input (R code)  \tabularnewline
Raw Output & view raw output of R engine  \tabularnewline
Computing time & 4 seconds \tabularnewline
R Server & 'George Udny Yule' @ yule.wessa.net \tabularnewline
\hline
\end{tabular}
%Source: https://freestatistics.org/blog/index.php?pk=212285&T=0

[TABLE]
[ROW][C]Summary of computational transaction[/C][/ROW]
[ROW][C]Raw Input[/C][C]view raw input (R code) [/C][/ROW]
[ROW][C]Raw Output[/C][C]view raw output of R engine [/C][/ROW]
[ROW][C]Computing time[/C][C]4 seconds[/C][/ROW]
[ROW][C]R Server[/C][C]'George Udny Yule' @ yule.wessa.net[/C][/ROW]
[/TABLE]
Source: https://freestatistics.org/blog/index.php?pk=212285&T=0

Globally Unique Identifier (entire table): ba.freestatistics.org/blog/index.php?pk=212285&T=0

As an alternative you can also use a QR Code:  

The GUIDs for individual cells are displayed in the table below:

Summary of computational transaction
Raw Inputview raw input (R code)
Raw Outputview raw output of R engine
Computing time4 seconds
R Server'George Udny Yule' @ yule.wessa.net


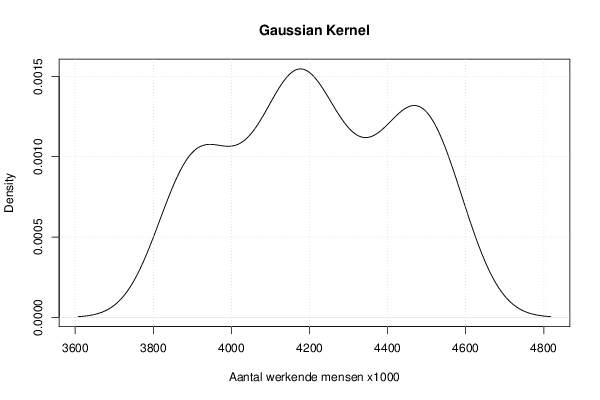
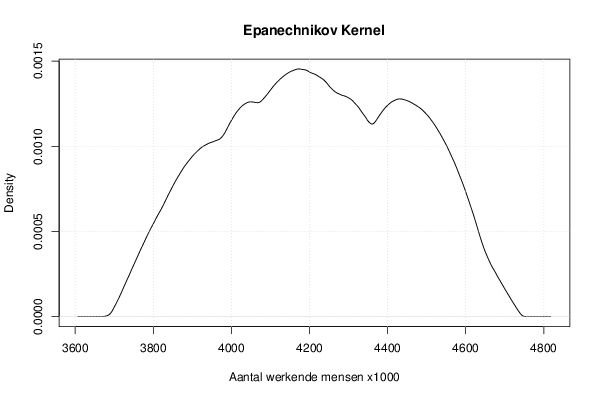
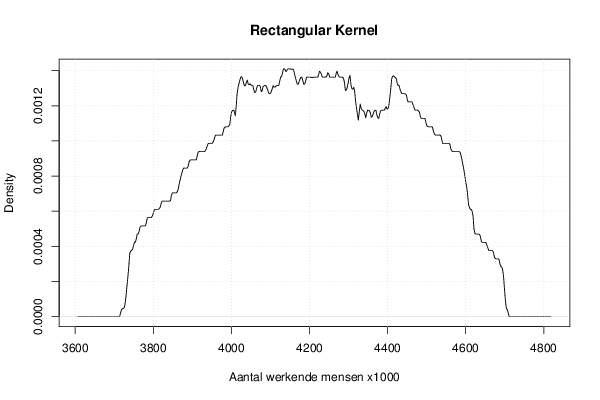
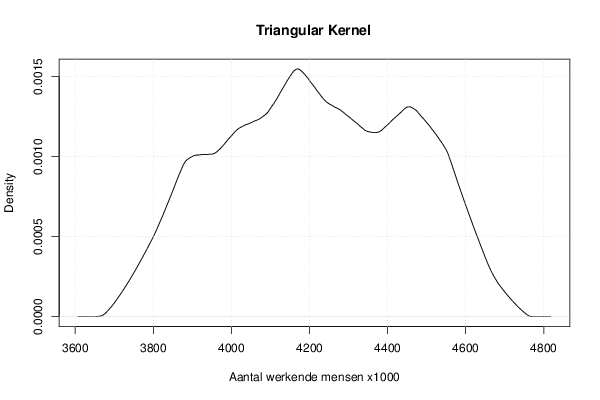
Properties of Density Trace
Bandwidth85.3371033641924
#Observations72

\begin{tabular}{lllllllll}
\hline
Properties of Density Trace \tabularnewline
Bandwidth & 85.3371033641924 \tabularnewline
#Observations & 72 \tabularnewline
\hline
\end{tabular}
%Source: https://freestatistics.org/blog/index.php?pk=212285&T=1

[TABLE]
[ROW][C]Properties of Density Trace[/C][/ROW]
[ROW][C]Bandwidth[/C][C]85.3371033641924[/C][/ROW]
[ROW][C]#Observations[/C][C]72[/C][/ROW]
[/TABLE]
Source: https://freestatistics.org/blog/index.php?pk=212285&T=1

Globally Unique Identifier (entire table): ba.freestatistics.org/blog/index.php?pk=212285&T=1

As an alternative you can also use a QR Code:  

The GUIDs for individual cells are displayed in the table below:

Properties of Density Trace
Bandwidth85.3371033641924
#Observations72


Maximum Density Values
Kernelx-valuemax. density
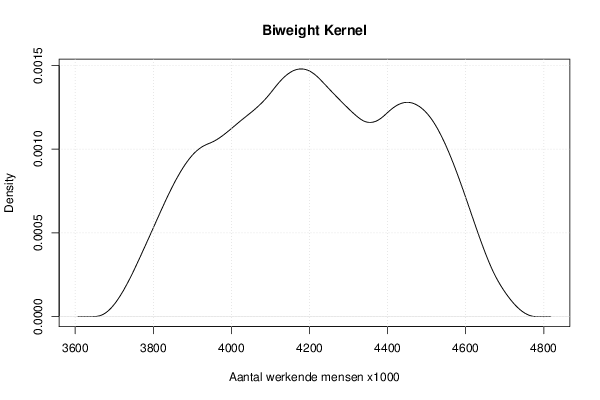
Gaussian4178.136344437020.00154668877626491
Epanechnikov4173.39652987660.0014536436395949
Rectangular4133.108106113110.0014094842845538
Triangular4168.656715316190.00154695448809478
Biweight4178.136344437020.00147842085746822
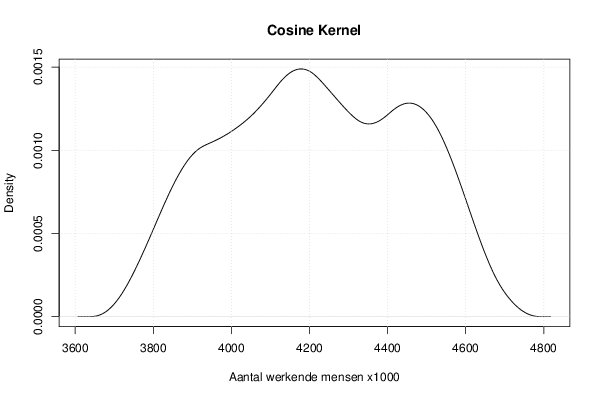
Cosine4178.136344437020.00148858230413036
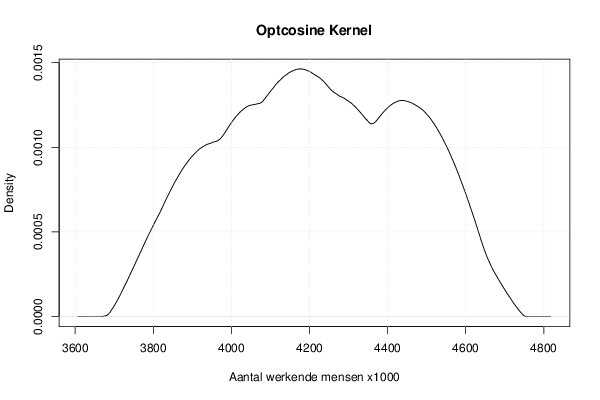
Optcosine4178.136344437020.00146226348811839

\begin{tabular}{lllllllll}
\hline
Maximum Density Values \tabularnewline
Kernel & x-value & max. density \tabularnewline
Gaussian & 4178.13634443702 & 0.00154668877626491 \tabularnewline
Epanechnikov & 4173.3965298766 & 0.0014536436395949 \tabularnewline
Rectangular & 4133.10810611311 & 0.0014094842845538 \tabularnewline
Triangular & 4168.65671531619 & 0.00154695448809478 \tabularnewline
Biweight & 4178.13634443702 & 0.00147842085746822 \tabularnewline
Cosine & 4178.13634443702 & 0.00148858230413036 \tabularnewline
Optcosine & 4178.13634443702 & 0.00146226348811839 \tabularnewline
 \hline
\end{tabular}
%Source: https://freestatistics.org/blog/index.php?pk=212285&T=2

[TABLE]
[ROW][C]Maximum Density Values[/C][/ROW]
[ROW][C]Kernel[/C][C]x-value[/C][C]max. density[/C][/ROW]
[ROW][C]Gaussian[/C][C]4178.13634443702[/C][C]0.00154668877626491[/C][/ROW]
[ROW][C]Epanechnikov[/C][C]4173.3965298766[/C][C]0.0014536436395949[/C][/ROW]
[ROW][C]Rectangular[/C][C]4133.10810611311[/C][C]0.0014094842845538[/C][/ROW]
[ROW][C]Triangular[/C][C]4168.65671531619[/C][C]0.00154695448809478[/C][/ROW]
[ROW][C]Biweight[/C][C]4178.13634443702[/C][C]0.00147842085746822[/C][/ROW]
[ROW][C]Cosine[/C][C]4178.13634443702[/C][C]0.00148858230413036[/C][/ROW]
[ROW][C]Optcosine[/C][C]4178.13634443702[/C][C]0.00146226348811839[/C][/ROW]
 [/TABLE]
Source: https://freestatistics.org/blog/index.php?pk=212285&T=2

Globally Unique Identifier (entire table): ba.freestatistics.org/blog/index.php?pk=212285&T=2

As an alternative you can also use a QR Code:  

The GUIDs for individual cells are displayed in the table below:

Maximum Density Values
Kernelx-valuemax. density
Gaussian4178.136344437020.00154668877626491
Epanechnikov4173.39652987660.0014536436395949
Rectangular4133.108106113110.0014094842845538
Triangular4168.656715316190.00154695448809478
Biweight4178.136344437020.00147842085746822
Cosine4178.136344437020.00148858230413036
Optcosine4178.136344437020.00146226348811839


Maximum Density Values
Kernelx-valuemax. density
Gaussian4178.136344437020.00154668877626491
Epanechnikov4173.39652987660.0014536436395949
Rectangular4135.478013393310.0014094842845538
Triangular4168.656715316190.00154695448809478
Biweight4178.136344437020.00147842085746822
Cosine4178.136344437020.00148858230413036
Optcosine4178.136344437020.00146226348811839

\begin{tabular}{lllllllll}
\hline
Maximum Density Values \tabularnewline
Kernel & x-value & max. density \tabularnewline
Gaussian & 4178.13634443702 & 0.00154668877626491 \tabularnewline
Epanechnikov & 4173.3965298766 & 0.0014536436395949 \tabularnewline
Rectangular & 4135.47801339331 & 0.0014094842845538 \tabularnewline
Triangular & 4168.65671531619 & 0.00154695448809478 \tabularnewline
Biweight & 4178.13634443702 & 0.00147842085746822 \tabularnewline
Cosine & 4178.13634443702 & 0.00148858230413036 \tabularnewline
Optcosine & 4178.13634443702 & 0.00146226348811839 \tabularnewline
 \hline
\end{tabular}
%Source: https://freestatistics.org/blog/index.php?pk=212285&T=3

[TABLE]
[ROW][C]Maximum Density Values[/C][/ROW]
[ROW][C]Kernel[/C][C]x-value[/C][C]max. density[/C][/ROW]
[ROW][C]Gaussian[/C][C]4178.13634443702[/C][C]0.00154668877626491[/C][/ROW]
[ROW][C]Epanechnikov[/C][C]4173.3965298766[/C][C]0.0014536436395949[/C][/ROW]
[ROW][C]Rectangular[/C][C]4135.47801339331[/C][C]0.0014094842845538[/C][/ROW]
[ROW][C]Triangular[/C][C]4168.65671531619[/C][C]0.00154695448809478[/C][/ROW]
[ROW][C]Biweight[/C][C]4178.13634443702[/C][C]0.00147842085746822[/C][/ROW]
[ROW][C]Cosine[/C][C]4178.13634443702[/C][C]0.00148858230413036[/C][/ROW]
[ROW][C]Optcosine[/C][C]4178.13634443702[/C][C]0.00146226348811839[/C][/ROW]
 [/TABLE]
Source: https://freestatistics.org/blog/index.php?pk=212285&T=3

Globally Unique Identifier (entire table): ba.freestatistics.org/blog/index.php?pk=212285&T=3

As an alternative you can also use a QR Code:  

The GUIDs for individual cells are displayed in the table below:

Maximum Density Values
Kernelx-valuemax. density
Gaussian4178.136344437020.00154668877626491
Epanechnikov4173.39652987660.0014536436395949
Rectangular4135.478013393310.0014094842845538
Triangular4168.656715316190.00154695448809478
Biweight4178.136344437020.00147842085746822
Cosine4178.136344437020.00148858230413036
Optcosine4178.136344437020.00146226348811839


Maximum Density Values
Kernelx-valuemax. density
Gaussian4178.136344437020.00154668877626491
Epanechnikov4173.39652987660.0014536436395949
Rectangular4144.957642514130.0014094842845538
Triangular4168.656715316190.00154695448809478
Biweight4178.136344437020.00147842085746822
Cosine4178.136344437020.00148858230413036
Optcosine4178.136344437020.00146226348811839

\begin{tabular}{lllllllll}
\hline
Maximum Density Values \tabularnewline
Kernel & x-value & max. density \tabularnewline
Gaussian & 4178.13634443702 & 0.00154668877626491 \tabularnewline
Epanechnikov & 4173.3965298766 & 0.0014536436395949 \tabularnewline
Rectangular & 4144.95764251413 & 0.0014094842845538 \tabularnewline
Triangular & 4168.65671531619 & 0.00154695448809478 \tabularnewline
Biweight & 4178.13634443702 & 0.00147842085746822 \tabularnewline
Cosine & 4178.13634443702 & 0.00148858230413036 \tabularnewline
Optcosine & 4178.13634443702 & 0.00146226348811839 \tabularnewline
 \hline
\end{tabular}
%Source: https://freestatistics.org/blog/index.php?pk=212285&T=4

[TABLE]
[ROW][C]Maximum Density Values[/C][/ROW]
[ROW][C]Kernel[/C][C]x-value[/C][C]max. density[/C][/ROW]
[ROW][C]Gaussian[/C][C]4178.13634443702[/C][C]0.00154668877626491[/C][/ROW]
[ROW][C]Epanechnikov[/C][C]4173.3965298766[/C][C]0.0014536436395949[/C][/ROW]
[ROW][C]Rectangular[/C][C]4144.95764251413[/C][C]0.0014094842845538[/C][/ROW]
[ROW][C]Triangular[/C][C]4168.65671531619[/C][C]0.00154695448809478[/C][/ROW]
[ROW][C]Biweight[/C][C]4178.13634443702[/C][C]0.00147842085746822[/C][/ROW]
[ROW][C]Cosine[/C][C]4178.13634443702[/C][C]0.00148858230413036[/C][/ROW]
[ROW][C]Optcosine[/C][C]4178.13634443702[/C][C]0.00146226348811839[/C][/ROW]
 [/TABLE]
Source: https://freestatistics.org/blog/index.php?pk=212285&T=4

Globally Unique Identifier (entire table): ba.freestatistics.org/blog/index.php?pk=212285&T=4

As an alternative you can also use a QR Code:  

The GUIDs for individual cells are displayed in the table below:

Maximum Density Values
Kernelx-valuemax. density
Gaussian4178.136344437020.00154668877626491
Epanechnikov4173.39652987660.0014536436395949
Rectangular4144.957642514130.0014094842845538
Triangular4168.656715316190.00154695448809478
Biweight4178.136344437020.00147842085746822
Cosine4178.136344437020.00148858230413036
Optcosine4178.136344437020.00146226348811839


Maximum Density Values
Kernelx-valuemax. density
Gaussian4178.136344437020.00154668877626491
Epanechnikov4173.39652987660.0014536436395949
Rectangular4147.327549794340.0014094842845538
Triangular4168.656715316190.00154695448809478
Biweight4178.136344437020.00147842085746822
Cosine4178.136344437020.00148858230413036
Optcosine4178.136344437020.00146226348811839

\begin{tabular}{lllllllll}
\hline
Maximum Density Values \tabularnewline
Kernel & x-value & max. density \tabularnewline
Gaussian & 4178.13634443702 & 0.00154668877626491 \tabularnewline
Epanechnikov & 4173.3965298766 & 0.0014536436395949 \tabularnewline
Rectangular & 4147.32754979434 & 0.0014094842845538 \tabularnewline
Triangular & 4168.65671531619 & 0.00154695448809478 \tabularnewline
Biweight & 4178.13634443702 & 0.00147842085746822 \tabularnewline
Cosine & 4178.13634443702 & 0.00148858230413036 \tabularnewline
Optcosine & 4178.13634443702 & 0.00146226348811839 \tabularnewline
 \hline
\end{tabular}
%Source: https://freestatistics.org/blog/index.php?pk=212285&T=5

[TABLE]
[ROW][C]Maximum Density Values[/C][/ROW]
[ROW][C]Kernel[/C][C]x-value[/C][C]max. density[/C][/ROW]
[ROW][C]Gaussian[/C][C]4178.13634443702[/C][C]0.00154668877626491[/C][/ROW]
[ROW][C]Epanechnikov[/C][C]4173.3965298766[/C][C]0.0014536436395949[/C][/ROW]
[ROW][C]Rectangular[/C][C]4147.32754979434[/C][C]0.0014094842845538[/C][/ROW]
[ROW][C]Triangular[/C][C]4168.65671531619[/C][C]0.00154695448809478[/C][/ROW]
[ROW][C]Biweight[/C][C]4178.13634443702[/C][C]0.00147842085746822[/C][/ROW]
[ROW][C]Cosine[/C][C]4178.13634443702[/C][C]0.00148858230413036[/C][/ROW]
[ROW][C]Optcosine[/C][C]4178.13634443702[/C][C]0.00146226348811839[/C][/ROW]
 [/TABLE]
Source: https://freestatistics.org/blog/index.php?pk=212285&T=5

Globally Unique Identifier (entire table): ba.freestatistics.org/blog/index.php?pk=212285&T=5

As an alternative you can also use a QR Code:  

The GUIDs for individual cells are displayed in the table below:

Maximum Density Values
Kernelx-valuemax. density
Gaussian4178.136344437020.00154668877626491
Epanechnikov4173.39652987660.0014536436395949
Rectangular4147.327549794340.0014094842845538
Triangular4168.656715316190.00154695448809478
Biweight4178.136344437020.00147842085746822
Cosine4178.136344437020.00148858230413036
Optcosine4178.136344437020.00146226348811839


Maximum Density Values
Kernelx-valuemax. density
Gaussian4178.136344437020.00154668877626491
Epanechnikov4173.39652987660.0014536436395949
Rectangular4149.697457074550.0014094842845538
Triangular4168.656715316190.00154695448809478
Biweight4178.136344437020.00147842085746822
Cosine4178.136344437020.00148858230413036
Optcosine4178.136344437020.00146226348811839

\begin{tabular}{lllllllll}
\hline
Maximum Density Values \tabularnewline
Kernel & x-value & max. density \tabularnewline
Gaussian & 4178.13634443702 & 0.00154668877626491 \tabularnewline
Epanechnikov & 4173.3965298766 & 0.0014536436395949 \tabularnewline
Rectangular & 4149.69745707455 & 0.0014094842845538 \tabularnewline
Triangular & 4168.65671531619 & 0.00154695448809478 \tabularnewline
Biweight & 4178.13634443702 & 0.00147842085746822 \tabularnewline
Cosine & 4178.13634443702 & 0.00148858230413036 \tabularnewline
Optcosine & 4178.13634443702 & 0.00146226348811839 \tabularnewline
\hline
\end{tabular}
%Source: https://freestatistics.org/blog/index.php?pk=212285&T=6

[TABLE]
[ROW][C]Maximum Density Values[/C][/ROW]
[ROW][C]Kernel[/C][C]x-value[/C][C]max. density[/C][/ROW]
[ROW][C]Gaussian[/C][C]4178.13634443702[/C][C]0.00154668877626491[/C][/ROW]
[ROW][C]Epanechnikov[/C][C]4173.3965298766[/C][C]0.0014536436395949[/C][/ROW]
[ROW][C]Rectangular[/C][C]4149.69745707455[/C][C]0.0014094842845538[/C][/ROW]
[ROW][C]Triangular[/C][C]4168.65671531619[/C][C]0.00154695448809478[/C][/ROW]
[ROW][C]Biweight[/C][C]4178.13634443702[/C][C]0.00147842085746822[/C][/ROW]
[ROW][C]Cosine[/C][C]4178.13634443702[/C][C]0.00148858230413036[/C][/ROW]
[ROW][C]Optcosine[/C][C]4178.13634443702[/C][C]0.00146226348811839[/C][/ROW]
[/TABLE]
Source: https://freestatistics.org/blog/index.php?pk=212285&T=6

Globally Unique Identifier (entire table): ba.freestatistics.org/blog/index.php?pk=212285&T=6

As an alternative you can also use a QR Code:  

The GUIDs for individual cells are displayed in the table below:

Maximum Density Values
Kernelx-valuemax. density
Gaussian4178.136344437020.00154668877626491
Epanechnikov4173.39652987660.0014536436395949
Rectangular4149.697457074550.0014094842845538
Triangular4168.656715316190.00154695448809478
Biweight4178.136344437020.00147842085746822
Cosine4178.136344437020.00148858230413036
Optcosine4178.136344437020.00146226348811839


Parameters (Session):
par1 = 0 ; par2 = no ; par3 = 512 ;
Parameters (R input):
par1 = 0 ; par2 = no ; par3 = 512 ;
R code (references can be found in the software module):
if (par1 == '0') bw <- 'nrd0'
if (par1 != '0') bw <- as.numeric(par1)
par3 <- as.numeric(par3)
mydensity <- array(NA, dim=c(par3,8))
bitmap(file='density1.png')
mydensity1<-density(x,bw=bw,kernel='gaussian',na.rm=TRUE)
mydensity[,8] = signif(mydensity1$x,3)
mydensity[,1] = signif(mydensity1$y,3)
plot(mydensity1,main='Gaussian Kernel',xlab=xlab,ylab=ylab)
grid()
dev.off()
mydensity1
bitmap(file='density2.png')
mydensity2<-density(x,bw=bw,kernel='epanechnikov',na.rm=TRUE)
mydensity[,2] = signif(mydensity2$y,3)
plot(mydensity2,main='Epanechnikov Kernel',xlab=xlab,ylab=ylab)
grid()
dev.off()
bitmap(file='density3.png')
mydensity3<-density(x,bw=bw,kernel='rectangular',na.rm=TRUE)
mydensity[,3] = signif(mydensity3$y,3)
plot(mydensity3,main='Rectangular Kernel',xlab=xlab,ylab=ylab)
grid()
dev.off()
bitmap(file='density4.png')
mydensity4<-density(x,bw=bw,kernel='triangular',na.rm=TRUE)
mydensity[,4] = signif(mydensity4$y,3)
plot(mydensity4,main='Triangular Kernel',xlab=xlab,ylab=ylab)
grid()
dev.off()
bitmap(file='density5.png')
mydensity5<-density(x,bw=bw,kernel='biweight',na.rm=TRUE)
mydensity[,5] = signif(mydensity5$y,3)
plot(mydensity5,main='Biweight Kernel',xlab=xlab,ylab=ylab)
grid()
dev.off()
bitmap(file='density6.png')
mydensity6<-density(x,bw=bw,kernel='cosine',na.rm=TRUE)
mydensity[,6] = signif(mydensity6$y,3)
plot(mydensity6,main='Cosine Kernel',xlab=xlab,ylab=ylab)
grid()
dev.off()
bitmap(file='density7.png')
mydensity7<-density(x,bw=bw,kernel='optcosine',na.rm=TRUE)
mydensity[,7] = signif(mydensity7$y,3)
plot(mydensity7,main='Optcosine Kernel',xlab=xlab,ylab=ylab)
grid()
dev.off()
load(file='createtable')
a<-table.start()
a<-table.row.start(a)
a<-table.element(a,'Properties of Density Trace',2,TRUE)
a<-table.row.end(a)
a<-table.row.start(a)
a<-table.element(a,'Bandwidth',header=TRUE)
a<-table.element(a,mydensity1$bw)
a<-table.row.end(a)
a<-table.row.start(a)
a<-table.element(a,'#Observations',header=TRUE)
a<-table.element(a,mydensity1$n)
a<-table.row.end(a)
a<-table.end(a)
table.save(a,file='mytable.tab')
a<-table.start()
a<-table.row.start(a)
a<-table.element(a,'Maximum Density Values',3,TRUE)
a<-table.row.end(a)
a<-table.row.start(a)
a<-table.element(a,'Kernel',1,TRUE)
a<-table.element(a,'x-value',1,TRUE)
a<-table.element(a,'max. density',1,TRUE)
a<-table.row.end(a)
a<-table.row.start(a)
a<-table.element(a,'Gaussian',1,TRUE)
a<-table.element(a,mydensity1$x[mydensity1$y==max(mydensity1$y)],1)
a<-table.element(a,mydensity1$y[mydensity1$y==max(mydensity1$y)],1)
a<-table.row.end(a)
a<-table.row.start(a)
a<-table.element(a,'Epanechnikov',1,TRUE)
a<-table.element(a,mydensity2$x[mydensity2$y==max(mydensity2$y)],1)
a<-table.element(a,mydensity2$y[mydensity2$y==max(mydensity2$y)],1)
a<-table.row.end(a)
a<-table.row.start(a)
a<-table.element(a,'Rectangular',1,TRUE)
a<-table.element(a,mydensity3$x[mydensity3$y==max(mydensity3$y)],1)
a<-table.element(a,mydensity3$y[mydensity3$y==max(mydensity3$y)],1)
a<-table.row.end(a)
a<-table.row.start(a)
a<-table.element(a,'Triangular',1,TRUE)
a<-table.element(a,mydensity4$x[mydensity4$y==max(mydensity4$y)],1)
a<-table.element(a,mydensity4$y[mydensity4$y==max(mydensity4$y)],1)
a<-table.row.end(a)
a<-table.row.start(a)
a<-table.element(a,'Biweight',1,TRUE)
a<-table.element(a,mydensity5$x[mydensity5$y==max(mydensity5$y)],1)
a<-table.element(a,mydensity5$y[mydensity5$y==max(mydensity5$y)],1)
a<-table.row.end(a)
a<-table.row.start(a)
a<-table.element(a,'Cosine',1,TRUE)
a<-table.element(a,mydensity6$x[mydensity6$y==max(mydensity6$y)],1)
a<-table.element(a,mydensity6$y[mydensity6$y==max(mydensity6$y)],1)
a<-table.row.end(a)
a<-table.row.start(a)
a<-table.element(a,'Optcosine',1,TRUE)
a<-table.element(a,mydensity7$x[mydensity7$y==max(mydensity7$y)],1)
a<-table.element(a,mydensity7$y[mydensity7$y==max(mydensity7$y)],1)
a<-table.row.end(a)
a<-table.end(a)
table.save(a,file='mytable2.tab')
if (par2=='yes') {
a<-table.start()
a<-table.row.start(a)
a<-table.element(a,'Kernel Density Values',8,TRUE)
a<-table.row.end(a)
a<-table.row.start(a)
a<-table.element(a,'x-value',1,TRUE)
a<-table.element(a,'Gaussian',1,TRUE)
a<-table.element(a,'Epanechnikov',1,TRUE)
a<-table.element(a,'Rectangular',1,TRUE)
a<-table.element(a,'Triangular',1,TRUE)
a<-table.element(a,'Biweight',1,TRUE)
a<-table.element(a,'Cosine',1,TRUE)
a<-table.element(a,'Optcosine',1,TRUE)
a<-table.row.end(a)
for(i in 1:par3) {
a<-table.row.start(a)
a<-table.element(a,mydensity[i,8],1,TRUE)
for(j in 1:7) {
a<-table.element(a,mydensity[i,j],1)
}
a<-table.row.end(a)
}
a<-table.end(a)
table.save(a,file='mytable1.tab')
}