Free Statistics

of Irreproducible Research!

Author's title

Author*Unverified author*
R Software Modulerwasp_autocorrelation.wasp
Title produced by software(Partial) Autocorrelation Function
Date of computationWed, 13 Aug 2014 16:08:09 +0100
Cite this page as followsStatistical Computations at FreeStatistics.org, Office for Research Development and Education, URL https://freestatistics.org/blog/index.php?v=date/2014/Aug/13/t1407942523n8mu4f5a2g6mex2.htm/, Retrieved Thu, 16 May 2024 14:17:35 +0000
Statistical Computations at FreeStatistics.org, Office for Research Development and Education, URL https://freestatistics.org/blog/index.php?pk=235534, Retrieved Thu, 16 May 2024 14:17:35 +0000
QR Codes:

Original text written by user:
IsPrivate?No (this computation is public)
User-defined keywordsBoeykens Brice
Estimated Impact121
Family? (F = Feedback message, R = changed R code, M = changed R Module, P = changed Parameters, D = changed Data)
-       [(Partial) Autocorrelation Function] [Tijdreeks B Stap 17] [2014-08-13 15:08:09] [7314f5de623f4497f735e8af2050bf2f] [Current]
- RMP     [Variability] [Tijdreeks B Stap 20] [2014-08-13 15:59:01] [2064a7ed2562130dd70fccaf2dd61d5a]
- RMP     [Standard Deviation-Mean Plot] [Tijdreeks B Stap 21] [2014-08-13 16:03:38] [2064a7ed2562130dd70fccaf2dd61d5a]
Feedback Forum

Post a new message
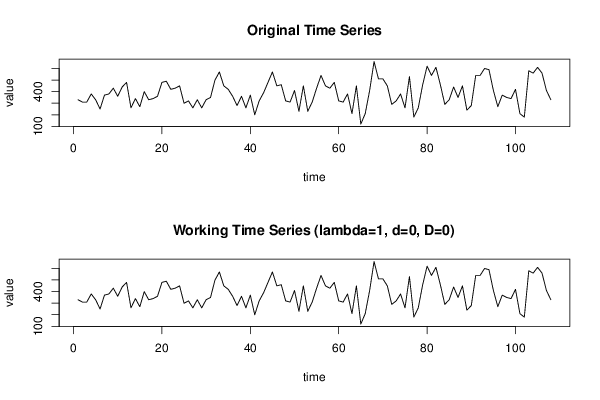
Dataseries X:
330
310
310
380
330
250
370
380
430
360
440
480
260
340
270
400
330
340
360
480
490
420
430
450
300
320
260
330
260
330
350
500
570
450
420
360
280
360
260
370
200
320
390
480
570
450
460
320
310
410
230
450
230
310
430
540
450
430
480
320
310
380
210
450
120
210
410
660
510
510
450
290
320
380
260
530
180
260
460
620
540
610
460
290
330
440
350
450
240
280
540
540
600
590
410
270
370
350
340
420
210
180
580
560
610
560
410
330


Summary of computational transaction
Raw Inputview raw input (R code)
Raw Outputview raw output of R engine
Computing time1 seconds
R Server'Sir Maurice George Kendall' @ kendall.wessa.net

\begin{tabular}{lllllllll}
\hline
Summary of computational transaction \tabularnewline
Raw Input & view raw input (R code)  \tabularnewline
Raw Output & view raw output of R engine  \tabularnewline
Computing time & 1 seconds \tabularnewline
R Server & 'Sir Maurice George Kendall' @ kendall.wessa.net \tabularnewline
\hline
\end{tabular}
%Source: https://freestatistics.org/blog/index.php?pk=235534&T=0

[TABLE]
[ROW][C]Summary of computational transaction[/C][/ROW]
[ROW][C]Raw Input[/C][C]view raw input (R code) [/C][/ROW]
[ROW][C]Raw Output[/C][C]view raw output of R engine [/C][/ROW]
[ROW][C]Computing time[/C][C]1 seconds[/C][/ROW]
[ROW][C]R Server[/C][C]'Sir Maurice George Kendall' @ kendall.wessa.net[/C][/ROW]
[/TABLE]
Source: https://freestatistics.org/blog/index.php?pk=235534&T=0

Globally Unique Identifier (entire table): ba.freestatistics.org/blog/index.php?pk=235534&T=0

As an alternative you can also use a QR Code:  

The GUIDs for individual cells are displayed in the table below:

Summary of computational transaction
Raw Inputview raw input (R code)
Raw Outputview raw output of R engine
Computing time1 seconds
R Server'Sir Maurice George Kendall' @ kendall.wessa.net


Autocorrelation Function
Time lag kACF(k)T-STATP-value
10.3682763.82720.000109
20.1176271.22240.112105
3-0.130003-1.3510.089754
4-0.289646-3.01010.001626
5-0.25005-2.59860.005334
6-0.164235-1.70680.045368
7-0.247247-2.56950.005775
8-0.263393-2.73730.003623
9-0.105621-1.09760.1374
100.1046091.08710.139699
110.3418573.55270.000283
120.8057978.37410
130.2884612.99780.001688
140.1112641.15630.125056
15-0.137284-1.42670.078275
16-0.286126-2.97350.001816
17-0.212944-2.2130.014501
18-0.176069-1.82980.035022
19-0.24-2.49420.007071
20-0.230074-2.3910.009266
21-0.081068-0.84250.200691
220.1017531.05750.146333
230.3599063.74020.000148
240.6422616.67460
250.2242892.33090.010808
260.101211.05180.147618
27-0.124634-1.29520.099
28-0.260157-2.70360.003985
29-0.188222-1.95610.02652
30-0.187526-1.94880.026955
31-0.198445-2.06230.020789
32-0.184038-1.91260.029225
33-0.08109-0.84270.200625
340.083960.87250.192426
350.3315753.44580.000406
360.500225.19840
370.1842961.91530.029052
380.093620.97290.166381
39-0.126613-1.31580.095514
40-0.220098-2.28730.012063
41-0.179576-1.86620.032363
42-0.202494-2.10440.018833
43-0.171118-1.77830.039083
44-0.124016-1.28880.10011
45-0.06816-0.70830.240132
460.0707310.73510.231948
470.2521852.62080.005018
480.3453983.58950.00025

\begin{tabular}{lllllllll}
\hline
Autocorrelation Function \tabularnewline
Time lag k & ACF(k) & T-STAT & P-value \tabularnewline
1 & 0.368276 & 3.8272 & 0.000109 \tabularnewline
2 & 0.117627 & 1.2224 & 0.112105 \tabularnewline
3 & -0.130003 & -1.351 & 0.089754 \tabularnewline
4 & -0.289646 & -3.0101 & 0.001626 \tabularnewline
5 & -0.25005 & -2.5986 & 0.005334 \tabularnewline
6 & -0.164235 & -1.7068 & 0.045368 \tabularnewline
7 & -0.247247 & -2.5695 & 0.005775 \tabularnewline
8 & -0.263393 & -2.7373 & 0.003623 \tabularnewline
9 & -0.105621 & -1.0976 & 0.1374 \tabularnewline
10 & 0.104609 & 1.0871 & 0.139699 \tabularnewline
11 & 0.341857 & 3.5527 & 0.000283 \tabularnewline
12 & 0.805797 & 8.3741 & 0 \tabularnewline
13 & 0.288461 & 2.9978 & 0.001688 \tabularnewline
14 & 0.111264 & 1.1563 & 0.125056 \tabularnewline
15 & -0.137284 & -1.4267 & 0.078275 \tabularnewline
16 & -0.286126 & -2.9735 & 0.001816 \tabularnewline
17 & -0.212944 & -2.213 & 0.014501 \tabularnewline
18 & -0.176069 & -1.8298 & 0.035022 \tabularnewline
19 & -0.24 & -2.4942 & 0.007071 \tabularnewline
20 & -0.230074 & -2.391 & 0.009266 \tabularnewline
21 & -0.081068 & -0.8425 & 0.200691 \tabularnewline
22 & 0.101753 & 1.0575 & 0.146333 \tabularnewline
23 & 0.359906 & 3.7402 & 0.000148 \tabularnewline
24 & 0.642261 & 6.6746 & 0 \tabularnewline
25 & 0.224289 & 2.3309 & 0.010808 \tabularnewline
26 & 0.10121 & 1.0518 & 0.147618 \tabularnewline
27 & -0.124634 & -1.2952 & 0.099 \tabularnewline
28 & -0.260157 & -2.7036 & 0.003985 \tabularnewline
29 & -0.188222 & -1.9561 & 0.02652 \tabularnewline
30 & -0.187526 & -1.9488 & 0.026955 \tabularnewline
31 & -0.198445 & -2.0623 & 0.020789 \tabularnewline
32 & -0.184038 & -1.9126 & 0.029225 \tabularnewline
33 & -0.08109 & -0.8427 & 0.200625 \tabularnewline
34 & 0.08396 & 0.8725 & 0.192426 \tabularnewline
35 & 0.331575 & 3.4458 & 0.000406 \tabularnewline
36 & 0.50022 & 5.1984 & 0 \tabularnewline
37 & 0.184296 & 1.9153 & 0.029052 \tabularnewline
38 & 0.09362 & 0.9729 & 0.166381 \tabularnewline
39 & -0.126613 & -1.3158 & 0.095514 \tabularnewline
40 & -0.220098 & -2.2873 & 0.012063 \tabularnewline
41 & -0.179576 & -1.8662 & 0.032363 \tabularnewline
42 & -0.202494 & -2.1044 & 0.018833 \tabularnewline
43 & -0.171118 & -1.7783 & 0.039083 \tabularnewline
44 & -0.124016 & -1.2888 & 0.10011 \tabularnewline
45 & -0.06816 & -0.7083 & 0.240132 \tabularnewline
46 & 0.070731 & 0.7351 & 0.231948 \tabularnewline
47 & 0.252185 & 2.6208 & 0.005018 \tabularnewline
48 & 0.345398 & 3.5895 & 0.00025 \tabularnewline
\hline
\end{tabular}
%Source: https://freestatistics.org/blog/index.php?pk=235534&T=1

[TABLE]
[ROW][C]Autocorrelation Function[/C][/ROW]
[ROW][C]Time lag k[/C][C]ACF(k)[/C][C]T-STAT[/C][C]P-value[/C][/ROW]
[ROW][C]1[/C][C]0.368276[/C][C]3.8272[/C][C]0.000109[/C][/ROW]
[ROW][C]2[/C][C]0.117627[/C][C]1.2224[/C][C]0.112105[/C][/ROW]
[ROW][C]3[/C][C]-0.130003[/C][C]-1.351[/C][C]0.089754[/C][/ROW]
[ROW][C]4[/C][C]-0.289646[/C][C]-3.0101[/C][C]0.001626[/C][/ROW]
[ROW][C]5[/C][C]-0.25005[/C][C]-2.5986[/C][C]0.005334[/C][/ROW]
[ROW][C]6[/C][C]-0.164235[/C][C]-1.7068[/C][C]0.045368[/C][/ROW]
[ROW][C]7[/C][C]-0.247247[/C][C]-2.5695[/C][C]0.005775[/C][/ROW]
[ROW][C]8[/C][C]-0.263393[/C][C]-2.7373[/C][C]0.003623[/C][/ROW]
[ROW][C]9[/C][C]-0.105621[/C][C]-1.0976[/C][C]0.1374[/C][/ROW]
[ROW][C]10[/C][C]0.104609[/C][C]1.0871[/C][C]0.139699[/C][/ROW]
[ROW][C]11[/C][C]0.341857[/C][C]3.5527[/C][C]0.000283[/C][/ROW]
[ROW][C]12[/C][C]0.805797[/C][C]8.3741[/C][C]0[/C][/ROW]
[ROW][C]13[/C][C]0.288461[/C][C]2.9978[/C][C]0.001688[/C][/ROW]
[ROW][C]14[/C][C]0.111264[/C][C]1.1563[/C][C]0.125056[/C][/ROW]
[ROW][C]15[/C][C]-0.137284[/C][C]-1.4267[/C][C]0.078275[/C][/ROW]
[ROW][C]16[/C][C]-0.286126[/C][C]-2.9735[/C][C]0.001816[/C][/ROW]
[ROW][C]17[/C][C]-0.212944[/C][C]-2.213[/C][C]0.014501[/C][/ROW]
[ROW][C]18[/C][C]-0.176069[/C][C]-1.8298[/C][C]0.035022[/C][/ROW]
[ROW][C]19[/C][C]-0.24[/C][C]-2.4942[/C][C]0.007071[/C][/ROW]
[ROW][C]20[/C][C]-0.230074[/C][C]-2.391[/C][C]0.009266[/C][/ROW]
[ROW][C]21[/C][C]-0.081068[/C][C]-0.8425[/C][C]0.200691[/C][/ROW]
[ROW][C]22[/C][C]0.101753[/C][C]1.0575[/C][C]0.146333[/C][/ROW]
[ROW][C]23[/C][C]0.359906[/C][C]3.7402[/C][C]0.000148[/C][/ROW]
[ROW][C]24[/C][C]0.642261[/C][C]6.6746[/C][C]0[/C][/ROW]
[ROW][C]25[/C][C]0.224289[/C][C]2.3309[/C][C]0.010808[/C][/ROW]
[ROW][C]26[/C][C]0.10121[/C][C]1.0518[/C][C]0.147618[/C][/ROW]
[ROW][C]27[/C][C]-0.124634[/C][C]-1.2952[/C][C]0.099[/C][/ROW]
[ROW][C]28[/C][C]-0.260157[/C][C]-2.7036[/C][C]0.003985[/C][/ROW]
[ROW][C]29[/C][C]-0.188222[/C][C]-1.9561[/C][C]0.02652[/C][/ROW]
[ROW][C]30[/C][C]-0.187526[/C][C]-1.9488[/C][C]0.026955[/C][/ROW]
[ROW][C]31[/C][C]-0.198445[/C][C]-2.0623[/C][C]0.020789[/C][/ROW]
[ROW][C]32[/C][C]-0.184038[/C][C]-1.9126[/C][C]0.029225[/C][/ROW]
[ROW][C]33[/C][C]-0.08109[/C][C]-0.8427[/C][C]0.200625[/C][/ROW]
[ROW][C]34[/C][C]0.08396[/C][C]0.8725[/C][C]0.192426[/C][/ROW]
[ROW][C]35[/C][C]0.331575[/C][C]3.4458[/C][C]0.000406[/C][/ROW]
[ROW][C]36[/C][C]0.50022[/C][C]5.1984[/C][C]0[/C][/ROW]
[ROW][C]37[/C][C]0.184296[/C][C]1.9153[/C][C]0.029052[/C][/ROW]
[ROW][C]38[/C][C]0.09362[/C][C]0.9729[/C][C]0.166381[/C][/ROW]
[ROW][C]39[/C][C]-0.126613[/C][C]-1.3158[/C][C]0.095514[/C][/ROW]
[ROW][C]40[/C][C]-0.220098[/C][C]-2.2873[/C][C]0.012063[/C][/ROW]
[ROW][C]41[/C][C]-0.179576[/C][C]-1.8662[/C][C]0.032363[/C][/ROW]
[ROW][C]42[/C][C]-0.202494[/C][C]-2.1044[/C][C]0.018833[/C][/ROW]
[ROW][C]43[/C][C]-0.171118[/C][C]-1.7783[/C][C]0.039083[/C][/ROW]
[ROW][C]44[/C][C]-0.124016[/C][C]-1.2888[/C][C]0.10011[/C][/ROW]
[ROW][C]45[/C][C]-0.06816[/C][C]-0.7083[/C][C]0.240132[/C][/ROW]
[ROW][C]46[/C][C]0.070731[/C][C]0.7351[/C][C]0.231948[/C][/ROW]
[ROW][C]47[/C][C]0.252185[/C][C]2.6208[/C][C]0.005018[/C][/ROW]
[ROW][C]48[/C][C]0.345398[/C][C]3.5895[/C][C]0.00025[/C][/ROW]
[/TABLE]
Source: https://freestatistics.org/blog/index.php?pk=235534&T=1

Globally Unique Identifier (entire table): ba.freestatistics.org/blog/index.php?pk=235534&T=1

As an alternative you can also use a QR Code:  

The GUIDs for individual cells are displayed in the table below:

Autocorrelation Function
Time lag kACF(k)T-STATP-value
10.3682763.82720.000109
20.1176271.22240.112105
3-0.130003-1.3510.089754
4-0.289646-3.01010.001626
5-0.25005-2.59860.005334
6-0.164235-1.70680.045368
7-0.247247-2.56950.005775
8-0.263393-2.73730.003623
9-0.105621-1.09760.1374
100.1046091.08710.139699
110.3418573.55270.000283
120.8057978.37410
130.2884612.99780.001688
140.1112641.15630.125056
15-0.137284-1.42670.078275
16-0.286126-2.97350.001816
17-0.212944-2.2130.014501
18-0.176069-1.82980.035022
19-0.24-2.49420.007071
20-0.230074-2.3910.009266
21-0.081068-0.84250.200691
220.1017531.05750.146333
230.3599063.74020.000148
240.6422616.67460
250.2242892.33090.010808
260.101211.05180.147618
27-0.124634-1.29520.099
28-0.260157-2.70360.003985
29-0.188222-1.95610.02652
30-0.187526-1.94880.026955
31-0.198445-2.06230.020789
32-0.184038-1.91260.029225
33-0.08109-0.84270.200625
340.083960.87250.192426
350.3315753.44580.000406
360.500225.19840
370.1842961.91530.029052
380.093620.97290.166381
39-0.126613-1.31580.095514
40-0.220098-2.28730.012063
41-0.179576-1.86620.032363
42-0.202494-2.10440.018833
43-0.171118-1.77830.039083
44-0.124016-1.28880.10011
45-0.06816-0.70830.240132
460.0707310.73510.231948
470.2521852.62080.005018
480.3453983.58950.00025


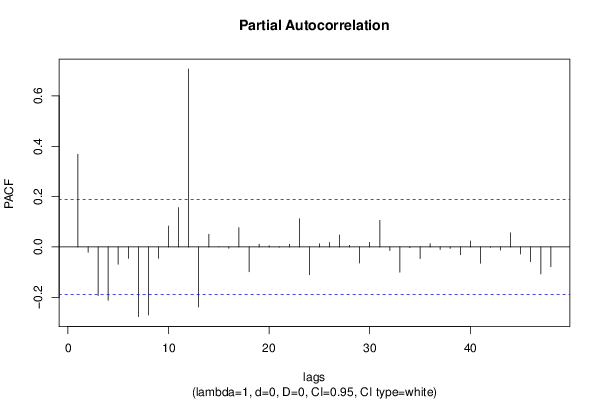
Partial Autocorrelation Function
Time lag kPACF(k)T-STATP-value
10.3682763.82720.000109
2-0.020824-0.21640.414537
3-0.192773-2.00340.023822
4-0.212017-2.20330.014847
5-0.068649-0.71340.238563
6-0.045439-0.47220.318864
7-0.277009-2.87880.002407
8-0.270455-2.81070.002936
9-0.044726-0.46480.321502
100.0827260.85970.195927
110.1563461.62480.053561
120.7072177.34960
13-0.238992-2.48370.00727
140.0503880.52370.300797
150.0001790.00190.499262
16-0.00496-0.05150.479494
170.0767640.79780.213382
18-0.098402-1.02260.154386
190.010510.10920.456614
200.0050770.05280.479011
21-0.000517-0.00540.49786
220.0105210.10930.456569
230.1122071.16610.123074
24-0.110633-1.14970.126398
250.0124820.12970.448514
260.0178480.18550.426598
270.0477490.49620.310371
280.0063860.06640.473603
29-0.063654-0.66150.254845
300.0181970.18910.42518
310.1055311.09670.137604
32-0.014421-0.14990.440575
33-0.10025-1.04180.14991
34-0.002825-0.02940.488317
35-0.046365-0.48180.315447
360.012890.1340.446842
37-0.010421-0.10830.456979
38-0.005853-0.06080.475805
39-0.031233-0.32460.373062
400.0239070.24840.40213
41-0.064893-0.67440.250754
42-0.001826-0.0190.492448
43-0.012577-0.13070.448125
440.0557940.57980.281619
45-0.028374-0.29490.384328
46-0.058511-0.60810.27221
47-0.107111-1.11310.134061
48-0.079101-0.8220.206431

\begin{tabular}{lllllllll}
\hline
Partial Autocorrelation Function \tabularnewline
Time lag k & PACF(k) & T-STAT & P-value \tabularnewline
1 & 0.368276 & 3.8272 & 0.000109 \tabularnewline
2 & -0.020824 & -0.2164 & 0.414537 \tabularnewline
3 & -0.192773 & -2.0034 & 0.023822 \tabularnewline
4 & -0.212017 & -2.2033 & 0.014847 \tabularnewline
5 & -0.068649 & -0.7134 & 0.238563 \tabularnewline
6 & -0.045439 & -0.4722 & 0.318864 \tabularnewline
7 & -0.277009 & -2.8788 & 0.002407 \tabularnewline
8 & -0.270455 & -2.8107 & 0.002936 \tabularnewline
9 & -0.044726 & -0.4648 & 0.321502 \tabularnewline
10 & 0.082726 & 0.8597 & 0.195927 \tabularnewline
11 & 0.156346 & 1.6248 & 0.053561 \tabularnewline
12 & 0.707217 & 7.3496 & 0 \tabularnewline
13 & -0.238992 & -2.4837 & 0.00727 \tabularnewline
14 & 0.050388 & 0.5237 & 0.300797 \tabularnewline
15 & 0.000179 & 0.0019 & 0.499262 \tabularnewline
16 & -0.00496 & -0.0515 & 0.479494 \tabularnewline
17 & 0.076764 & 0.7978 & 0.213382 \tabularnewline
18 & -0.098402 & -1.0226 & 0.154386 \tabularnewline
19 & 0.01051 & 0.1092 & 0.456614 \tabularnewline
20 & 0.005077 & 0.0528 & 0.479011 \tabularnewline
21 & -0.000517 & -0.0054 & 0.49786 \tabularnewline
22 & 0.010521 & 0.1093 & 0.456569 \tabularnewline
23 & 0.112207 & 1.1661 & 0.123074 \tabularnewline
24 & -0.110633 & -1.1497 & 0.126398 \tabularnewline
25 & 0.012482 & 0.1297 & 0.448514 \tabularnewline
26 & 0.017848 & 0.1855 & 0.426598 \tabularnewline
27 & 0.047749 & 0.4962 & 0.310371 \tabularnewline
28 & 0.006386 & 0.0664 & 0.473603 \tabularnewline
29 & -0.063654 & -0.6615 & 0.254845 \tabularnewline
30 & 0.018197 & 0.1891 & 0.42518 \tabularnewline
31 & 0.105531 & 1.0967 & 0.137604 \tabularnewline
32 & -0.014421 & -0.1499 & 0.440575 \tabularnewline
33 & -0.10025 & -1.0418 & 0.14991 \tabularnewline
34 & -0.002825 & -0.0294 & 0.488317 \tabularnewline
35 & -0.046365 & -0.4818 & 0.315447 \tabularnewline
36 & 0.01289 & 0.134 & 0.446842 \tabularnewline
37 & -0.010421 & -0.1083 & 0.456979 \tabularnewline
38 & -0.005853 & -0.0608 & 0.475805 \tabularnewline
39 & -0.031233 & -0.3246 & 0.373062 \tabularnewline
40 & 0.023907 & 0.2484 & 0.40213 \tabularnewline
41 & -0.064893 & -0.6744 & 0.250754 \tabularnewline
42 & -0.001826 & -0.019 & 0.492448 \tabularnewline
43 & -0.012577 & -0.1307 & 0.448125 \tabularnewline
44 & 0.055794 & 0.5798 & 0.281619 \tabularnewline
45 & -0.028374 & -0.2949 & 0.384328 \tabularnewline
46 & -0.058511 & -0.6081 & 0.27221 \tabularnewline
47 & -0.107111 & -1.1131 & 0.134061 \tabularnewline
48 & -0.079101 & -0.822 & 0.206431 \tabularnewline
\hline
\end{tabular}
%Source: https://freestatistics.org/blog/index.php?pk=235534&T=2

[TABLE]
[ROW][C]Partial Autocorrelation Function[/C][/ROW]
[ROW][C]Time lag k[/C][C]PACF(k)[/C][C]T-STAT[/C][C]P-value[/C][/ROW]
[ROW][C]1[/C][C]0.368276[/C][C]3.8272[/C][C]0.000109[/C][/ROW]
[ROW][C]2[/C][C]-0.020824[/C][C]-0.2164[/C][C]0.414537[/C][/ROW]
[ROW][C]3[/C][C]-0.192773[/C][C]-2.0034[/C][C]0.023822[/C][/ROW]
[ROW][C]4[/C][C]-0.212017[/C][C]-2.2033[/C][C]0.014847[/C][/ROW]
[ROW][C]5[/C][C]-0.068649[/C][C]-0.7134[/C][C]0.238563[/C][/ROW]
[ROW][C]6[/C][C]-0.045439[/C][C]-0.4722[/C][C]0.318864[/C][/ROW]
[ROW][C]7[/C][C]-0.277009[/C][C]-2.8788[/C][C]0.002407[/C][/ROW]
[ROW][C]8[/C][C]-0.270455[/C][C]-2.8107[/C][C]0.002936[/C][/ROW]
[ROW][C]9[/C][C]-0.044726[/C][C]-0.4648[/C][C]0.321502[/C][/ROW]
[ROW][C]10[/C][C]0.082726[/C][C]0.8597[/C][C]0.195927[/C][/ROW]
[ROW][C]11[/C][C]0.156346[/C][C]1.6248[/C][C]0.053561[/C][/ROW]
[ROW][C]12[/C][C]0.707217[/C][C]7.3496[/C][C]0[/C][/ROW]
[ROW][C]13[/C][C]-0.238992[/C][C]-2.4837[/C][C]0.00727[/C][/ROW]
[ROW][C]14[/C][C]0.050388[/C][C]0.5237[/C][C]0.300797[/C][/ROW]
[ROW][C]15[/C][C]0.000179[/C][C]0.0019[/C][C]0.499262[/C][/ROW]
[ROW][C]16[/C][C]-0.00496[/C][C]-0.0515[/C][C]0.479494[/C][/ROW]
[ROW][C]17[/C][C]0.076764[/C][C]0.7978[/C][C]0.213382[/C][/ROW]
[ROW][C]18[/C][C]-0.098402[/C][C]-1.0226[/C][C]0.154386[/C][/ROW]
[ROW][C]19[/C][C]0.01051[/C][C]0.1092[/C][C]0.456614[/C][/ROW]
[ROW][C]20[/C][C]0.005077[/C][C]0.0528[/C][C]0.479011[/C][/ROW]
[ROW][C]21[/C][C]-0.000517[/C][C]-0.0054[/C][C]0.49786[/C][/ROW]
[ROW][C]22[/C][C]0.010521[/C][C]0.1093[/C][C]0.456569[/C][/ROW]
[ROW][C]23[/C][C]0.112207[/C][C]1.1661[/C][C]0.123074[/C][/ROW]
[ROW][C]24[/C][C]-0.110633[/C][C]-1.1497[/C][C]0.126398[/C][/ROW]
[ROW][C]25[/C][C]0.012482[/C][C]0.1297[/C][C]0.448514[/C][/ROW]
[ROW][C]26[/C][C]0.017848[/C][C]0.1855[/C][C]0.426598[/C][/ROW]
[ROW][C]27[/C][C]0.047749[/C][C]0.4962[/C][C]0.310371[/C][/ROW]
[ROW][C]28[/C][C]0.006386[/C][C]0.0664[/C][C]0.473603[/C][/ROW]
[ROW][C]29[/C][C]-0.063654[/C][C]-0.6615[/C][C]0.254845[/C][/ROW]
[ROW][C]30[/C][C]0.018197[/C][C]0.1891[/C][C]0.42518[/C][/ROW]
[ROW][C]31[/C][C]0.105531[/C][C]1.0967[/C][C]0.137604[/C][/ROW]
[ROW][C]32[/C][C]-0.014421[/C][C]-0.1499[/C][C]0.440575[/C][/ROW]
[ROW][C]33[/C][C]-0.10025[/C][C]-1.0418[/C][C]0.14991[/C][/ROW]
[ROW][C]34[/C][C]-0.002825[/C][C]-0.0294[/C][C]0.488317[/C][/ROW]
[ROW][C]35[/C][C]-0.046365[/C][C]-0.4818[/C][C]0.315447[/C][/ROW]
[ROW][C]36[/C][C]0.01289[/C][C]0.134[/C][C]0.446842[/C][/ROW]
[ROW][C]37[/C][C]-0.010421[/C][C]-0.1083[/C][C]0.456979[/C][/ROW]
[ROW][C]38[/C][C]-0.005853[/C][C]-0.0608[/C][C]0.475805[/C][/ROW]
[ROW][C]39[/C][C]-0.031233[/C][C]-0.3246[/C][C]0.373062[/C][/ROW]
[ROW][C]40[/C][C]0.023907[/C][C]0.2484[/C][C]0.40213[/C][/ROW]
[ROW][C]41[/C][C]-0.064893[/C][C]-0.6744[/C][C]0.250754[/C][/ROW]
[ROW][C]42[/C][C]-0.001826[/C][C]-0.019[/C][C]0.492448[/C][/ROW]
[ROW][C]43[/C][C]-0.012577[/C][C]-0.1307[/C][C]0.448125[/C][/ROW]
[ROW][C]44[/C][C]0.055794[/C][C]0.5798[/C][C]0.281619[/C][/ROW]
[ROW][C]45[/C][C]-0.028374[/C][C]-0.2949[/C][C]0.384328[/C][/ROW]
[ROW][C]46[/C][C]-0.058511[/C][C]-0.6081[/C][C]0.27221[/C][/ROW]
[ROW][C]47[/C][C]-0.107111[/C][C]-1.1131[/C][C]0.134061[/C][/ROW]
[ROW][C]48[/C][C]-0.079101[/C][C]-0.822[/C][C]0.206431[/C][/ROW]
[/TABLE]
Source: https://freestatistics.org/blog/index.php?pk=235534&T=2

Globally Unique Identifier (entire table): ba.freestatistics.org/blog/index.php?pk=235534&T=2

As an alternative you can also use a QR Code:  

The GUIDs for individual cells are displayed in the table below:

Partial Autocorrelation Function
Time lag kPACF(k)T-STATP-value
10.3682763.82720.000109
2-0.020824-0.21640.414537
3-0.192773-2.00340.023822
4-0.212017-2.20330.014847
5-0.068649-0.71340.238563
6-0.045439-0.47220.318864
7-0.277009-2.87880.002407
8-0.270455-2.81070.002936
9-0.044726-0.46480.321502
100.0827260.85970.195927
110.1563461.62480.053561
120.7072177.34960
13-0.238992-2.48370.00727
140.0503880.52370.300797
150.0001790.00190.499262
16-0.00496-0.05150.479494
170.0767640.79780.213382
18-0.098402-1.02260.154386
190.010510.10920.456614
200.0050770.05280.479011
21-0.000517-0.00540.49786
220.0105210.10930.456569
230.1122071.16610.123074
24-0.110633-1.14970.126398
250.0124820.12970.448514
260.0178480.18550.426598
270.0477490.49620.310371
280.0063860.06640.473603
29-0.063654-0.66150.254845
300.0181970.18910.42518
310.1055311.09670.137604
32-0.014421-0.14990.440575
33-0.10025-1.04180.14991
34-0.002825-0.02940.488317
35-0.046365-0.48180.315447
360.012890.1340.446842
37-0.010421-0.10830.456979
38-0.005853-0.06080.475805
39-0.031233-0.32460.373062
400.0239070.24840.40213
41-0.064893-0.67440.250754
42-0.001826-0.0190.492448
43-0.012577-0.13070.448125
440.0557940.57980.281619
45-0.028374-0.29490.384328
46-0.058511-0.60810.27221
47-0.107111-1.11310.134061
48-0.079101-0.8220.206431


Parameters (Session):
par1 = 48 ; par2 = 1 ; par3 = 0 ; par4 = 0 ; par5 = 12 ; par6 = White Noise ; par7 = 0.95 ;
Parameters (R input):
par1 = 48 ; par2 = 1 ; par3 = 0 ; par4 = 0 ; par5 = 12 ; par6 = White Noise ; par7 = 0.95 ; par8 = ;
R code (references can be found in the software module):
if (par1 == 'Default') {
par1 = 10*log10(length(x))
} else {
par1 <- as.numeric(par1)
}
par2 <- as.numeric(par2)
par3 <- as.numeric(par3)
par4 <- as.numeric(par4)
par5 <- as.numeric(par5)
if (par6 == 'White Noise') par6 <- 'white' else par6 <- 'ma'
par7 <- as.numeric(par7)
if (par8 != '') par8 <- as.numeric(par8)
ox <- x
if (par8 == '') {
if (par2 == 0) {
x <- log(x)
} else {
x <- (x ^ par2 - 1) / par2
}
} else {
x <- log(x,base=par8)
}
if (par3 > 0) x <- diff(x,lag=1,difference=par3)
if (par4 > 0) x <- diff(x,lag=par5,difference=par4)
bitmap(file='picts.png')
op <- par(mfrow=c(2,1))
plot(ox,type='l',main='Original Time Series',xlab='time',ylab='value')
if (par8=='') {
mytitle <- paste('Working Time Series (lambda=',par2,', d=',par3,', D=',par4,')',sep='')
mysub <- paste('(lambda=',par2,', d=',par3,', D=',par4,', CI=', par7, ', CI type=',par6,')',sep='')
} else {
mytitle <- paste('Working Time Series (base=',par8,', d=',par3,', D=',par4,')',sep='')
mysub <- paste('(base=',par8,', d=',par3,', D=',par4,', CI=', par7, ', CI type=',par6,')',sep='')
}
plot(x,type='l', main=mytitle,xlab='time',ylab='value')
par(op)
dev.off()
bitmap(file='pic1.png')
racf <- acf(x, par1, main='Autocorrelation', xlab='time lag', ylab='ACF', ci.type=par6, ci=par7, sub=mysub)
dev.off()
bitmap(file='pic2.png')
rpacf <- pacf(x,par1,main='Partial Autocorrelation',xlab='lags',ylab='PACF',sub=mysub)
dev.off()
(myacf <- c(racf$acf))
(mypacf <- c(rpacf$acf))
lengthx <- length(x)
sqrtn <- sqrt(lengthx)
load(file='createtable')
a<-table.start()
a<-table.row.start(a)
a<-table.element(a,'Autocorrelation Function',4,TRUE)
a<-table.row.end(a)
a<-table.row.start(a)
a<-table.element(a,'Time lag k',header=TRUE)
a<-table.element(a,hyperlink('basics.htm','ACF(k)','click here for more information about the Autocorrelation Function'),header=TRUE)
a<-table.element(a,'T-STAT',header=TRUE)
a<-table.element(a,'P-value',header=TRUE)
a<-table.row.end(a)
for (i in 2:(par1+1)) {
a<-table.row.start(a)
a<-table.element(a,i-1,header=TRUE)
a<-table.element(a,round(myacf[i],6))
mytstat <- myacf[i]*sqrtn
a<-table.element(a,round(mytstat,4))
a<-table.element(a,round(1-pt(abs(mytstat),lengthx),6))
a<-table.row.end(a)
}
a<-table.end(a)
table.save(a,file='mytable.tab')
a<-table.start()
a<-table.row.start(a)
a<-table.element(a,'Partial Autocorrelation Function',4,TRUE)
a<-table.row.end(a)
a<-table.row.start(a)
a<-table.element(a,'Time lag k',header=TRUE)
a<-table.element(a,hyperlink('basics.htm','PACF(k)','click here for more information about the Partial Autocorrelation Function'),header=TRUE)
a<-table.element(a,'T-STAT',header=TRUE)
a<-table.element(a,'P-value',header=TRUE)
a<-table.row.end(a)
for (i in 1:par1) {
a<-table.row.start(a)
a<-table.element(a,i,header=TRUE)
a<-table.element(a,round(mypacf[i],6))
mytstat <- mypacf[i]*sqrtn
a<-table.element(a,round(mytstat,4))
a<-table.element(a,round(1-pt(abs(mytstat),lengthx),6))
a<-table.row.end(a)
}
a<-table.end(a)
table.save(a,file='mytable1.tab')