Free Statistics

of Irreproducible Research!

Author's title

Author*Unverified author*
R Software Modulerwasp_autocorrelation.wasp
Title produced by software(Partial) Autocorrelation Function
Date of computationFri, 15 Aug 2014 17:00:42 +0100
Cite this page as followsStatistical Computations at FreeStatistics.org, Office for Research Development and Education, URL https://freestatistics.org/blog/index.php?v=date/2014/Aug/15/t1408118500lulmo5q8t6zmvx3.htm/, Retrieved Thu, 16 May 2024 16:55:23 +0000
Statistical Computations at FreeStatistics.org, Office for Research Development and Education, URL https://freestatistics.org/blog/index.php?pk=235596, Retrieved Thu, 16 May 2024 16:55:23 +0000
QR Codes:

Original text written by user:
IsPrivate?No (this computation is public)
User-defined keywordsDaemen Wout
Estimated Impact153
Family? (F = Feedback message, R = changed R code, M = changed R Module, P = changed Parameters, D = changed Data)
-     [Histogram] [Tijdreeks 1 - Stap 3] [2014-07-16 17:55:19] [db363657be53a1294332fdf107f4512c]
- RMP   [Kernel Density Estimation] [Tijdreeks 1 - Stap 6] [2014-07-26 16:09:14] [74be16979710d4c4e7c6647856088456]
- RM      [Central Tendency] [Tijdreeks 1 - Sta...] [2014-07-26 17:27:42] [db363657be53a1294332fdf107f4512c]
- RMP       [(Partial) Autocorrelation Function] [Tijdreeks 2 - Sta...] [2014-08-07 16:59:21] [db363657be53a1294332fdf107f4512c]
-    D          [(Partial) Autocorrelation Function] [Tijdreeks 2 - Sta...] [2014-08-15 16:00:42] [a3f6f3ab25c27d7686091f6989fa462a] [Current]
Feedback Forum

Post a new message
Dataseries X:
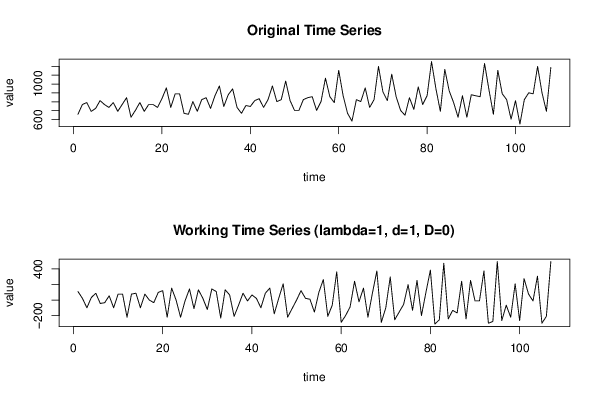
660
770
792
693
726
814
770
737
792
693
770
847
627
704
792
693
770
770
737
836
957
737
891
891
671
660
803
693
825
847
726
869
979
748
880
946
737
671
759
748
814
836
737
825
979
803
825
1034
814
704
704
825
847
858
704
803
1067
858
792
1155
869
671
583
825
803
957
737
825
1199
913
814
1111
858
704
649
847
715
968
770
869
1254
946
693
1166
924
792
627
869
627
880
869
858
1232
935
660
1155
891
825
605
814
550
825
902
891
1199
902
693
1188


Summary of computational transaction
Raw Inputview raw input (R code)
Raw Outputview raw output of R engine
Computing time2 seconds
R Server'Gwilym Jenkins' @ jenkins.wessa.net

\begin{tabular}{lllllllll}
\hline
Summary of computational transaction \tabularnewline
Raw Input & view raw input (R code)  \tabularnewline
Raw Output & view raw output of R engine  \tabularnewline
Computing time & 2 seconds \tabularnewline
R Server & 'Gwilym Jenkins' @ jenkins.wessa.net \tabularnewline
\hline
\end{tabular}
%Source: https://freestatistics.org/blog/index.php?pk=235596&T=0

[TABLE]
[ROW][C]Summary of computational transaction[/C][/ROW]
[ROW][C]Raw Input[/C][C]view raw input (R code) [/C][/ROW]
[ROW][C]Raw Output[/C][C]view raw output of R engine [/C][/ROW]
[ROW][C]Computing time[/C][C]2 seconds[/C][/ROW]
[ROW][C]R Server[/C][C]'Gwilym Jenkins' @ jenkins.wessa.net[/C][/ROW]
[/TABLE]
Source: https://freestatistics.org/blog/index.php?pk=235596&T=0

Globally Unique Identifier (entire table): ba.freestatistics.org/blog/index.php?pk=235596&T=0

As an alternative you can also use a QR Code:  

The GUIDs for individual cells are displayed in the table below:

Summary of computational transaction
Raw Inputview raw input (R code)
Raw Outputview raw output of R engine
Computing time2 seconds
R Server'Gwilym Jenkins' @ jenkins.wessa.net


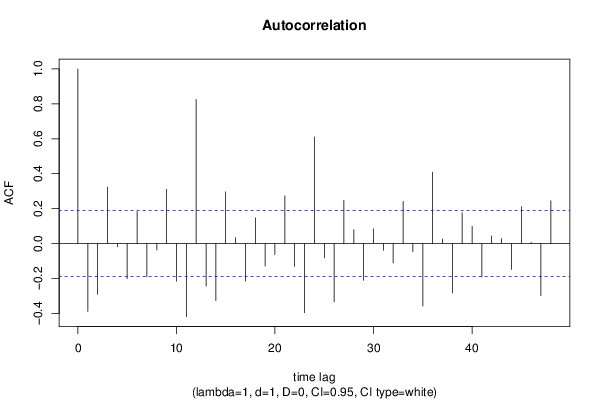
Autocorrelation Function
Time lag kACF(k)T-STATP-value
1-0.388066-4.01425.5e-05
2-0.291053-3.01070.001626
30.3232543.34380.00057
4-0.017877-0.18490.426819
5-0.201768-2.08710.019627
60.1836321.89950.030095
7-0.190129-1.96670.025903
8-0.036951-0.38220.351527
90.3110333.21740.000856
10-0.215859-2.23290.01382
11-0.41842-4.32821.7e-05
120.8247728.53150
13-0.242076-2.50410.006894
14-0.326101-3.37320.000518
150.296093.06280.001387
160.0329990.34130.366757
17-0.214682-2.22070.01424
180.1473341.5240.065225
19-0.128889-1.33320.092643
20-0.062239-0.64380.260538
210.2731422.82540.002818
22-0.131227-1.35740.088752
23-0.395493-4.0914.2e-05
240.6102236.31220
25-0.081403-0.8420.200823
26-0.332754-3.4420.000412
270.247472.55990.005934
280.0798010.82550.20547
29-0.210444-2.17680.015845
300.0841840.87080.192905
31-0.038481-0.3980.345694
32-0.111111-1.14930.126488
330.2413662.49670.00703
34-0.045962-0.47540.317723
35-0.357117-3.6940.000175
360.4090654.23142.5e-05
370.0257680.26650.395168
38-0.28326-2.93010.002072
390.17631.82370.035497
400.0987521.02150.15466
41-0.190688-1.97250.025567
420.043260.44750.327713
430.0296040.30620.380013
44-0.147608-1.52690.064873
450.2107842.18040.01571
460.0061570.06370.47467
47-0.297386-3.07620.001331
480.2445212.52930.006443

\begin{tabular}{lllllllll}
\hline
Autocorrelation Function \tabularnewline
Time lag k & ACF(k) & T-STAT & P-value \tabularnewline
1 & -0.388066 & -4.0142 & 5.5e-05 \tabularnewline
2 & -0.291053 & -3.0107 & 0.001626 \tabularnewline
3 & 0.323254 & 3.3438 & 0.00057 \tabularnewline
4 & -0.017877 & -0.1849 & 0.426819 \tabularnewline
5 & -0.201768 & -2.0871 & 0.019627 \tabularnewline
6 & 0.183632 & 1.8995 & 0.030095 \tabularnewline
7 & -0.190129 & -1.9667 & 0.025903 \tabularnewline
8 & -0.036951 & -0.3822 & 0.351527 \tabularnewline
9 & 0.311033 & 3.2174 & 0.000856 \tabularnewline
10 & -0.215859 & -2.2329 & 0.01382 \tabularnewline
11 & -0.41842 & -4.3282 & 1.7e-05 \tabularnewline
12 & 0.824772 & 8.5315 & 0 \tabularnewline
13 & -0.242076 & -2.5041 & 0.006894 \tabularnewline
14 & -0.326101 & -3.3732 & 0.000518 \tabularnewline
15 & 0.29609 & 3.0628 & 0.001387 \tabularnewline
16 & 0.032999 & 0.3413 & 0.366757 \tabularnewline
17 & -0.214682 & -2.2207 & 0.01424 \tabularnewline
18 & 0.147334 & 1.524 & 0.065225 \tabularnewline
19 & -0.128889 & -1.3332 & 0.092643 \tabularnewline
20 & -0.062239 & -0.6438 & 0.260538 \tabularnewline
21 & 0.273142 & 2.8254 & 0.002818 \tabularnewline
22 & -0.131227 & -1.3574 & 0.088752 \tabularnewline
23 & -0.395493 & -4.091 & 4.2e-05 \tabularnewline
24 & 0.610223 & 6.3122 & 0 \tabularnewline
25 & -0.081403 & -0.842 & 0.200823 \tabularnewline
26 & -0.332754 & -3.442 & 0.000412 \tabularnewline
27 & 0.24747 & 2.5599 & 0.005934 \tabularnewline
28 & 0.079801 & 0.8255 & 0.20547 \tabularnewline
29 & -0.210444 & -2.1768 & 0.015845 \tabularnewline
30 & 0.084184 & 0.8708 & 0.192905 \tabularnewline
31 & -0.038481 & -0.398 & 0.345694 \tabularnewline
32 & -0.111111 & -1.1493 & 0.126488 \tabularnewline
33 & 0.241366 & 2.4967 & 0.00703 \tabularnewline
34 & -0.045962 & -0.4754 & 0.317723 \tabularnewline
35 & -0.357117 & -3.694 & 0.000175 \tabularnewline
36 & 0.409065 & 4.2314 & 2.5e-05 \tabularnewline
37 & 0.025768 & 0.2665 & 0.395168 \tabularnewline
38 & -0.28326 & -2.9301 & 0.002072 \tabularnewline
39 & 0.1763 & 1.8237 & 0.035497 \tabularnewline
40 & 0.098752 & 1.0215 & 0.15466 \tabularnewline
41 & -0.190688 & -1.9725 & 0.025567 \tabularnewline
42 & 0.04326 & 0.4475 & 0.327713 \tabularnewline
43 & 0.029604 & 0.3062 & 0.380013 \tabularnewline
44 & -0.147608 & -1.5269 & 0.064873 \tabularnewline
45 & 0.210784 & 2.1804 & 0.01571 \tabularnewline
46 & 0.006157 & 0.0637 & 0.47467 \tabularnewline
47 & -0.297386 & -3.0762 & 0.001331 \tabularnewline
48 & 0.244521 & 2.5293 & 0.006443 \tabularnewline
\hline
\end{tabular}
%Source: https://freestatistics.org/blog/index.php?pk=235596&T=1

[TABLE]
[ROW][C]Autocorrelation Function[/C][/ROW]
[ROW][C]Time lag k[/C][C]ACF(k)[/C][C]T-STAT[/C][C]P-value[/C][/ROW]
[ROW][C]1[/C][C]-0.388066[/C][C]-4.0142[/C][C]5.5e-05[/C][/ROW]
[ROW][C]2[/C][C]-0.291053[/C][C]-3.0107[/C][C]0.001626[/C][/ROW]
[ROW][C]3[/C][C]0.323254[/C][C]3.3438[/C][C]0.00057[/C][/ROW]
[ROW][C]4[/C][C]-0.017877[/C][C]-0.1849[/C][C]0.426819[/C][/ROW]
[ROW][C]5[/C][C]-0.201768[/C][C]-2.0871[/C][C]0.019627[/C][/ROW]
[ROW][C]6[/C][C]0.183632[/C][C]1.8995[/C][C]0.030095[/C][/ROW]
[ROW][C]7[/C][C]-0.190129[/C][C]-1.9667[/C][C]0.025903[/C][/ROW]
[ROW][C]8[/C][C]-0.036951[/C][C]-0.3822[/C][C]0.351527[/C][/ROW]
[ROW][C]9[/C][C]0.311033[/C][C]3.2174[/C][C]0.000856[/C][/ROW]
[ROW][C]10[/C][C]-0.215859[/C][C]-2.2329[/C][C]0.01382[/C][/ROW]
[ROW][C]11[/C][C]-0.41842[/C][C]-4.3282[/C][C]1.7e-05[/C][/ROW]
[ROW][C]12[/C][C]0.824772[/C][C]8.5315[/C][C]0[/C][/ROW]
[ROW][C]13[/C][C]-0.242076[/C][C]-2.5041[/C][C]0.006894[/C][/ROW]
[ROW][C]14[/C][C]-0.326101[/C][C]-3.3732[/C][C]0.000518[/C][/ROW]
[ROW][C]15[/C][C]0.29609[/C][C]3.0628[/C][C]0.001387[/C][/ROW]
[ROW][C]16[/C][C]0.032999[/C][C]0.3413[/C][C]0.366757[/C][/ROW]
[ROW][C]17[/C][C]-0.214682[/C][C]-2.2207[/C][C]0.01424[/C][/ROW]
[ROW][C]18[/C][C]0.147334[/C][C]1.524[/C][C]0.065225[/C][/ROW]
[ROW][C]19[/C][C]-0.128889[/C][C]-1.3332[/C][C]0.092643[/C][/ROW]
[ROW][C]20[/C][C]-0.062239[/C][C]-0.6438[/C][C]0.260538[/C][/ROW]
[ROW][C]21[/C][C]0.273142[/C][C]2.8254[/C][C]0.002818[/C][/ROW]
[ROW][C]22[/C][C]-0.131227[/C][C]-1.3574[/C][C]0.088752[/C][/ROW]
[ROW][C]23[/C][C]-0.395493[/C][C]-4.091[/C][C]4.2e-05[/C][/ROW]
[ROW][C]24[/C][C]0.610223[/C][C]6.3122[/C][C]0[/C][/ROW]
[ROW][C]25[/C][C]-0.081403[/C][C]-0.842[/C][C]0.200823[/C][/ROW]
[ROW][C]26[/C][C]-0.332754[/C][C]-3.442[/C][C]0.000412[/C][/ROW]
[ROW][C]27[/C][C]0.24747[/C][C]2.5599[/C][C]0.005934[/C][/ROW]
[ROW][C]28[/C][C]0.079801[/C][C]0.8255[/C][C]0.20547[/C][/ROW]
[ROW][C]29[/C][C]-0.210444[/C][C]-2.1768[/C][C]0.015845[/C][/ROW]
[ROW][C]30[/C][C]0.084184[/C][C]0.8708[/C][C]0.192905[/C][/ROW]
[ROW][C]31[/C][C]-0.038481[/C][C]-0.398[/C][C]0.345694[/C][/ROW]
[ROW][C]32[/C][C]-0.111111[/C][C]-1.1493[/C][C]0.126488[/C][/ROW]
[ROW][C]33[/C][C]0.241366[/C][C]2.4967[/C][C]0.00703[/C][/ROW]
[ROW][C]34[/C][C]-0.045962[/C][C]-0.4754[/C][C]0.317723[/C][/ROW]
[ROW][C]35[/C][C]-0.357117[/C][C]-3.694[/C][C]0.000175[/C][/ROW]
[ROW][C]36[/C][C]0.409065[/C][C]4.2314[/C][C]2.5e-05[/C][/ROW]
[ROW][C]37[/C][C]0.025768[/C][C]0.2665[/C][C]0.395168[/C][/ROW]
[ROW][C]38[/C][C]-0.28326[/C][C]-2.9301[/C][C]0.002072[/C][/ROW]
[ROW][C]39[/C][C]0.1763[/C][C]1.8237[/C][C]0.035497[/C][/ROW]
[ROW][C]40[/C][C]0.098752[/C][C]1.0215[/C][C]0.15466[/C][/ROW]
[ROW][C]41[/C][C]-0.190688[/C][C]-1.9725[/C][C]0.025567[/C][/ROW]
[ROW][C]42[/C][C]0.04326[/C][C]0.4475[/C][C]0.327713[/C][/ROW]
[ROW][C]43[/C][C]0.029604[/C][C]0.3062[/C][C]0.380013[/C][/ROW]
[ROW][C]44[/C][C]-0.147608[/C][C]-1.5269[/C][C]0.064873[/C][/ROW]
[ROW][C]45[/C][C]0.210784[/C][C]2.1804[/C][C]0.01571[/C][/ROW]
[ROW][C]46[/C][C]0.006157[/C][C]0.0637[/C][C]0.47467[/C][/ROW]
[ROW][C]47[/C][C]-0.297386[/C][C]-3.0762[/C][C]0.001331[/C][/ROW]
[ROW][C]48[/C][C]0.244521[/C][C]2.5293[/C][C]0.006443[/C][/ROW]
[/TABLE]
Source: https://freestatistics.org/blog/index.php?pk=235596&T=1

Globally Unique Identifier (entire table): ba.freestatistics.org/blog/index.php?pk=235596&T=1

As an alternative you can also use a QR Code:  

The GUIDs for individual cells are displayed in the table below:

Autocorrelation Function
Time lag kACF(k)T-STATP-value
1-0.388066-4.01425.5e-05
2-0.291053-3.01070.001626
30.3232543.34380.00057
4-0.017877-0.18490.426819
5-0.201768-2.08710.019627
60.1836321.89950.030095
7-0.190129-1.96670.025903
8-0.036951-0.38220.351527
90.3110333.21740.000856
10-0.215859-2.23290.01382
11-0.41842-4.32821.7e-05
120.8247728.53150
13-0.242076-2.50410.006894
14-0.326101-3.37320.000518
150.296093.06280.001387
160.0329990.34130.366757
17-0.214682-2.22070.01424
180.1473341.5240.065225
19-0.128889-1.33320.092643
20-0.062239-0.64380.260538
210.2731422.82540.002818
22-0.131227-1.35740.088752
23-0.395493-4.0914.2e-05
240.6102236.31220
25-0.081403-0.8420.200823
26-0.332754-3.4420.000412
270.247472.55990.005934
280.0798010.82550.20547
29-0.210444-2.17680.015845
300.0841840.87080.192905
31-0.038481-0.3980.345694
32-0.111111-1.14930.126488
330.2413662.49670.00703
34-0.045962-0.47540.317723
35-0.357117-3.6940.000175
360.4090654.23142.5e-05
370.0257680.26650.395168
38-0.28326-2.93010.002072
390.17631.82370.035497
400.0987521.02150.15466
41-0.190688-1.97250.025567
420.043260.44750.327713
430.0296040.30620.380013
44-0.147608-1.52690.064873
450.2107842.18040.01571
460.0061570.06370.47467
47-0.297386-3.07620.001331
480.2445212.52930.006443


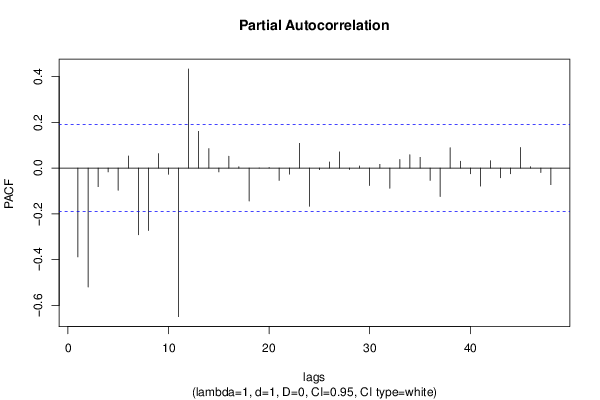
Partial Autocorrelation Function
Time lag kPACF(k)T-STATP-value
1-0.388066-4.01425.5e-05
2-0.51995-5.37840
3-0.080993-0.83780.202007
4-0.01667-0.17240.431709
5-0.09686-1.00190.15932
60.0531590.54990.291775
7-0.291069-3.01080.001625
8-0.272553-2.81930.002868
90.0634310.65610.256573
10-0.027179-0.28110.389571
11-0.649217-6.71560
120.4332854.48199e-06
130.1605531.66080.049844
140.085190.88120.190089
15-0.01652-0.17090.432317
160.0519230.53710.296158
170.0057160.05910.476482
18-0.143691-1.48640.070063
190.000250.00260.498972
200.0008840.00910.49636
21-0.053706-0.55550.289841
22-0.026428-0.27340.392546
230.1079461.11660.133334
24-0.16647-1.7220.043981
25-0.006808-0.07040.471995
260.0266370.27550.391719
270.0707570.73190.232909
28-0.006105-0.06320.47488
290.0095010.09830.460947
30-0.076324-0.78950.215781
310.0162450.1680.433436
32-0.08777-0.90790.182985
330.0379070.39210.347877
340.0583940.6040.273549
350.0470220.48640.313839
36-0.053645-0.55490.290058
37-0.124371-1.28650.100521
380.0891170.92180.179343
390.0303190.31360.37721
40-0.025018-0.25880.398147
41-0.078693-0.8140.208725
420.0318150.32910.371362
43-0.042251-0.43710.331478
44-0.025076-0.25940.397917
450.0897130.9280.177749
460.0058350.06040.47599
47-0.01957-0.20240.419982
48-0.072309-0.7480.228058

\begin{tabular}{lllllllll}
\hline
Partial Autocorrelation Function \tabularnewline
Time lag k & PACF(k) & T-STAT & P-value \tabularnewline
1 & -0.388066 & -4.0142 & 5.5e-05 \tabularnewline
2 & -0.51995 & -5.3784 & 0 \tabularnewline
3 & -0.080993 & -0.8378 & 0.202007 \tabularnewline
4 & -0.01667 & -0.1724 & 0.431709 \tabularnewline
5 & -0.09686 & -1.0019 & 0.15932 \tabularnewline
6 & 0.053159 & 0.5499 & 0.291775 \tabularnewline
7 & -0.291069 & -3.0108 & 0.001625 \tabularnewline
8 & -0.272553 & -2.8193 & 0.002868 \tabularnewline
9 & 0.063431 & 0.6561 & 0.256573 \tabularnewline
10 & -0.027179 & -0.2811 & 0.389571 \tabularnewline
11 & -0.649217 & -6.7156 & 0 \tabularnewline
12 & 0.433285 & 4.4819 & 9e-06 \tabularnewline
13 & 0.160553 & 1.6608 & 0.049844 \tabularnewline
14 & 0.08519 & 0.8812 & 0.190089 \tabularnewline
15 & -0.01652 & -0.1709 & 0.432317 \tabularnewline
16 & 0.051923 & 0.5371 & 0.296158 \tabularnewline
17 & 0.005716 & 0.0591 & 0.476482 \tabularnewline
18 & -0.143691 & -1.4864 & 0.070063 \tabularnewline
19 & 0.00025 & 0.0026 & 0.498972 \tabularnewline
20 & 0.000884 & 0.0091 & 0.49636 \tabularnewline
21 & -0.053706 & -0.5555 & 0.289841 \tabularnewline
22 & -0.026428 & -0.2734 & 0.392546 \tabularnewline
23 & 0.107946 & 1.1166 & 0.133334 \tabularnewline
24 & -0.16647 & -1.722 & 0.043981 \tabularnewline
25 & -0.006808 & -0.0704 & 0.471995 \tabularnewline
26 & 0.026637 & 0.2755 & 0.391719 \tabularnewline
27 & 0.070757 & 0.7319 & 0.232909 \tabularnewline
28 & -0.006105 & -0.0632 & 0.47488 \tabularnewline
29 & 0.009501 & 0.0983 & 0.460947 \tabularnewline
30 & -0.076324 & -0.7895 & 0.215781 \tabularnewline
31 & 0.016245 & 0.168 & 0.433436 \tabularnewline
32 & -0.08777 & -0.9079 & 0.182985 \tabularnewline
33 & 0.037907 & 0.3921 & 0.347877 \tabularnewline
34 & 0.058394 & 0.604 & 0.273549 \tabularnewline
35 & 0.047022 & 0.4864 & 0.313839 \tabularnewline
36 & -0.053645 & -0.5549 & 0.290058 \tabularnewline
37 & -0.124371 & -1.2865 & 0.100521 \tabularnewline
38 & 0.089117 & 0.9218 & 0.179343 \tabularnewline
39 & 0.030319 & 0.3136 & 0.37721 \tabularnewline
40 & -0.025018 & -0.2588 & 0.398147 \tabularnewline
41 & -0.078693 & -0.814 & 0.208725 \tabularnewline
42 & 0.031815 & 0.3291 & 0.371362 \tabularnewline
43 & -0.042251 & -0.4371 & 0.331478 \tabularnewline
44 & -0.025076 & -0.2594 & 0.397917 \tabularnewline
45 & 0.089713 & 0.928 & 0.177749 \tabularnewline
46 & 0.005835 & 0.0604 & 0.47599 \tabularnewline
47 & -0.01957 & -0.2024 & 0.419982 \tabularnewline
48 & -0.072309 & -0.748 & 0.228058 \tabularnewline
\hline
\end{tabular}
%Source: https://freestatistics.org/blog/index.php?pk=235596&T=2

[TABLE]
[ROW][C]Partial Autocorrelation Function[/C][/ROW]
[ROW][C]Time lag k[/C][C]PACF(k)[/C][C]T-STAT[/C][C]P-value[/C][/ROW]
[ROW][C]1[/C][C]-0.388066[/C][C]-4.0142[/C][C]5.5e-05[/C][/ROW]
[ROW][C]2[/C][C]-0.51995[/C][C]-5.3784[/C][C]0[/C][/ROW]
[ROW][C]3[/C][C]-0.080993[/C][C]-0.8378[/C][C]0.202007[/C][/ROW]
[ROW][C]4[/C][C]-0.01667[/C][C]-0.1724[/C][C]0.431709[/C][/ROW]
[ROW][C]5[/C][C]-0.09686[/C][C]-1.0019[/C][C]0.15932[/C][/ROW]
[ROW][C]6[/C][C]0.053159[/C][C]0.5499[/C][C]0.291775[/C][/ROW]
[ROW][C]7[/C][C]-0.291069[/C][C]-3.0108[/C][C]0.001625[/C][/ROW]
[ROW][C]8[/C][C]-0.272553[/C][C]-2.8193[/C][C]0.002868[/C][/ROW]
[ROW][C]9[/C][C]0.063431[/C][C]0.6561[/C][C]0.256573[/C][/ROW]
[ROW][C]10[/C][C]-0.027179[/C][C]-0.2811[/C][C]0.389571[/C][/ROW]
[ROW][C]11[/C][C]-0.649217[/C][C]-6.7156[/C][C]0[/C][/ROW]
[ROW][C]12[/C][C]0.433285[/C][C]4.4819[/C][C]9e-06[/C][/ROW]
[ROW][C]13[/C][C]0.160553[/C][C]1.6608[/C][C]0.049844[/C][/ROW]
[ROW][C]14[/C][C]0.08519[/C][C]0.8812[/C][C]0.190089[/C][/ROW]
[ROW][C]15[/C][C]-0.01652[/C][C]-0.1709[/C][C]0.432317[/C][/ROW]
[ROW][C]16[/C][C]0.051923[/C][C]0.5371[/C][C]0.296158[/C][/ROW]
[ROW][C]17[/C][C]0.005716[/C][C]0.0591[/C][C]0.476482[/C][/ROW]
[ROW][C]18[/C][C]-0.143691[/C][C]-1.4864[/C][C]0.070063[/C][/ROW]
[ROW][C]19[/C][C]0.00025[/C][C]0.0026[/C][C]0.498972[/C][/ROW]
[ROW][C]20[/C][C]0.000884[/C][C]0.0091[/C][C]0.49636[/C][/ROW]
[ROW][C]21[/C][C]-0.053706[/C][C]-0.5555[/C][C]0.289841[/C][/ROW]
[ROW][C]22[/C][C]-0.026428[/C][C]-0.2734[/C][C]0.392546[/C][/ROW]
[ROW][C]23[/C][C]0.107946[/C][C]1.1166[/C][C]0.133334[/C][/ROW]
[ROW][C]24[/C][C]-0.16647[/C][C]-1.722[/C][C]0.043981[/C][/ROW]
[ROW][C]25[/C][C]-0.006808[/C][C]-0.0704[/C][C]0.471995[/C][/ROW]
[ROW][C]26[/C][C]0.026637[/C][C]0.2755[/C][C]0.391719[/C][/ROW]
[ROW][C]27[/C][C]0.070757[/C][C]0.7319[/C][C]0.232909[/C][/ROW]
[ROW][C]28[/C][C]-0.006105[/C][C]-0.0632[/C][C]0.47488[/C][/ROW]
[ROW][C]29[/C][C]0.009501[/C][C]0.0983[/C][C]0.460947[/C][/ROW]
[ROW][C]30[/C][C]-0.076324[/C][C]-0.7895[/C][C]0.215781[/C][/ROW]
[ROW][C]31[/C][C]0.016245[/C][C]0.168[/C][C]0.433436[/C][/ROW]
[ROW][C]32[/C][C]-0.08777[/C][C]-0.9079[/C][C]0.182985[/C][/ROW]
[ROW][C]33[/C][C]0.037907[/C][C]0.3921[/C][C]0.347877[/C][/ROW]
[ROW][C]34[/C][C]0.058394[/C][C]0.604[/C][C]0.273549[/C][/ROW]
[ROW][C]35[/C][C]0.047022[/C][C]0.4864[/C][C]0.313839[/C][/ROW]
[ROW][C]36[/C][C]-0.053645[/C][C]-0.5549[/C][C]0.290058[/C][/ROW]
[ROW][C]37[/C][C]-0.124371[/C][C]-1.2865[/C][C]0.100521[/C][/ROW]
[ROW][C]38[/C][C]0.089117[/C][C]0.9218[/C][C]0.179343[/C][/ROW]
[ROW][C]39[/C][C]0.030319[/C][C]0.3136[/C][C]0.37721[/C][/ROW]
[ROW][C]40[/C][C]-0.025018[/C][C]-0.2588[/C][C]0.398147[/C][/ROW]
[ROW][C]41[/C][C]-0.078693[/C][C]-0.814[/C][C]0.208725[/C][/ROW]
[ROW][C]42[/C][C]0.031815[/C][C]0.3291[/C][C]0.371362[/C][/ROW]
[ROW][C]43[/C][C]-0.042251[/C][C]-0.4371[/C][C]0.331478[/C][/ROW]
[ROW][C]44[/C][C]-0.025076[/C][C]-0.2594[/C][C]0.397917[/C][/ROW]
[ROW][C]45[/C][C]0.089713[/C][C]0.928[/C][C]0.177749[/C][/ROW]
[ROW][C]46[/C][C]0.005835[/C][C]0.0604[/C][C]0.47599[/C][/ROW]
[ROW][C]47[/C][C]-0.01957[/C][C]-0.2024[/C][C]0.419982[/C][/ROW]
[ROW][C]48[/C][C]-0.072309[/C][C]-0.748[/C][C]0.228058[/C][/ROW]
[/TABLE]
Source: https://freestatistics.org/blog/index.php?pk=235596&T=2

Globally Unique Identifier (entire table): ba.freestatistics.org/blog/index.php?pk=235596&T=2

As an alternative you can also use a QR Code:  

The GUIDs for individual cells are displayed in the table below:

Partial Autocorrelation Function
Time lag kPACF(k)T-STATP-value
1-0.388066-4.01425.5e-05
2-0.51995-5.37840
3-0.080993-0.83780.202007
4-0.01667-0.17240.431709
5-0.09686-1.00190.15932
60.0531590.54990.291775
7-0.291069-3.01080.001625
8-0.272553-2.81930.002868
90.0634310.65610.256573
10-0.027179-0.28110.389571
11-0.649217-6.71560
120.4332854.48199e-06
130.1605531.66080.049844
140.085190.88120.190089
15-0.01652-0.17090.432317
160.0519230.53710.296158
170.0057160.05910.476482
18-0.143691-1.48640.070063
190.000250.00260.498972
200.0008840.00910.49636
21-0.053706-0.55550.289841
22-0.026428-0.27340.392546
230.1079461.11660.133334
24-0.16647-1.7220.043981
25-0.006808-0.07040.471995
260.0266370.27550.391719
270.0707570.73190.232909
28-0.006105-0.06320.47488
290.0095010.09830.460947
30-0.076324-0.78950.215781
310.0162450.1680.433436
32-0.08777-0.90790.182985
330.0379070.39210.347877
340.0583940.6040.273549
350.0470220.48640.313839
36-0.053645-0.55490.290058
37-0.124371-1.28650.100521
380.0891170.92180.179343
390.0303190.31360.37721
40-0.025018-0.25880.398147
41-0.078693-0.8140.208725
420.0318150.32910.371362
43-0.042251-0.43710.331478
44-0.025076-0.25940.397917
450.0897130.9280.177749
460.0058350.06040.47599
47-0.01957-0.20240.419982
48-0.072309-0.7480.228058


Parameters (Session):
par1 = 48 ; par2 = 1 ; par3 = 1 ; par4 = 0 ; par5 = 12 ; par6 = White Noise ; par7 = 0.95 ;
Parameters (R input):
par1 = 48 ; par2 = 1 ; par3 = 1 ; par4 = 0 ; par5 = 12 ; par6 = White Noise ; par7 = 0.95 ; par8 = ;
R code (references can be found in the software module):
par8 <- ''
par7 <- '0.95'
par6 <- 'White Noise'
par5 <- '12'
par4 <- '0'
par3 <- '0'
par2 <- '1'
par1 <- '48'
if (par1 == 'Default') {
par1 = 10*log10(length(x))
} else {
par1 <- as.numeric(par1)
}
par2 <- as.numeric(par2)
par3 <- as.numeric(par3)
par4 <- as.numeric(par4)
par5 <- as.numeric(par5)
if (par6 == 'White Noise') par6 <- 'white' else par6 <- 'ma'
par7 <- as.numeric(par7)
if (par8 != '') par8 <- as.numeric(par8)
ox <- x
if (par8 == '') {
if (par2 == 0) {
x <- log(x)
} else {
x <- (x ^ par2 - 1) / par2
}
} else {
x <- log(x,base=par8)
}
if (par3 > 0) x <- diff(x,lag=1,difference=par3)
if (par4 > 0) x <- diff(x,lag=par5,difference=par4)
bitmap(file='picts.png')
op <- par(mfrow=c(2,1))
plot(ox,type='l',main='Original Time Series',xlab='time',ylab='value')
if (par8=='') {
mytitle <- paste('Working Time Series (lambda=',par2,', d=',par3,', D=',par4,')',sep='')
mysub <- paste('(lambda=',par2,', d=',par3,', D=',par4,', CI=', par7, ', CI type=',par6,')',sep='')
} else {
mytitle <- paste('Working Time Series (base=',par8,', d=',par3,', D=',par4,')',sep='')
mysub <- paste('(base=',par8,', d=',par3,', D=',par4,', CI=', par7, ', CI type=',par6,')',sep='')
}
plot(x,type='l', main=mytitle,xlab='time',ylab='value')
par(op)
dev.off()
bitmap(file='pic1.png')
racf <- acf(x, par1, main='Autocorrelation', xlab='time lag', ylab='ACF', ci.type=par6, ci=par7, sub=mysub)
dev.off()
bitmap(file='pic2.png')
rpacf <- pacf(x,par1,main='Partial Autocorrelation',xlab='lags',ylab='PACF',sub=mysub)
dev.off()
(myacf <- c(racf$acf))
(mypacf <- c(rpacf$acf))
lengthx <- length(x)
sqrtn <- sqrt(lengthx)
load(file='createtable')
a<-table.start()
a<-table.row.start(a)
a<-table.element(a,'Autocorrelation Function',4,TRUE)
a<-table.row.end(a)
a<-table.row.start(a)
a<-table.element(a,'Time lag k',header=TRUE)
a<-table.element(a,hyperlink('basics.htm','ACF(k)','click here for more information about the Autocorrelation Function'),header=TRUE)
a<-table.element(a,'T-STAT',header=TRUE)
a<-table.element(a,'P-value',header=TRUE)
a<-table.row.end(a)
for (i in 2:(par1+1)) {
a<-table.row.start(a)
a<-table.element(a,i-1,header=TRUE)
a<-table.element(a,round(myacf[i],6))
mytstat <- myacf[i]*sqrtn
a<-table.element(a,round(mytstat,4))
a<-table.element(a,round(1-pt(abs(mytstat),lengthx),6))
a<-table.row.end(a)
}
a<-table.end(a)
table.save(a,file='mytable.tab')
a<-table.start()
a<-table.row.start(a)
a<-table.element(a,'Partial Autocorrelation Function',4,TRUE)
a<-table.row.end(a)
a<-table.row.start(a)
a<-table.element(a,'Time lag k',header=TRUE)
a<-table.element(a,hyperlink('basics.htm','PACF(k)','click here for more information about the Partial Autocorrelation Function'),header=TRUE)
a<-table.element(a,'T-STAT',header=TRUE)
a<-table.element(a,'P-value',header=TRUE)
a<-table.row.end(a)
for (i in 1:par1) {
a<-table.row.start(a)
a<-table.element(a,i,header=TRUE)
a<-table.element(a,round(mypacf[i],6))
mytstat <- mypacf[i]*sqrtn
a<-table.element(a,round(mytstat,4))
a<-table.element(a,round(1-pt(abs(mytstat),lengthx),6))
a<-table.row.end(a)
}
a<-table.end(a)
table.save(a,file='mytable1.tab')