Free Statistics

of Irreproducible Research!

Author's title

Author*Unverified author*
R Software Modulerwasp_autocorrelation.wasp
Title produced by software(Partial) Autocorrelation Function
Date of computationSun, 17 Aug 2014 12:26:29 +0100
Cite this page as followsStatistical Computations at FreeStatistics.org, Office for Research Development and Education, URL https://freestatistics.org/blog/index.php?v=date/2014/Aug/17/t1408274890vsrr9zak2rtsqzy.htm/, Retrieved Thu, 16 May 2024 15:27:30 +0000
Statistical Computations at FreeStatistics.org, Office for Research Development and Education, URL https://freestatistics.org/blog/index.php?pk=235611, Retrieved Thu, 16 May 2024 15:27:30 +0000
QR Codes:

Original text written by user:
IsPrivate?No (this computation is public)
User-defined keywordsBoeykens Brice
Estimated Impact105
Family? (F = Feedback message, R = changed R code, M = changed R Module, P = changed Parameters, D = changed Data)
-     [Exponential Smoothing] [Tijdreeks B Stap 27] [2014-08-14 15:31:10] [2064a7ed2562130dd70fccaf2dd61d5a]
- RMP     [(Partial) Autocorrelation Function] [Tijdreeks B Stap 18] [2014-08-17 11:26:29] [7314f5de623f4497f735e8af2050bf2f] [Current]
Feedback Forum

Post a new message
Dataseries X:
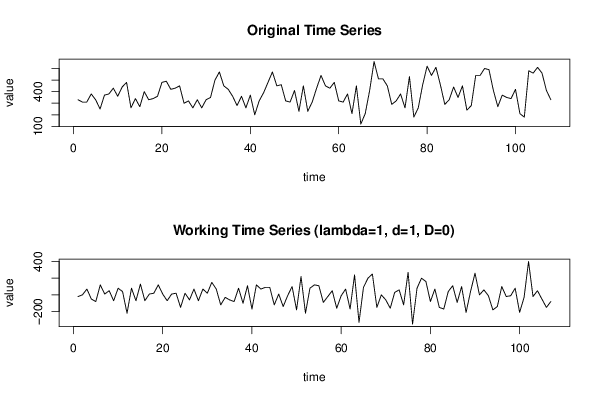
330
310
310
380
330
250
370
380
430
360
440
480
260
340
270
400
330
340
360
480
490
420
430
450
300
320
260
330
260
330
350
500
570
450
420
360
280
360
260
370
200
320
390
480
570
450
460
320
310
410
230
450
230
310
430
540
450
430
480
320
310
380
210
450
120
210
410
660
510
510
450
290
320
380
260
530
180
260
460
620
540
610
460
290
330
440
350
450
240
280
540
540
600
590
410
270
370
350
340
420
210
180
580
560
610
560
410
330


Summary of computational transaction
Raw Inputview raw input (R code)
Raw Outputview raw output of R engine
Computing time2 seconds
R Server'Gertrude Mary Cox' @ cox.wessa.net

\begin{tabular}{lllllllll}
\hline
Summary of computational transaction \tabularnewline
Raw Input & view raw input (R code)  \tabularnewline
Raw Output & view raw output of R engine  \tabularnewline
Computing time & 2 seconds \tabularnewline
R Server & 'Gertrude Mary Cox' @ cox.wessa.net \tabularnewline
\hline
\end{tabular}
%Source: https://freestatistics.org/blog/index.php?pk=235611&T=0

[TABLE]
[ROW][C]Summary of computational transaction[/C][/ROW]
[ROW][C]Raw Input[/C][C]view raw input (R code) [/C][/ROW]
[ROW][C]Raw Output[/C][C]view raw output of R engine [/C][/ROW]
[ROW][C]Computing time[/C][C]2 seconds[/C][/ROW]
[ROW][C]R Server[/C][C]'Gertrude Mary Cox' @ cox.wessa.net[/C][/ROW]
[/TABLE]
Source: https://freestatistics.org/blog/index.php?pk=235611&T=0

Globally Unique Identifier (entire table): ba.freestatistics.org/blog/index.php?pk=235611&T=0

As an alternative you can also use a QR Code:  

The GUIDs for individual cells are displayed in the table below:

Summary of computational transaction
Raw Inputview raw input (R code)
Raw Outputview raw output of R engine
Computing time2 seconds
R Server'Gertrude Mary Cox' @ cox.wessa.net


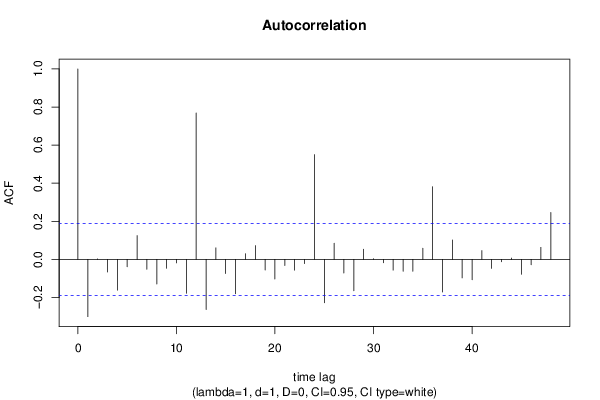
Autocorrelation Function
Time lag kACF(k)T-STATP-value
1-0.300779-3.11130.001194
20.0025220.02610.489619
3-0.065967-0.68240.248239
4-0.161566-1.67120.048797
5-0.038686-0.40020.344913
60.1249431.29240.099498
7-0.051811-0.53590.296557
8-0.129642-1.3410.091375
9-0.046596-0.4820.315399
10-0.018512-0.19150.424252
11-0.178129-1.84260.034079
120.7690857.95550
13-0.26301-2.72060.003804
140.0602930.62370.267082
15-0.074622-0.77190.22094
16-0.180651-1.86870.032202
170.0291720.30180.38171
180.0722150.7470.228353
19-0.056052-0.57980.281631
20-0.103278-1.06830.14389
21-0.032439-0.33560.368932
22-0.056568-0.58510.279841
23-0.02218-0.22940.409485
240.5501495.69080
25-0.228049-2.3590.010071
260.0845940.8750.191753
27-0.071756-0.74230.229781
28-0.164489-1.70150.045878
290.0536450.55490.290057
300.0033240.03440.486317
31-0.017824-0.18440.427033
32-0.056568-0.58510.279841
33-0.062127-0.64270.260912
34-0.062643-0.6480.259191
350.0588030.60830.27215
360.3813623.94487.2e-05
37-0.17108-1.76970.039816
380.1016161.05110.147784
39-0.097088-1.00430.158752
40-0.107118-1.1080.135164
410.0461370.47720.31708
42-0.047398-0.49030.312467
43-0.012494-0.12920.448705
440.006820.07050.471944
45-0.077774-0.80450.211446
46-0.027912-0.28870.386678
470.0632160.65390.257285
480.2462752.54750.006136

\begin{tabular}{lllllllll}
\hline
Autocorrelation Function \tabularnewline
Time lag k & ACF(k) & T-STAT & P-value \tabularnewline
1 & -0.300779 & -3.1113 & 0.001194 \tabularnewline
2 & 0.002522 & 0.0261 & 0.489619 \tabularnewline
3 & -0.065967 & -0.6824 & 0.248239 \tabularnewline
4 & -0.161566 & -1.6712 & 0.048797 \tabularnewline
5 & -0.038686 & -0.4002 & 0.344913 \tabularnewline
6 & 0.124943 & 1.2924 & 0.099498 \tabularnewline
7 & -0.051811 & -0.5359 & 0.296557 \tabularnewline
8 & -0.129642 & -1.341 & 0.091375 \tabularnewline
9 & -0.046596 & -0.482 & 0.315399 \tabularnewline
10 & -0.018512 & -0.1915 & 0.424252 \tabularnewline
11 & -0.178129 & -1.8426 & 0.034079 \tabularnewline
12 & 0.769085 & 7.9555 & 0 \tabularnewline
13 & -0.26301 & -2.7206 & 0.003804 \tabularnewline
14 & 0.060293 & 0.6237 & 0.267082 \tabularnewline
15 & -0.074622 & -0.7719 & 0.22094 \tabularnewline
16 & -0.180651 & -1.8687 & 0.032202 \tabularnewline
17 & 0.029172 & 0.3018 & 0.38171 \tabularnewline
18 & 0.072215 & 0.747 & 0.228353 \tabularnewline
19 & -0.056052 & -0.5798 & 0.281631 \tabularnewline
20 & -0.103278 & -1.0683 & 0.14389 \tabularnewline
21 & -0.032439 & -0.3356 & 0.368932 \tabularnewline
22 & -0.056568 & -0.5851 & 0.279841 \tabularnewline
23 & -0.02218 & -0.2294 & 0.409485 \tabularnewline
24 & 0.550149 & 5.6908 & 0 \tabularnewline
25 & -0.228049 & -2.359 & 0.010071 \tabularnewline
26 & 0.084594 & 0.875 & 0.191753 \tabularnewline
27 & -0.071756 & -0.7423 & 0.229781 \tabularnewline
28 & -0.164489 & -1.7015 & 0.045878 \tabularnewline
29 & 0.053645 & 0.5549 & 0.290057 \tabularnewline
30 & 0.003324 & 0.0344 & 0.486317 \tabularnewline
31 & -0.017824 & -0.1844 & 0.427033 \tabularnewline
32 & -0.056568 & -0.5851 & 0.279841 \tabularnewline
33 & -0.062127 & -0.6427 & 0.260912 \tabularnewline
34 & -0.062643 & -0.648 & 0.259191 \tabularnewline
35 & 0.058803 & 0.6083 & 0.27215 \tabularnewline
36 & 0.381362 & 3.9448 & 7.2e-05 \tabularnewline
37 & -0.17108 & -1.7697 & 0.039816 \tabularnewline
38 & 0.101616 & 1.0511 & 0.147784 \tabularnewline
39 & -0.097088 & -1.0043 & 0.158752 \tabularnewline
40 & -0.107118 & -1.108 & 0.135164 \tabularnewline
41 & 0.046137 & 0.4772 & 0.31708 \tabularnewline
42 & -0.047398 & -0.4903 & 0.312467 \tabularnewline
43 & -0.012494 & -0.1292 & 0.448705 \tabularnewline
44 & 0.00682 & 0.0705 & 0.471944 \tabularnewline
45 & -0.077774 & -0.8045 & 0.211446 \tabularnewline
46 & -0.027912 & -0.2887 & 0.386678 \tabularnewline
47 & 0.063216 & 0.6539 & 0.257285 \tabularnewline
48 & 0.246275 & 2.5475 & 0.006136 \tabularnewline
\hline
\end{tabular}
%Source: https://freestatistics.org/blog/index.php?pk=235611&T=1

[TABLE]
[ROW][C]Autocorrelation Function[/C][/ROW]
[ROW][C]Time lag k[/C][C]ACF(k)[/C][C]T-STAT[/C][C]P-value[/C][/ROW]
[ROW][C]1[/C][C]-0.300779[/C][C]-3.1113[/C][C]0.001194[/C][/ROW]
[ROW][C]2[/C][C]0.002522[/C][C]0.0261[/C][C]0.489619[/C][/ROW]
[ROW][C]3[/C][C]-0.065967[/C][C]-0.6824[/C][C]0.248239[/C][/ROW]
[ROW][C]4[/C][C]-0.161566[/C][C]-1.6712[/C][C]0.048797[/C][/ROW]
[ROW][C]5[/C][C]-0.038686[/C][C]-0.4002[/C][C]0.344913[/C][/ROW]
[ROW][C]6[/C][C]0.124943[/C][C]1.2924[/C][C]0.099498[/C][/ROW]
[ROW][C]7[/C][C]-0.051811[/C][C]-0.5359[/C][C]0.296557[/C][/ROW]
[ROW][C]8[/C][C]-0.129642[/C][C]-1.341[/C][C]0.091375[/C][/ROW]
[ROW][C]9[/C][C]-0.046596[/C][C]-0.482[/C][C]0.315399[/C][/ROW]
[ROW][C]10[/C][C]-0.018512[/C][C]-0.1915[/C][C]0.424252[/C][/ROW]
[ROW][C]11[/C][C]-0.178129[/C][C]-1.8426[/C][C]0.034079[/C][/ROW]
[ROW][C]12[/C][C]0.769085[/C][C]7.9555[/C][C]0[/C][/ROW]
[ROW][C]13[/C][C]-0.26301[/C][C]-2.7206[/C][C]0.003804[/C][/ROW]
[ROW][C]14[/C][C]0.060293[/C][C]0.6237[/C][C]0.267082[/C][/ROW]
[ROW][C]15[/C][C]-0.074622[/C][C]-0.7719[/C][C]0.22094[/C][/ROW]
[ROW][C]16[/C][C]-0.180651[/C][C]-1.8687[/C][C]0.032202[/C][/ROW]
[ROW][C]17[/C][C]0.029172[/C][C]0.3018[/C][C]0.38171[/C][/ROW]
[ROW][C]18[/C][C]0.072215[/C][C]0.747[/C][C]0.228353[/C][/ROW]
[ROW][C]19[/C][C]-0.056052[/C][C]-0.5798[/C][C]0.281631[/C][/ROW]
[ROW][C]20[/C][C]-0.103278[/C][C]-1.0683[/C][C]0.14389[/C][/ROW]
[ROW][C]21[/C][C]-0.032439[/C][C]-0.3356[/C][C]0.368932[/C][/ROW]
[ROW][C]22[/C][C]-0.056568[/C][C]-0.5851[/C][C]0.279841[/C][/ROW]
[ROW][C]23[/C][C]-0.02218[/C][C]-0.2294[/C][C]0.409485[/C][/ROW]
[ROW][C]24[/C][C]0.550149[/C][C]5.6908[/C][C]0[/C][/ROW]
[ROW][C]25[/C][C]-0.228049[/C][C]-2.359[/C][C]0.010071[/C][/ROW]
[ROW][C]26[/C][C]0.084594[/C][C]0.875[/C][C]0.191753[/C][/ROW]
[ROW][C]27[/C][C]-0.071756[/C][C]-0.7423[/C][C]0.229781[/C][/ROW]
[ROW][C]28[/C][C]-0.164489[/C][C]-1.7015[/C][C]0.045878[/C][/ROW]
[ROW][C]29[/C][C]0.053645[/C][C]0.5549[/C][C]0.290057[/C][/ROW]
[ROW][C]30[/C][C]0.003324[/C][C]0.0344[/C][C]0.486317[/C][/ROW]
[ROW][C]31[/C][C]-0.017824[/C][C]-0.1844[/C][C]0.427033[/C][/ROW]
[ROW][C]32[/C][C]-0.056568[/C][C]-0.5851[/C][C]0.279841[/C][/ROW]
[ROW][C]33[/C][C]-0.062127[/C][C]-0.6427[/C][C]0.260912[/C][/ROW]
[ROW][C]34[/C][C]-0.062643[/C][C]-0.648[/C][C]0.259191[/C][/ROW]
[ROW][C]35[/C][C]0.058803[/C][C]0.6083[/C][C]0.27215[/C][/ROW]
[ROW][C]36[/C][C]0.381362[/C][C]3.9448[/C][C]7.2e-05[/C][/ROW]
[ROW][C]37[/C][C]-0.17108[/C][C]-1.7697[/C][C]0.039816[/C][/ROW]
[ROW][C]38[/C][C]0.101616[/C][C]1.0511[/C][C]0.147784[/C][/ROW]
[ROW][C]39[/C][C]-0.097088[/C][C]-1.0043[/C][C]0.158752[/C][/ROW]
[ROW][C]40[/C][C]-0.107118[/C][C]-1.108[/C][C]0.135164[/C][/ROW]
[ROW][C]41[/C][C]0.046137[/C][C]0.4772[/C][C]0.31708[/C][/ROW]
[ROW][C]42[/C][C]-0.047398[/C][C]-0.4903[/C][C]0.312467[/C][/ROW]
[ROW][C]43[/C][C]-0.012494[/C][C]-0.1292[/C][C]0.448705[/C][/ROW]
[ROW][C]44[/C][C]0.00682[/C][C]0.0705[/C][C]0.471944[/C][/ROW]
[ROW][C]45[/C][C]-0.077774[/C][C]-0.8045[/C][C]0.211446[/C][/ROW]
[ROW][C]46[/C][C]-0.027912[/C][C]-0.2887[/C][C]0.386678[/C][/ROW]
[ROW][C]47[/C][C]0.063216[/C][C]0.6539[/C][C]0.257285[/C][/ROW]
[ROW][C]48[/C][C]0.246275[/C][C]2.5475[/C][C]0.006136[/C][/ROW]
[/TABLE]
Source: https://freestatistics.org/blog/index.php?pk=235611&T=1

Globally Unique Identifier (entire table): ba.freestatistics.org/blog/index.php?pk=235611&T=1

As an alternative you can also use a QR Code:  

The GUIDs for individual cells are displayed in the table below:

Autocorrelation Function
Time lag kACF(k)T-STATP-value
1-0.300779-3.11130.001194
20.0025220.02610.489619
3-0.065967-0.68240.248239
4-0.161566-1.67120.048797
5-0.038686-0.40020.344913
60.1249431.29240.099498
7-0.051811-0.53590.296557
8-0.129642-1.3410.091375
9-0.046596-0.4820.315399
10-0.018512-0.19150.424252
11-0.178129-1.84260.034079
120.7690857.95550
13-0.26301-2.72060.003804
140.0602930.62370.267082
15-0.074622-0.77190.22094
16-0.180651-1.86870.032202
170.0291720.30180.38171
180.0722150.7470.228353
19-0.056052-0.57980.281631
20-0.103278-1.06830.14389
21-0.032439-0.33560.368932
22-0.056568-0.58510.279841
23-0.02218-0.22940.409485
240.5501495.69080
25-0.228049-2.3590.010071
260.0845940.8750.191753
27-0.071756-0.74230.229781
28-0.164489-1.70150.045878
290.0536450.55490.290057
300.0033240.03440.486317
31-0.017824-0.18440.427033
32-0.056568-0.58510.279841
33-0.062127-0.64270.260912
34-0.062643-0.6480.259191
350.0588030.60830.27215
360.3813623.94487.2e-05
37-0.17108-1.76970.039816
380.1016161.05110.147784
39-0.097088-1.00430.158752
40-0.107118-1.1080.135164
410.0461370.47720.31708
42-0.047398-0.49030.312467
43-0.012494-0.12920.448705
440.006820.07050.471944
45-0.077774-0.80450.211446
46-0.027912-0.28870.386678
470.0632160.65390.257285
480.2462752.54750.006136


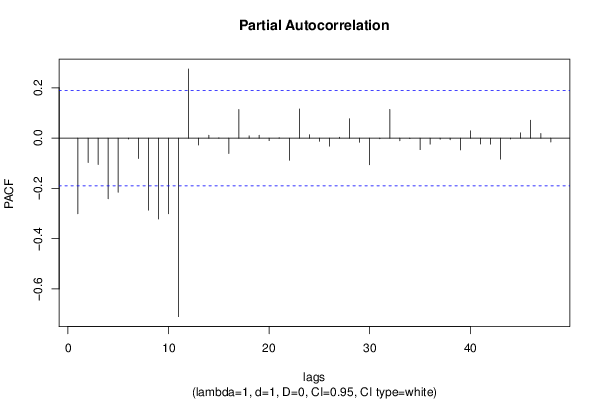
Partial Autocorrelation Function
Time lag kPACF(k)T-STATP-value
1-0.300779-3.11130.001194
2-0.096694-1.00020.159732
3-0.104569-1.08170.140916
4-0.241383-2.49690.007027
5-0.215154-2.22560.01407
6-0.003154-0.03260.487016
7-0.081184-0.83980.201455
8-0.286297-2.96150.001886
9-0.321529-3.32590.000604
10-0.300694-3.11040.001198
11-0.710169-7.3460
120.275342.84810.002637
13-0.027582-0.28530.38798
140.0115630.11960.452509
150.0007320.00760.496988
16-0.061147-0.63250.264201
170.1139651.17890.120533
180.0091950.09510.4622
190.0113930.11780.453206
20-0.009959-0.1030.459071
210.0019630.02030.491918
22-0.087865-0.90890.182727
230.1162411.20240.115931
240.0133580.13820.44518
25-0.012624-0.13060.448173
26-0.031732-0.32820.371687
270.0036990.03830.484775
280.0770330.79680.213655
29-0.016176-0.16730.433715
30-0.105848-1.09490.138009
31-0.002542-0.02630.489537
320.1144021.18340.11964
33-0.010122-0.10470.458405
34-0.00189-0.01950.49222
35-0.045606-0.47170.319033
36-0.023875-0.2470.402705
37-0.004698-0.04860.480666
38-0.006489-0.06710.473305
39-0.046623-0.48230.315301
400.0289080.2990.382751
41-0.02362-0.24430.403722
42-0.023716-0.24530.40334
43-0.083621-0.8650.194492
44-0.003422-0.03540.485914
450.0209390.21660.414469
460.0712180.73670.231465
470.0185740.19210.424002
48-0.015096-0.15620.438102

\begin{tabular}{lllllllll}
\hline
Partial Autocorrelation Function \tabularnewline
Time lag k & PACF(k) & T-STAT & P-value \tabularnewline
1 & -0.300779 & -3.1113 & 0.001194 \tabularnewline
2 & -0.096694 & -1.0002 & 0.159732 \tabularnewline
3 & -0.104569 & -1.0817 & 0.140916 \tabularnewline
4 & -0.241383 & -2.4969 & 0.007027 \tabularnewline
5 & -0.215154 & -2.2256 & 0.01407 \tabularnewline
6 & -0.003154 & -0.0326 & 0.487016 \tabularnewline
7 & -0.081184 & -0.8398 & 0.201455 \tabularnewline
8 & -0.286297 & -2.9615 & 0.001886 \tabularnewline
9 & -0.321529 & -3.3259 & 0.000604 \tabularnewline
10 & -0.300694 & -3.1104 & 0.001198 \tabularnewline
11 & -0.710169 & -7.346 & 0 \tabularnewline
12 & 0.27534 & 2.8481 & 0.002637 \tabularnewline
13 & -0.027582 & -0.2853 & 0.38798 \tabularnewline
14 & 0.011563 & 0.1196 & 0.452509 \tabularnewline
15 & 0.000732 & 0.0076 & 0.496988 \tabularnewline
16 & -0.061147 & -0.6325 & 0.264201 \tabularnewline
17 & 0.113965 & 1.1789 & 0.120533 \tabularnewline
18 & 0.009195 & 0.0951 & 0.4622 \tabularnewline
19 & 0.011393 & 0.1178 & 0.453206 \tabularnewline
20 & -0.009959 & -0.103 & 0.459071 \tabularnewline
21 & 0.001963 & 0.0203 & 0.491918 \tabularnewline
22 & -0.087865 & -0.9089 & 0.182727 \tabularnewline
23 & 0.116241 & 1.2024 & 0.115931 \tabularnewline
24 & 0.013358 & 0.1382 & 0.44518 \tabularnewline
25 & -0.012624 & -0.1306 & 0.448173 \tabularnewline
26 & -0.031732 & -0.3282 & 0.371687 \tabularnewline
27 & 0.003699 & 0.0383 & 0.484775 \tabularnewline
28 & 0.077033 & 0.7968 & 0.213655 \tabularnewline
29 & -0.016176 & -0.1673 & 0.433715 \tabularnewline
30 & -0.105848 & -1.0949 & 0.138009 \tabularnewline
31 & -0.002542 & -0.0263 & 0.489537 \tabularnewline
32 & 0.114402 & 1.1834 & 0.11964 \tabularnewline
33 & -0.010122 & -0.1047 & 0.458405 \tabularnewline
34 & -0.00189 & -0.0195 & 0.49222 \tabularnewline
35 & -0.045606 & -0.4717 & 0.319033 \tabularnewline
36 & -0.023875 & -0.247 & 0.402705 \tabularnewline
37 & -0.004698 & -0.0486 & 0.480666 \tabularnewline
38 & -0.006489 & -0.0671 & 0.473305 \tabularnewline
39 & -0.046623 & -0.4823 & 0.315301 \tabularnewline
40 & 0.028908 & 0.299 & 0.382751 \tabularnewline
41 & -0.02362 & -0.2443 & 0.403722 \tabularnewline
42 & -0.023716 & -0.2453 & 0.40334 \tabularnewline
43 & -0.083621 & -0.865 & 0.194492 \tabularnewline
44 & -0.003422 & -0.0354 & 0.485914 \tabularnewline
45 & 0.020939 & 0.2166 & 0.414469 \tabularnewline
46 & 0.071218 & 0.7367 & 0.231465 \tabularnewline
47 & 0.018574 & 0.1921 & 0.424002 \tabularnewline
48 & -0.015096 & -0.1562 & 0.438102 \tabularnewline
\hline
\end{tabular}
%Source: https://freestatistics.org/blog/index.php?pk=235611&T=2

[TABLE]
[ROW][C]Partial Autocorrelation Function[/C][/ROW]
[ROW][C]Time lag k[/C][C]PACF(k)[/C][C]T-STAT[/C][C]P-value[/C][/ROW]
[ROW][C]1[/C][C]-0.300779[/C][C]-3.1113[/C][C]0.001194[/C][/ROW]
[ROW][C]2[/C][C]-0.096694[/C][C]-1.0002[/C][C]0.159732[/C][/ROW]
[ROW][C]3[/C][C]-0.104569[/C][C]-1.0817[/C][C]0.140916[/C][/ROW]
[ROW][C]4[/C][C]-0.241383[/C][C]-2.4969[/C][C]0.007027[/C][/ROW]
[ROW][C]5[/C][C]-0.215154[/C][C]-2.2256[/C][C]0.01407[/C][/ROW]
[ROW][C]6[/C][C]-0.003154[/C][C]-0.0326[/C][C]0.487016[/C][/ROW]
[ROW][C]7[/C][C]-0.081184[/C][C]-0.8398[/C][C]0.201455[/C][/ROW]
[ROW][C]8[/C][C]-0.286297[/C][C]-2.9615[/C][C]0.001886[/C][/ROW]
[ROW][C]9[/C][C]-0.321529[/C][C]-3.3259[/C][C]0.000604[/C][/ROW]
[ROW][C]10[/C][C]-0.300694[/C][C]-3.1104[/C][C]0.001198[/C][/ROW]
[ROW][C]11[/C][C]-0.710169[/C][C]-7.346[/C][C]0[/C][/ROW]
[ROW][C]12[/C][C]0.27534[/C][C]2.8481[/C][C]0.002637[/C][/ROW]
[ROW][C]13[/C][C]-0.027582[/C][C]-0.2853[/C][C]0.38798[/C][/ROW]
[ROW][C]14[/C][C]0.011563[/C][C]0.1196[/C][C]0.452509[/C][/ROW]
[ROW][C]15[/C][C]0.000732[/C][C]0.0076[/C][C]0.496988[/C][/ROW]
[ROW][C]16[/C][C]-0.061147[/C][C]-0.6325[/C][C]0.264201[/C][/ROW]
[ROW][C]17[/C][C]0.113965[/C][C]1.1789[/C][C]0.120533[/C][/ROW]
[ROW][C]18[/C][C]0.009195[/C][C]0.0951[/C][C]0.4622[/C][/ROW]
[ROW][C]19[/C][C]0.011393[/C][C]0.1178[/C][C]0.453206[/C][/ROW]
[ROW][C]20[/C][C]-0.009959[/C][C]-0.103[/C][C]0.459071[/C][/ROW]
[ROW][C]21[/C][C]0.001963[/C][C]0.0203[/C][C]0.491918[/C][/ROW]
[ROW][C]22[/C][C]-0.087865[/C][C]-0.9089[/C][C]0.182727[/C][/ROW]
[ROW][C]23[/C][C]0.116241[/C][C]1.2024[/C][C]0.115931[/C][/ROW]
[ROW][C]24[/C][C]0.013358[/C][C]0.1382[/C][C]0.44518[/C][/ROW]
[ROW][C]25[/C][C]-0.012624[/C][C]-0.1306[/C][C]0.448173[/C][/ROW]
[ROW][C]26[/C][C]-0.031732[/C][C]-0.3282[/C][C]0.371687[/C][/ROW]
[ROW][C]27[/C][C]0.003699[/C][C]0.0383[/C][C]0.484775[/C][/ROW]
[ROW][C]28[/C][C]0.077033[/C][C]0.7968[/C][C]0.213655[/C][/ROW]
[ROW][C]29[/C][C]-0.016176[/C][C]-0.1673[/C][C]0.433715[/C][/ROW]
[ROW][C]30[/C][C]-0.105848[/C][C]-1.0949[/C][C]0.138009[/C][/ROW]
[ROW][C]31[/C][C]-0.002542[/C][C]-0.0263[/C][C]0.489537[/C][/ROW]
[ROW][C]32[/C][C]0.114402[/C][C]1.1834[/C][C]0.11964[/C][/ROW]
[ROW][C]33[/C][C]-0.010122[/C][C]-0.1047[/C][C]0.458405[/C][/ROW]
[ROW][C]34[/C][C]-0.00189[/C][C]-0.0195[/C][C]0.49222[/C][/ROW]
[ROW][C]35[/C][C]-0.045606[/C][C]-0.4717[/C][C]0.319033[/C][/ROW]
[ROW][C]36[/C][C]-0.023875[/C][C]-0.247[/C][C]0.402705[/C][/ROW]
[ROW][C]37[/C][C]-0.004698[/C][C]-0.0486[/C][C]0.480666[/C][/ROW]
[ROW][C]38[/C][C]-0.006489[/C][C]-0.0671[/C][C]0.473305[/C][/ROW]
[ROW][C]39[/C][C]-0.046623[/C][C]-0.4823[/C][C]0.315301[/C][/ROW]
[ROW][C]40[/C][C]0.028908[/C][C]0.299[/C][C]0.382751[/C][/ROW]
[ROW][C]41[/C][C]-0.02362[/C][C]-0.2443[/C][C]0.403722[/C][/ROW]
[ROW][C]42[/C][C]-0.023716[/C][C]-0.2453[/C][C]0.40334[/C][/ROW]
[ROW][C]43[/C][C]-0.083621[/C][C]-0.865[/C][C]0.194492[/C][/ROW]
[ROW][C]44[/C][C]-0.003422[/C][C]-0.0354[/C][C]0.485914[/C][/ROW]
[ROW][C]45[/C][C]0.020939[/C][C]0.2166[/C][C]0.414469[/C][/ROW]
[ROW][C]46[/C][C]0.071218[/C][C]0.7367[/C][C]0.231465[/C][/ROW]
[ROW][C]47[/C][C]0.018574[/C][C]0.1921[/C][C]0.424002[/C][/ROW]
[ROW][C]48[/C][C]-0.015096[/C][C]-0.1562[/C][C]0.438102[/C][/ROW]
[/TABLE]
Source: https://freestatistics.org/blog/index.php?pk=235611&T=2

Globally Unique Identifier (entire table): ba.freestatistics.org/blog/index.php?pk=235611&T=2

As an alternative you can also use a QR Code:  

The GUIDs for individual cells are displayed in the table below:

Partial Autocorrelation Function
Time lag kPACF(k)T-STATP-value
1-0.300779-3.11130.001194
2-0.096694-1.00020.159732
3-0.104569-1.08170.140916
4-0.241383-2.49690.007027
5-0.215154-2.22560.01407
6-0.003154-0.03260.487016
7-0.081184-0.83980.201455
8-0.286297-2.96150.001886
9-0.321529-3.32590.000604
10-0.300694-3.11040.001198
11-0.710169-7.3460
120.275342.84810.002637
13-0.027582-0.28530.38798
140.0115630.11960.452509
150.0007320.00760.496988
16-0.061147-0.63250.264201
170.1139651.17890.120533
180.0091950.09510.4622
190.0113930.11780.453206
20-0.009959-0.1030.459071
210.0019630.02030.491918
22-0.087865-0.90890.182727
230.1162411.20240.115931
240.0133580.13820.44518
25-0.012624-0.13060.448173
26-0.031732-0.32820.371687
270.0036990.03830.484775
280.0770330.79680.213655
29-0.016176-0.16730.433715
30-0.105848-1.09490.138009
31-0.002542-0.02630.489537
320.1144021.18340.11964
33-0.010122-0.10470.458405
34-0.00189-0.01950.49222
35-0.045606-0.47170.319033
36-0.023875-0.2470.402705
37-0.004698-0.04860.480666
38-0.006489-0.06710.473305
39-0.046623-0.48230.315301
400.0289080.2990.382751
41-0.02362-0.24430.403722
42-0.023716-0.24530.40334
43-0.083621-0.8650.194492
44-0.003422-0.03540.485914
450.0209390.21660.414469
460.0712180.73670.231465
470.0185740.19210.424002
48-0.015096-0.15620.438102


Parameters (Session):
par1 = 48 ; par2 = 1 ; par3 = 1 ; par4 = 0 ; par5 = 12 ; par6 = White Noise ; par7 = 0.95 ;
Parameters (R input):
par1 = 48 ; par2 = 1 ; par3 = 1 ; par4 = 0 ; par5 = 12 ; par6 = White Noise ; par7 = 0.95 ; par8 = ;
R code (references can be found in the software module):
if (par1 == 'Default') {
par1 = 10*log10(length(x))
} else {
par1 <- as.numeric(par1)
}
par2 <- as.numeric(par2)
par3 <- as.numeric(par3)
par4 <- as.numeric(par4)
par5 <- as.numeric(par5)
if (par6 == 'White Noise') par6 <- 'white' else par6 <- 'ma'
par7 <- as.numeric(par7)
if (par8 != '') par8 <- as.numeric(par8)
ox <- x
if (par8 == '') {
if (par2 == 0) {
x <- log(x)
} else {
x <- (x ^ par2 - 1) / par2
}
} else {
x <- log(x,base=par8)
}
if (par3 > 0) x <- diff(x,lag=1,difference=par3)
if (par4 > 0) x <- diff(x,lag=par5,difference=par4)
bitmap(file='picts.png')
op <- par(mfrow=c(2,1))
plot(ox,type='l',main='Original Time Series',xlab='time',ylab='value')
if (par8=='') {
mytitle <- paste('Working Time Series (lambda=',par2,', d=',par3,', D=',par4,')',sep='')
mysub <- paste('(lambda=',par2,', d=',par3,', D=',par4,', CI=', par7, ', CI type=',par6,')',sep='')
} else {
mytitle <- paste('Working Time Series (base=',par8,', d=',par3,', D=',par4,')',sep='')
mysub <- paste('(base=',par8,', d=',par3,', D=',par4,', CI=', par7, ', CI type=',par6,')',sep='')
}
plot(x,type='l', main=mytitle,xlab='time',ylab='value')
par(op)
dev.off()
bitmap(file='pic1.png')
racf <- acf(x, par1, main='Autocorrelation', xlab='time lag', ylab='ACF', ci.type=par6, ci=par7, sub=mysub)
dev.off()
bitmap(file='pic2.png')
rpacf <- pacf(x,par1,main='Partial Autocorrelation',xlab='lags',ylab='PACF',sub=mysub)
dev.off()
(myacf <- c(racf$acf))
(mypacf <- c(rpacf$acf))
lengthx <- length(x)
sqrtn <- sqrt(lengthx)
load(file='createtable')
a<-table.start()
a<-table.row.start(a)
a<-table.element(a,'Autocorrelation Function',4,TRUE)
a<-table.row.end(a)
a<-table.row.start(a)
a<-table.element(a,'Time lag k',header=TRUE)
a<-table.element(a,hyperlink('basics.htm','ACF(k)','click here for more information about the Autocorrelation Function'),header=TRUE)
a<-table.element(a,'T-STAT',header=TRUE)
a<-table.element(a,'P-value',header=TRUE)
a<-table.row.end(a)
for (i in 2:(par1+1)) {
a<-table.row.start(a)
a<-table.element(a,i-1,header=TRUE)
a<-table.element(a,round(myacf[i],6))
mytstat <- myacf[i]*sqrtn
a<-table.element(a,round(mytstat,4))
a<-table.element(a,round(1-pt(abs(mytstat),lengthx),6))
a<-table.row.end(a)
}
a<-table.end(a)
table.save(a,file='mytable.tab')
a<-table.start()
a<-table.row.start(a)
a<-table.element(a,'Partial Autocorrelation Function',4,TRUE)
a<-table.row.end(a)
a<-table.row.start(a)
a<-table.element(a,'Time lag k',header=TRUE)
a<-table.element(a,hyperlink('basics.htm','PACF(k)','click here for more information about the Partial Autocorrelation Function'),header=TRUE)
a<-table.element(a,'T-STAT',header=TRUE)
a<-table.element(a,'P-value',header=TRUE)
a<-table.row.end(a)
for (i in 1:par1) {
a<-table.row.start(a)
a<-table.element(a,i,header=TRUE)
a<-table.element(a,round(mypacf[i],6))
mytstat <- mypacf[i]*sqrtn
a<-table.element(a,round(mytstat,4))
a<-table.element(a,round(1-pt(abs(mytstat),lengthx),6))
a<-table.row.end(a)
}
a<-table.end(a)
table.save(a,file='mytable1.tab')