Free Statistics

of Irreproducible Research!

Author's title

Author*Unverified author*
R Software Modulerwasp_autocorrelation.wasp
Title produced by software(Partial) Autocorrelation Function
Date of computationMon, 18 Aug 2014 12:40:42 +0100
Cite this page as followsStatistical Computations at FreeStatistics.org, Office for Research Development and Education, URL https://freestatistics.org/blog/index.php?v=date/2014/Aug/18/t1408362137mn4zal2ap5paxzf.htm/, Retrieved Thu, 16 May 2024 15:55:50 +0000
Statistical Computations at FreeStatistics.org, Office for Research Development and Education, URL https://freestatistics.org/blog/index.php?pk=235708, Retrieved Thu, 16 May 2024 15:55:50 +0000
QR Codes:

Original text written by user:
IsPrivate?No (this computation is public)
User-defined keywordsVan Reusel Raphael
Estimated Impact91
Family? (F = Feedback message, R = changed R code, M = changed R Module, P = changed Parameters, D = changed Data)
-       [(Partial) Autocorrelation Function] [Tijdreeks 2] [2014-08-18 11:40:42] [bf566d88435d8cc6ce5d208f6f8dd684] [Current]
Feedback Forum

Post a new message
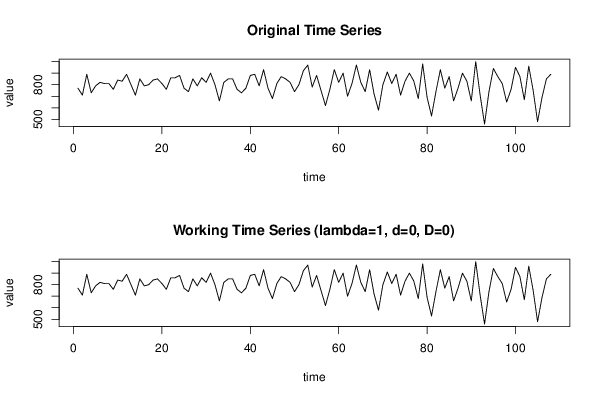
Dataseries X:
770
710
890
730
790
820
810
810
760
840
830
890
800
710
850
790
800
840
850
810
760
860
860
880
770
740
850
790
860
820
900
800
660
820
850
850
760
730
770
880
890
790
930
770
680
810
870
850
820
740
800
920
970
780
880
750
620
760
930
820
900
700
810
970
820
740
930
720
580
800
910
810
890
710
830
900
830
680
980
690
530
740
930
770
870
660
770
900
830
660
1000
710
460
740
940
870
810
650
760
950
870
670
960
750
480
690
850
890


Summary of computational transaction
Raw Inputview raw input (R code)
Raw Outputview raw output of R engine
Computing time2 seconds
R Server'Sir Maurice George Kendall' @ kendall.wessa.net

\begin{tabular}{lllllllll}
\hline
Summary of computational transaction \tabularnewline
Raw Input & view raw input (R code)  \tabularnewline
Raw Output & view raw output of R engine  \tabularnewline
Computing time & 2 seconds \tabularnewline
R Server & 'Sir Maurice George Kendall' @ kendall.wessa.net \tabularnewline
\hline
\end{tabular}
%Source: https://freestatistics.org/blog/index.php?pk=235708&T=0

[TABLE]
[ROW][C]Summary of computational transaction[/C][/ROW]
[ROW][C]Raw Input[/C][C]view raw input (R code) [/C][/ROW]
[ROW][C]Raw Output[/C][C]view raw output of R engine [/C][/ROW]
[ROW][C]Computing time[/C][C]2 seconds[/C][/ROW]
[ROW][C]R Server[/C][C]'Sir Maurice George Kendall' @ kendall.wessa.net[/C][/ROW]
[/TABLE]
Source: https://freestatistics.org/blog/index.php?pk=235708&T=0

Globally Unique Identifier (entire table): ba.freestatistics.org/blog/index.php?pk=235708&T=0

As an alternative you can also use a QR Code:  

The GUIDs for individual cells are displayed in the table below:

Summary of computational transaction
Raw Inputview raw input (R code)
Raw Outputview raw output of R engine
Computing time2 seconds
R Server'Sir Maurice George Kendall' @ kendall.wessa.net


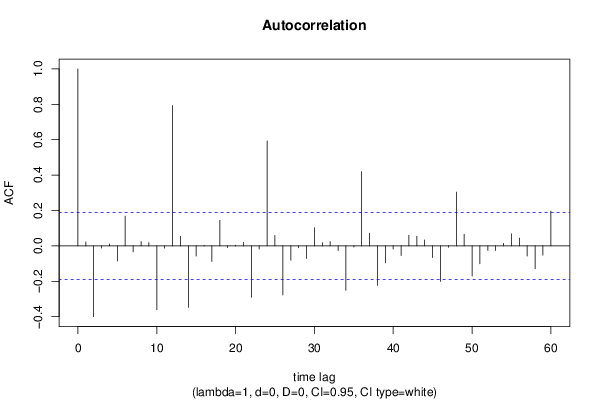
Autocorrelation Function
Time lag kACF(k)T-STATP-value
10.0217610.22610.410756
2-0.399914-4.1563.3e-05
3-0.012437-0.12920.4487
40.0105760.10990.456342
5-0.085614-0.88970.187796
60.1682941.7490.041569
7-0.033729-0.35050.363316
80.0242810.25230.40063
90.0185690.1930.423671
10-0.360989-3.75150.000142
11-0.012643-0.13140.447855
120.7933678.24490
130.054510.56650.28612
14-0.347343-3.60970.000233
15-0.057336-0.59590.276259
160.0026440.02750.489067
17-0.087792-0.91240.181805
180.1443061.49970.068309
19-0.00953-0.0990.460646
200.0041150.04280.482983
210.0197620.20540.418835
22-0.290632-3.02030.001576
23-0.01751-0.1820.427975
240.5928636.16120
250.0584950.60790.272267
26-0.27777-2.88670.002352
27-0.080475-0.83630.202411
28-0.010915-0.11340.45495
29-0.071314-0.74110.230115
300.1025591.06580.14444
310.0187060.19440.423113
320.0240930.25040.401384
33-0.0258-0.26810.394558
34-0.251127-2.60980.005172
35-0.006591-0.06850.472757
360.4193714.35821.5e-05
370.0719760.7480.228043
38-0.223417-2.32180.011059
39-0.096017-0.99780.160294
40-0.01788-0.18580.42647
41-0.054295-0.56420.286877
420.0602540.62620.266259
430.0548470.570.284935
440.0334750.34790.364304
45-0.065708-0.68290.248078
46-0.200811-2.08690.019626
47-0.007483-0.07780.469078
480.3037783.1570.001033
490.0655110.68080.248726
50-0.169896-1.76560.040144
51-0.101231-1.0520.147569
52-0.025296-0.26290.396571
53-0.026308-0.27340.392532
540.0144360.150.440514
550.0680090.70680.240614
560.043960.45680.324351
57-0.056726-0.58950.278375
58-0.12975-1.34840.090175
59-0.052185-0.54230.294357
600.1964232.04130.02183

\begin{tabular}{lllllllll}
\hline
Autocorrelation Function \tabularnewline
Time lag k & ACF(k) & T-STAT & P-value \tabularnewline
1 & 0.021761 & 0.2261 & 0.410756 \tabularnewline
2 & -0.399914 & -4.156 & 3.3e-05 \tabularnewline
3 & -0.012437 & -0.1292 & 0.4487 \tabularnewline
4 & 0.010576 & 0.1099 & 0.456342 \tabularnewline
5 & -0.085614 & -0.8897 & 0.187796 \tabularnewline
6 & 0.168294 & 1.749 & 0.041569 \tabularnewline
7 & -0.033729 & -0.3505 & 0.363316 \tabularnewline
8 & 0.024281 & 0.2523 & 0.40063 \tabularnewline
9 & 0.018569 & 0.193 & 0.423671 \tabularnewline
10 & -0.360989 & -3.7515 & 0.000142 \tabularnewline
11 & -0.012643 & -0.1314 & 0.447855 \tabularnewline
12 & 0.793367 & 8.2449 & 0 \tabularnewline
13 & 0.05451 & 0.5665 & 0.28612 \tabularnewline
14 & -0.347343 & -3.6097 & 0.000233 \tabularnewline
15 & -0.057336 & -0.5959 & 0.276259 \tabularnewline
16 & 0.002644 & 0.0275 & 0.489067 \tabularnewline
17 & -0.087792 & -0.9124 & 0.181805 \tabularnewline
18 & 0.144306 & 1.4997 & 0.068309 \tabularnewline
19 & -0.00953 & -0.099 & 0.460646 \tabularnewline
20 & 0.004115 & 0.0428 & 0.482983 \tabularnewline
21 & 0.019762 & 0.2054 & 0.418835 \tabularnewline
22 & -0.290632 & -3.0203 & 0.001576 \tabularnewline
23 & -0.01751 & -0.182 & 0.427975 \tabularnewline
24 & 0.592863 & 6.1612 & 0 \tabularnewline
25 & 0.058495 & 0.6079 & 0.272267 \tabularnewline
26 & -0.27777 & -2.8867 & 0.002352 \tabularnewline
27 & -0.080475 & -0.8363 & 0.202411 \tabularnewline
28 & -0.010915 & -0.1134 & 0.45495 \tabularnewline
29 & -0.071314 & -0.7411 & 0.230115 \tabularnewline
30 & 0.102559 & 1.0658 & 0.14444 \tabularnewline
31 & 0.018706 & 0.1944 & 0.423113 \tabularnewline
32 & 0.024093 & 0.2504 & 0.401384 \tabularnewline
33 & -0.0258 & -0.2681 & 0.394558 \tabularnewline
34 & -0.251127 & -2.6098 & 0.005172 \tabularnewline
35 & -0.006591 & -0.0685 & 0.472757 \tabularnewline
36 & 0.419371 & 4.3582 & 1.5e-05 \tabularnewline
37 & 0.071976 & 0.748 & 0.228043 \tabularnewline
38 & -0.223417 & -2.3218 & 0.011059 \tabularnewline
39 & -0.096017 & -0.9978 & 0.160294 \tabularnewline
40 & -0.01788 & -0.1858 & 0.42647 \tabularnewline
41 & -0.054295 & -0.5642 & 0.286877 \tabularnewline
42 & 0.060254 & 0.6262 & 0.266259 \tabularnewline
43 & 0.054847 & 0.57 & 0.284935 \tabularnewline
44 & 0.033475 & 0.3479 & 0.364304 \tabularnewline
45 & -0.065708 & -0.6829 & 0.248078 \tabularnewline
46 & -0.200811 & -2.0869 & 0.019626 \tabularnewline
47 & -0.007483 & -0.0778 & 0.469078 \tabularnewline
48 & 0.303778 & 3.157 & 0.001033 \tabularnewline
49 & 0.065511 & 0.6808 & 0.248726 \tabularnewline
50 & -0.169896 & -1.7656 & 0.040144 \tabularnewline
51 & -0.101231 & -1.052 & 0.147569 \tabularnewline
52 & -0.025296 & -0.2629 & 0.396571 \tabularnewline
53 & -0.026308 & -0.2734 & 0.392532 \tabularnewline
54 & 0.014436 & 0.15 & 0.440514 \tabularnewline
55 & 0.068009 & 0.7068 & 0.240614 \tabularnewline
56 & 0.04396 & 0.4568 & 0.324351 \tabularnewline
57 & -0.056726 & -0.5895 & 0.278375 \tabularnewline
58 & -0.12975 & -1.3484 & 0.090175 \tabularnewline
59 & -0.052185 & -0.5423 & 0.294357 \tabularnewline
60 & 0.196423 & 2.0413 & 0.02183 \tabularnewline
\hline
\end{tabular}
%Source: https://freestatistics.org/blog/index.php?pk=235708&T=1

[TABLE]
[ROW][C]Autocorrelation Function[/C][/ROW]
[ROW][C]Time lag k[/C][C]ACF(k)[/C][C]T-STAT[/C][C]P-value[/C][/ROW]
[ROW][C]1[/C][C]0.021761[/C][C]0.2261[/C][C]0.410756[/C][/ROW]
[ROW][C]2[/C][C]-0.399914[/C][C]-4.156[/C][C]3.3e-05[/C][/ROW]
[ROW][C]3[/C][C]-0.012437[/C][C]-0.1292[/C][C]0.4487[/C][/ROW]
[ROW][C]4[/C][C]0.010576[/C][C]0.1099[/C][C]0.456342[/C][/ROW]
[ROW][C]5[/C][C]-0.085614[/C][C]-0.8897[/C][C]0.187796[/C][/ROW]
[ROW][C]6[/C][C]0.168294[/C][C]1.749[/C][C]0.041569[/C][/ROW]
[ROW][C]7[/C][C]-0.033729[/C][C]-0.3505[/C][C]0.363316[/C][/ROW]
[ROW][C]8[/C][C]0.024281[/C][C]0.2523[/C][C]0.40063[/C][/ROW]
[ROW][C]9[/C][C]0.018569[/C][C]0.193[/C][C]0.423671[/C][/ROW]
[ROW][C]10[/C][C]-0.360989[/C][C]-3.7515[/C][C]0.000142[/C][/ROW]
[ROW][C]11[/C][C]-0.012643[/C][C]-0.1314[/C][C]0.447855[/C][/ROW]
[ROW][C]12[/C][C]0.793367[/C][C]8.2449[/C][C]0[/C][/ROW]
[ROW][C]13[/C][C]0.05451[/C][C]0.5665[/C][C]0.28612[/C][/ROW]
[ROW][C]14[/C][C]-0.347343[/C][C]-3.6097[/C][C]0.000233[/C][/ROW]
[ROW][C]15[/C][C]-0.057336[/C][C]-0.5959[/C][C]0.276259[/C][/ROW]
[ROW][C]16[/C][C]0.002644[/C][C]0.0275[/C][C]0.489067[/C][/ROW]
[ROW][C]17[/C][C]-0.087792[/C][C]-0.9124[/C][C]0.181805[/C][/ROW]
[ROW][C]18[/C][C]0.144306[/C][C]1.4997[/C][C]0.068309[/C][/ROW]
[ROW][C]19[/C][C]-0.00953[/C][C]-0.099[/C][C]0.460646[/C][/ROW]
[ROW][C]20[/C][C]0.004115[/C][C]0.0428[/C][C]0.482983[/C][/ROW]
[ROW][C]21[/C][C]0.019762[/C][C]0.2054[/C][C]0.418835[/C][/ROW]
[ROW][C]22[/C][C]-0.290632[/C][C]-3.0203[/C][C]0.001576[/C][/ROW]
[ROW][C]23[/C][C]-0.01751[/C][C]-0.182[/C][C]0.427975[/C][/ROW]
[ROW][C]24[/C][C]0.592863[/C][C]6.1612[/C][C]0[/C][/ROW]
[ROW][C]25[/C][C]0.058495[/C][C]0.6079[/C][C]0.272267[/C][/ROW]
[ROW][C]26[/C][C]-0.27777[/C][C]-2.8867[/C][C]0.002352[/C][/ROW]
[ROW][C]27[/C][C]-0.080475[/C][C]-0.8363[/C][C]0.202411[/C][/ROW]
[ROW][C]28[/C][C]-0.010915[/C][C]-0.1134[/C][C]0.45495[/C][/ROW]
[ROW][C]29[/C][C]-0.071314[/C][C]-0.7411[/C][C]0.230115[/C][/ROW]
[ROW][C]30[/C][C]0.102559[/C][C]1.0658[/C][C]0.14444[/C][/ROW]
[ROW][C]31[/C][C]0.018706[/C][C]0.1944[/C][C]0.423113[/C][/ROW]
[ROW][C]32[/C][C]0.024093[/C][C]0.2504[/C][C]0.401384[/C][/ROW]
[ROW][C]33[/C][C]-0.0258[/C][C]-0.2681[/C][C]0.394558[/C][/ROW]
[ROW][C]34[/C][C]-0.251127[/C][C]-2.6098[/C][C]0.005172[/C][/ROW]
[ROW][C]35[/C][C]-0.006591[/C][C]-0.0685[/C][C]0.472757[/C][/ROW]
[ROW][C]36[/C][C]0.419371[/C][C]4.3582[/C][C]1.5e-05[/C][/ROW]
[ROW][C]37[/C][C]0.071976[/C][C]0.748[/C][C]0.228043[/C][/ROW]
[ROW][C]38[/C][C]-0.223417[/C][C]-2.3218[/C][C]0.011059[/C][/ROW]
[ROW][C]39[/C][C]-0.096017[/C][C]-0.9978[/C][C]0.160294[/C][/ROW]
[ROW][C]40[/C][C]-0.01788[/C][C]-0.1858[/C][C]0.42647[/C][/ROW]
[ROW][C]41[/C][C]-0.054295[/C][C]-0.5642[/C][C]0.286877[/C][/ROW]
[ROW][C]42[/C][C]0.060254[/C][C]0.6262[/C][C]0.266259[/C][/ROW]
[ROW][C]43[/C][C]0.054847[/C][C]0.57[/C][C]0.284935[/C][/ROW]
[ROW][C]44[/C][C]0.033475[/C][C]0.3479[/C][C]0.364304[/C][/ROW]
[ROW][C]45[/C][C]-0.065708[/C][C]-0.6829[/C][C]0.248078[/C][/ROW]
[ROW][C]46[/C][C]-0.200811[/C][C]-2.0869[/C][C]0.019626[/C][/ROW]
[ROW][C]47[/C][C]-0.007483[/C][C]-0.0778[/C][C]0.469078[/C][/ROW]
[ROW][C]48[/C][C]0.303778[/C][C]3.157[/C][C]0.001033[/C][/ROW]
[ROW][C]49[/C][C]0.065511[/C][C]0.6808[/C][C]0.248726[/C][/ROW]
[ROW][C]50[/C][C]-0.169896[/C][C]-1.7656[/C][C]0.040144[/C][/ROW]
[ROW][C]51[/C][C]-0.101231[/C][C]-1.052[/C][C]0.147569[/C][/ROW]
[ROW][C]52[/C][C]-0.025296[/C][C]-0.2629[/C][C]0.396571[/C][/ROW]
[ROW][C]53[/C][C]-0.026308[/C][C]-0.2734[/C][C]0.392532[/C][/ROW]
[ROW][C]54[/C][C]0.014436[/C][C]0.15[/C][C]0.440514[/C][/ROW]
[ROW][C]55[/C][C]0.068009[/C][C]0.7068[/C][C]0.240614[/C][/ROW]
[ROW][C]56[/C][C]0.04396[/C][C]0.4568[/C][C]0.324351[/C][/ROW]
[ROW][C]57[/C][C]-0.056726[/C][C]-0.5895[/C][C]0.278375[/C][/ROW]
[ROW][C]58[/C][C]-0.12975[/C][C]-1.3484[/C][C]0.090175[/C][/ROW]
[ROW][C]59[/C][C]-0.052185[/C][C]-0.5423[/C][C]0.294357[/C][/ROW]
[ROW][C]60[/C][C]0.196423[/C][C]2.0413[/C][C]0.02183[/C][/ROW]
[/TABLE]
Source: https://freestatistics.org/blog/index.php?pk=235708&T=1

Globally Unique Identifier (entire table): ba.freestatistics.org/blog/index.php?pk=235708&T=1

As an alternative you can also use a QR Code:  

The GUIDs for individual cells are displayed in the table below:

Autocorrelation Function
Time lag kACF(k)T-STATP-value
10.0217610.22610.410756
2-0.399914-4.1563.3e-05
3-0.012437-0.12920.4487
40.0105760.10990.456342
5-0.085614-0.88970.187796
60.1682941.7490.041569
7-0.033729-0.35050.363316
80.0242810.25230.40063
90.0185690.1930.423671
10-0.360989-3.75150.000142
11-0.012643-0.13140.447855
120.7933678.24490
130.054510.56650.28612
14-0.347343-3.60970.000233
15-0.057336-0.59590.276259
160.0026440.02750.489067
17-0.087792-0.91240.181805
180.1443061.49970.068309
19-0.00953-0.0990.460646
200.0041150.04280.482983
210.0197620.20540.418835
22-0.290632-3.02030.001576
23-0.01751-0.1820.427975
240.5928636.16120
250.0584950.60790.272267
26-0.27777-2.88670.002352
27-0.080475-0.83630.202411
28-0.010915-0.11340.45495
29-0.071314-0.74110.230115
300.1025591.06580.14444
310.0187060.19440.423113
320.0240930.25040.401384
33-0.0258-0.26810.394558
34-0.251127-2.60980.005172
35-0.006591-0.06850.472757
360.4193714.35821.5e-05
370.0719760.7480.228043
38-0.223417-2.32180.011059
39-0.096017-0.99780.160294
40-0.01788-0.18580.42647
41-0.054295-0.56420.286877
420.0602540.62620.266259
430.0548470.570.284935
440.0334750.34790.364304
45-0.065708-0.68290.248078
46-0.200811-2.08690.019626
47-0.007483-0.07780.469078
480.3037783.1570.001033
490.0655110.68080.248726
50-0.169896-1.76560.040144
51-0.101231-1.0520.147569
52-0.025296-0.26290.396571
53-0.026308-0.27340.392532
540.0144360.150.440514
550.0680090.70680.240614
560.043960.45680.324351
57-0.056726-0.58950.278375
58-0.12975-1.34840.090175
59-0.052185-0.54230.294357
600.1964232.04130.02183


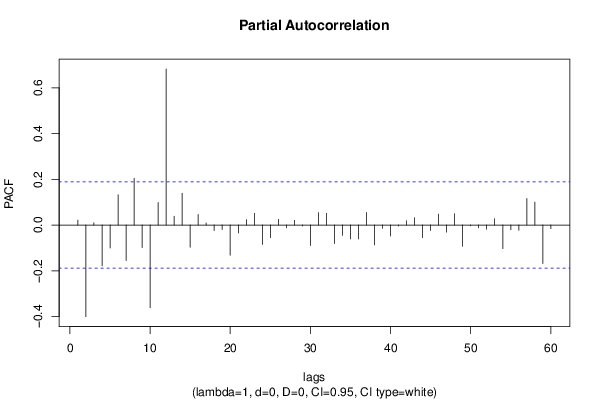
Partial Autocorrelation Function
Time lag kPACF(k)T-STATP-value
10.0217610.22610.410756
2-0.400577-4.16293.2e-05
30.0100920.10490.458333
4-0.178217-1.85210.033373
5-0.100316-1.04250.149749
60.1328381.38050.085143
7-0.155036-1.61120.05503
80.2046542.12680.017856
9-0.098211-1.02060.154854
10-0.361443-3.75620.00014
110.0990781.02960.152738
120.6828277.09620
130.0384130.39920.345267
140.1391121.44570.075579
15-0.096948-1.00750.15797
160.0462170.48030.315992
170.0089450.0930.463053
18-0.023687-0.24620.403012
19-0.019188-0.19940.421158
20-0.132101-1.37280.086324
21-0.034446-0.3580.36053
220.0229790.23880.405857
230.0516250.53650.296356
24-0.085448-0.8880.188258
25-0.05556-0.57740.282437
260.0250960.26080.39737
27-0.011519-0.11970.452468
280.0212340.22070.412883
29-0.004455-0.04630.481578
30-0.089348-0.92850.177602
310.0543580.56490.286656
320.0513930.53410.297189
33-0.080406-0.83560.202611
34-0.045048-0.46810.320311
35-0.060688-0.63070.26479
36-0.06094-0.63330.263936
370.055010.57170.284362
38-0.086524-0.89920.185278
39-0.014664-0.15240.439581
40-0.047726-0.4960.310457
41-0.004321-0.04490.482135
420.0188540.19590.422516
430.0317470.32990.371049
44-0.055784-0.57970.281654
45-0.023883-0.24820.402227
460.0480320.49920.309338
47-0.031079-0.3230.373666
480.0494110.51350.304328
49-0.092792-0.96430.168521
50-0.003394-0.03530.485965
51-0.011697-0.12160.451737
52-0.017707-0.1840.427174
530.0273910.28470.388225
54-0.103203-1.07250.14294
55-0.020198-0.20990.41707
56-0.023069-0.23970.405494
570.1164631.21030.1144
580.1005391.04480.149217
59-0.168401-1.75010.041473
60-0.015633-0.16250.435624

\begin{tabular}{lllllllll}
\hline
Partial Autocorrelation Function \tabularnewline
Time lag k & PACF(k) & T-STAT & P-value \tabularnewline
1 & 0.021761 & 0.2261 & 0.410756 \tabularnewline
2 & -0.400577 & -4.1629 & 3.2e-05 \tabularnewline
3 & 0.010092 & 0.1049 & 0.458333 \tabularnewline
4 & -0.178217 & -1.8521 & 0.033373 \tabularnewline
5 & -0.100316 & -1.0425 & 0.149749 \tabularnewline
6 & 0.132838 & 1.3805 & 0.085143 \tabularnewline
7 & -0.155036 & -1.6112 & 0.05503 \tabularnewline
8 & 0.204654 & 2.1268 & 0.017856 \tabularnewline
9 & -0.098211 & -1.0206 & 0.154854 \tabularnewline
10 & -0.361443 & -3.7562 & 0.00014 \tabularnewline
11 & 0.099078 & 1.0296 & 0.152738 \tabularnewline
12 & 0.682827 & 7.0962 & 0 \tabularnewline
13 & 0.038413 & 0.3992 & 0.345267 \tabularnewline
14 & 0.139112 & 1.4457 & 0.075579 \tabularnewline
15 & -0.096948 & -1.0075 & 0.15797 \tabularnewline
16 & 0.046217 & 0.4803 & 0.315992 \tabularnewline
17 & 0.008945 & 0.093 & 0.463053 \tabularnewline
18 & -0.023687 & -0.2462 & 0.403012 \tabularnewline
19 & -0.019188 & -0.1994 & 0.421158 \tabularnewline
20 & -0.132101 & -1.3728 & 0.086324 \tabularnewline
21 & -0.034446 & -0.358 & 0.36053 \tabularnewline
22 & 0.022979 & 0.2388 & 0.405857 \tabularnewline
23 & 0.051625 & 0.5365 & 0.296356 \tabularnewline
24 & -0.085448 & -0.888 & 0.188258 \tabularnewline
25 & -0.05556 & -0.5774 & 0.282437 \tabularnewline
26 & 0.025096 & 0.2608 & 0.39737 \tabularnewline
27 & -0.011519 & -0.1197 & 0.452468 \tabularnewline
28 & 0.021234 & 0.2207 & 0.412883 \tabularnewline
29 & -0.004455 & -0.0463 & 0.481578 \tabularnewline
30 & -0.089348 & -0.9285 & 0.177602 \tabularnewline
31 & 0.054358 & 0.5649 & 0.286656 \tabularnewline
32 & 0.051393 & 0.5341 & 0.297189 \tabularnewline
33 & -0.080406 & -0.8356 & 0.202611 \tabularnewline
34 & -0.045048 & -0.4681 & 0.320311 \tabularnewline
35 & -0.060688 & -0.6307 & 0.26479 \tabularnewline
36 & -0.06094 & -0.6333 & 0.263936 \tabularnewline
37 & 0.05501 & 0.5717 & 0.284362 \tabularnewline
38 & -0.086524 & -0.8992 & 0.185278 \tabularnewline
39 & -0.014664 & -0.1524 & 0.439581 \tabularnewline
40 & -0.047726 & -0.496 & 0.310457 \tabularnewline
41 & -0.004321 & -0.0449 & 0.482135 \tabularnewline
42 & 0.018854 & 0.1959 & 0.422516 \tabularnewline
43 & 0.031747 & 0.3299 & 0.371049 \tabularnewline
44 & -0.055784 & -0.5797 & 0.281654 \tabularnewline
45 & -0.023883 & -0.2482 & 0.402227 \tabularnewline
46 & 0.048032 & 0.4992 & 0.309338 \tabularnewline
47 & -0.031079 & -0.323 & 0.373666 \tabularnewline
48 & 0.049411 & 0.5135 & 0.304328 \tabularnewline
49 & -0.092792 & -0.9643 & 0.168521 \tabularnewline
50 & -0.003394 & -0.0353 & 0.485965 \tabularnewline
51 & -0.011697 & -0.1216 & 0.451737 \tabularnewline
52 & -0.017707 & -0.184 & 0.427174 \tabularnewline
53 & 0.027391 & 0.2847 & 0.388225 \tabularnewline
54 & -0.103203 & -1.0725 & 0.14294 \tabularnewline
55 & -0.020198 & -0.2099 & 0.41707 \tabularnewline
56 & -0.023069 & -0.2397 & 0.405494 \tabularnewline
57 & 0.116463 & 1.2103 & 0.1144 \tabularnewline
58 & 0.100539 & 1.0448 & 0.149217 \tabularnewline
59 & -0.168401 & -1.7501 & 0.041473 \tabularnewline
60 & -0.015633 & -0.1625 & 0.435624 \tabularnewline
\hline
\end{tabular}
%Source: https://freestatistics.org/blog/index.php?pk=235708&T=2

[TABLE]
[ROW][C]Partial Autocorrelation Function[/C][/ROW]
[ROW][C]Time lag k[/C][C]PACF(k)[/C][C]T-STAT[/C][C]P-value[/C][/ROW]
[ROW][C]1[/C][C]0.021761[/C][C]0.2261[/C][C]0.410756[/C][/ROW]
[ROW][C]2[/C][C]-0.400577[/C][C]-4.1629[/C][C]3.2e-05[/C][/ROW]
[ROW][C]3[/C][C]0.010092[/C][C]0.1049[/C][C]0.458333[/C][/ROW]
[ROW][C]4[/C][C]-0.178217[/C][C]-1.8521[/C][C]0.033373[/C][/ROW]
[ROW][C]5[/C][C]-0.100316[/C][C]-1.0425[/C][C]0.149749[/C][/ROW]
[ROW][C]6[/C][C]0.132838[/C][C]1.3805[/C][C]0.085143[/C][/ROW]
[ROW][C]7[/C][C]-0.155036[/C][C]-1.6112[/C][C]0.05503[/C][/ROW]
[ROW][C]8[/C][C]0.204654[/C][C]2.1268[/C][C]0.017856[/C][/ROW]
[ROW][C]9[/C][C]-0.098211[/C][C]-1.0206[/C][C]0.154854[/C][/ROW]
[ROW][C]10[/C][C]-0.361443[/C][C]-3.7562[/C][C]0.00014[/C][/ROW]
[ROW][C]11[/C][C]0.099078[/C][C]1.0296[/C][C]0.152738[/C][/ROW]
[ROW][C]12[/C][C]0.682827[/C][C]7.0962[/C][C]0[/C][/ROW]
[ROW][C]13[/C][C]0.038413[/C][C]0.3992[/C][C]0.345267[/C][/ROW]
[ROW][C]14[/C][C]0.139112[/C][C]1.4457[/C][C]0.075579[/C][/ROW]
[ROW][C]15[/C][C]-0.096948[/C][C]-1.0075[/C][C]0.15797[/C][/ROW]
[ROW][C]16[/C][C]0.046217[/C][C]0.4803[/C][C]0.315992[/C][/ROW]
[ROW][C]17[/C][C]0.008945[/C][C]0.093[/C][C]0.463053[/C][/ROW]
[ROW][C]18[/C][C]-0.023687[/C][C]-0.2462[/C][C]0.403012[/C][/ROW]
[ROW][C]19[/C][C]-0.019188[/C][C]-0.1994[/C][C]0.421158[/C][/ROW]
[ROW][C]20[/C][C]-0.132101[/C][C]-1.3728[/C][C]0.086324[/C][/ROW]
[ROW][C]21[/C][C]-0.034446[/C][C]-0.358[/C][C]0.36053[/C][/ROW]
[ROW][C]22[/C][C]0.022979[/C][C]0.2388[/C][C]0.405857[/C][/ROW]
[ROW][C]23[/C][C]0.051625[/C][C]0.5365[/C][C]0.296356[/C][/ROW]
[ROW][C]24[/C][C]-0.085448[/C][C]-0.888[/C][C]0.188258[/C][/ROW]
[ROW][C]25[/C][C]-0.05556[/C][C]-0.5774[/C][C]0.282437[/C][/ROW]
[ROW][C]26[/C][C]0.025096[/C][C]0.2608[/C][C]0.39737[/C][/ROW]
[ROW][C]27[/C][C]-0.011519[/C][C]-0.1197[/C][C]0.452468[/C][/ROW]
[ROW][C]28[/C][C]0.021234[/C][C]0.2207[/C][C]0.412883[/C][/ROW]
[ROW][C]29[/C][C]-0.004455[/C][C]-0.0463[/C][C]0.481578[/C][/ROW]
[ROW][C]30[/C][C]-0.089348[/C][C]-0.9285[/C][C]0.177602[/C][/ROW]
[ROW][C]31[/C][C]0.054358[/C][C]0.5649[/C][C]0.286656[/C][/ROW]
[ROW][C]32[/C][C]0.051393[/C][C]0.5341[/C][C]0.297189[/C][/ROW]
[ROW][C]33[/C][C]-0.080406[/C][C]-0.8356[/C][C]0.202611[/C][/ROW]
[ROW][C]34[/C][C]-0.045048[/C][C]-0.4681[/C][C]0.320311[/C][/ROW]
[ROW][C]35[/C][C]-0.060688[/C][C]-0.6307[/C][C]0.26479[/C][/ROW]
[ROW][C]36[/C][C]-0.06094[/C][C]-0.6333[/C][C]0.263936[/C][/ROW]
[ROW][C]37[/C][C]0.05501[/C][C]0.5717[/C][C]0.284362[/C][/ROW]
[ROW][C]38[/C][C]-0.086524[/C][C]-0.8992[/C][C]0.185278[/C][/ROW]
[ROW][C]39[/C][C]-0.014664[/C][C]-0.1524[/C][C]0.439581[/C][/ROW]
[ROW][C]40[/C][C]-0.047726[/C][C]-0.496[/C][C]0.310457[/C][/ROW]
[ROW][C]41[/C][C]-0.004321[/C][C]-0.0449[/C][C]0.482135[/C][/ROW]
[ROW][C]42[/C][C]0.018854[/C][C]0.1959[/C][C]0.422516[/C][/ROW]
[ROW][C]43[/C][C]0.031747[/C][C]0.3299[/C][C]0.371049[/C][/ROW]
[ROW][C]44[/C][C]-0.055784[/C][C]-0.5797[/C][C]0.281654[/C][/ROW]
[ROW][C]45[/C][C]-0.023883[/C][C]-0.2482[/C][C]0.402227[/C][/ROW]
[ROW][C]46[/C][C]0.048032[/C][C]0.4992[/C][C]0.309338[/C][/ROW]
[ROW][C]47[/C][C]-0.031079[/C][C]-0.323[/C][C]0.373666[/C][/ROW]
[ROW][C]48[/C][C]0.049411[/C][C]0.5135[/C][C]0.304328[/C][/ROW]
[ROW][C]49[/C][C]-0.092792[/C][C]-0.9643[/C][C]0.168521[/C][/ROW]
[ROW][C]50[/C][C]-0.003394[/C][C]-0.0353[/C][C]0.485965[/C][/ROW]
[ROW][C]51[/C][C]-0.011697[/C][C]-0.1216[/C][C]0.451737[/C][/ROW]
[ROW][C]52[/C][C]-0.017707[/C][C]-0.184[/C][C]0.427174[/C][/ROW]
[ROW][C]53[/C][C]0.027391[/C][C]0.2847[/C][C]0.388225[/C][/ROW]
[ROW][C]54[/C][C]-0.103203[/C][C]-1.0725[/C][C]0.14294[/C][/ROW]
[ROW][C]55[/C][C]-0.020198[/C][C]-0.2099[/C][C]0.41707[/C][/ROW]
[ROW][C]56[/C][C]-0.023069[/C][C]-0.2397[/C][C]0.405494[/C][/ROW]
[ROW][C]57[/C][C]0.116463[/C][C]1.2103[/C][C]0.1144[/C][/ROW]
[ROW][C]58[/C][C]0.100539[/C][C]1.0448[/C][C]0.149217[/C][/ROW]
[ROW][C]59[/C][C]-0.168401[/C][C]-1.7501[/C][C]0.041473[/C][/ROW]
[ROW][C]60[/C][C]-0.015633[/C][C]-0.1625[/C][C]0.435624[/C][/ROW]
[/TABLE]
Source: https://freestatistics.org/blog/index.php?pk=235708&T=2

Globally Unique Identifier (entire table): ba.freestatistics.org/blog/index.php?pk=235708&T=2

As an alternative you can also use a QR Code:  

The GUIDs for individual cells are displayed in the table below:

Partial Autocorrelation Function
Time lag kPACF(k)T-STATP-value
10.0217610.22610.410756
2-0.400577-4.16293.2e-05
30.0100920.10490.458333
4-0.178217-1.85210.033373
5-0.100316-1.04250.149749
60.1328381.38050.085143
7-0.155036-1.61120.05503
80.2046542.12680.017856
9-0.098211-1.02060.154854
10-0.361443-3.75620.00014
110.0990781.02960.152738
120.6828277.09620
130.0384130.39920.345267
140.1391121.44570.075579
15-0.096948-1.00750.15797
160.0462170.48030.315992
170.0089450.0930.463053
18-0.023687-0.24620.403012
19-0.019188-0.19940.421158
20-0.132101-1.37280.086324
21-0.034446-0.3580.36053
220.0229790.23880.405857
230.0516250.53650.296356
24-0.085448-0.8880.188258
25-0.05556-0.57740.282437
260.0250960.26080.39737
27-0.011519-0.11970.452468
280.0212340.22070.412883
29-0.004455-0.04630.481578
30-0.089348-0.92850.177602
310.0543580.56490.286656
320.0513930.53410.297189
33-0.080406-0.83560.202611
34-0.045048-0.46810.320311
35-0.060688-0.63070.26479
36-0.06094-0.63330.263936
370.055010.57170.284362
38-0.086524-0.89920.185278
39-0.014664-0.15240.439581
40-0.047726-0.4960.310457
41-0.004321-0.04490.482135
420.0188540.19590.422516
430.0317470.32990.371049
44-0.055784-0.57970.281654
45-0.023883-0.24820.402227
460.0480320.49920.309338
47-0.031079-0.3230.373666
480.0494110.51350.304328
49-0.092792-0.96430.168521
50-0.003394-0.03530.485965
51-0.011697-0.12160.451737
52-0.017707-0.1840.427174
530.0273910.28470.388225
54-0.103203-1.07250.14294
55-0.020198-0.20990.41707
56-0.023069-0.23970.405494
570.1164631.21030.1144
580.1005391.04480.149217
59-0.168401-1.75010.041473
60-0.015633-0.16250.435624


Parameters (Session):
par1 = 60 ; par2 = 1 ; par3 = 0 ; par4 = 0 ; par5 = 12 ; par6 = White Noise ; par7 = 0.95 ;
Parameters (R input):
par1 = 60 ; par2 = 1 ; par3 = 0 ; par4 = 0 ; par5 = 12 ; par6 = White Noise ; par7 = 0.95 ; par8 = ;
R code (references can be found in the software module):
par8 <- ''
par7 <- '0.95'
par6 <- 'White Noise'
par5 <- '12'
par4 <- '0'
par3 <- '0'
par2 <- '1'
par1 <- '48'
if (par1 == 'Default') {
par1 = 10*log10(length(x))
} else {
par1 <- as.numeric(par1)
}
par2 <- as.numeric(par2)
par3 <- as.numeric(par3)
par4 <- as.numeric(par4)
par5 <- as.numeric(par5)
if (par6 == 'White Noise') par6 <- 'white' else par6 <- 'ma'
par7 <- as.numeric(par7)
if (par8 != '') par8 <- as.numeric(par8)
ox <- x
if (par8 == '') {
if (par2 == 0) {
x <- log(x)
} else {
x <- (x ^ par2 - 1) / par2
}
} else {
x <- log(x,base=par8)
}
if (par3 > 0) x <- diff(x,lag=1,difference=par3)
if (par4 > 0) x <- diff(x,lag=par5,difference=par4)
bitmap(file='picts.png')
op <- par(mfrow=c(2,1))
plot(ox,type='l',main='Original Time Series',xlab='time',ylab='value')
if (par8=='') {
mytitle <- paste('Working Time Series (lambda=',par2,', d=',par3,', D=',par4,')',sep='')
mysub <- paste('(lambda=',par2,', d=',par3,', D=',par4,', CI=', par7, ', CI type=',par6,')',sep='')
} else {
mytitle <- paste('Working Time Series (base=',par8,', d=',par3,', D=',par4,')',sep='')
mysub <- paste('(base=',par8,', d=',par3,', D=',par4,', CI=', par7, ', CI type=',par6,')',sep='')
}
plot(x,type='l', main=mytitle,xlab='time',ylab='value')
par(op)
dev.off()
bitmap(file='pic1.png')
racf <- acf(x, par1, main='Autocorrelation', xlab='time lag', ylab='ACF', ci.type=par6, ci=par7, sub=mysub)
dev.off()
bitmap(file='pic2.png')
rpacf <- pacf(x,par1,main='Partial Autocorrelation',xlab='lags',ylab='PACF',sub=mysub)
dev.off()
(myacf <- c(racf$acf))
(mypacf <- c(rpacf$acf))
lengthx <- length(x)
sqrtn <- sqrt(lengthx)
load(file='createtable')
a<-table.start()
a<-table.row.start(a)
a<-table.element(a,'Autocorrelation Function',4,TRUE)
a<-table.row.end(a)
a<-table.row.start(a)
a<-table.element(a,'Time lag k',header=TRUE)
a<-table.element(a,hyperlink('basics.htm','ACF(k)','click here for more information about the Autocorrelation Function'),header=TRUE)
a<-table.element(a,'T-STAT',header=TRUE)
a<-table.element(a,'P-value',header=TRUE)
a<-table.row.end(a)
for (i in 2:(par1+1)) {
a<-table.row.start(a)
a<-table.element(a,i-1,header=TRUE)
a<-table.element(a,round(myacf[i],6))
mytstat <- myacf[i]*sqrtn
a<-table.element(a,round(mytstat,4))
a<-table.element(a,round(1-pt(abs(mytstat),lengthx),6))
a<-table.row.end(a)
}
a<-table.end(a)
table.save(a,file='mytable.tab')
a<-table.start()
a<-table.row.start(a)
a<-table.element(a,'Partial Autocorrelation Function',4,TRUE)
a<-table.row.end(a)
a<-table.row.start(a)
a<-table.element(a,'Time lag k',header=TRUE)
a<-table.element(a,hyperlink('basics.htm','PACF(k)','click here for more information about the Partial Autocorrelation Function'),header=TRUE)
a<-table.element(a,'T-STAT',header=TRUE)
a<-table.element(a,'P-value',header=TRUE)
a<-table.row.end(a)
for (i in 1:par1) {
a<-table.row.start(a)
a<-table.element(a,i,header=TRUE)
a<-table.element(a,round(mypacf[i],6))
mytstat <- mypacf[i]*sqrtn
a<-table.element(a,round(mytstat,4))
a<-table.element(a,round(1-pt(abs(mytstat),lengthx),6))
a<-table.row.end(a)
}
a<-table.end(a)
table.save(a,file='mytable1.tab')