Free Statistics

of Irreproducible Research!

Author's title

Author*Unverified author*
R Software Modulerwasp_autocorrelation.wasp
Title produced by software(Partial) Autocorrelation Function
Date of computationMon, 18 Aug 2014 12:51:48 +0100
Cite this page as followsStatistical Computations at FreeStatistics.org, Office for Research Development and Education, URL https://freestatistics.org/blog/index.php?v=date/2014/Aug/18/t1408362734vudb67f14g8az50.htm/, Retrieved Thu, 16 May 2024 13:20:55 +0000
Statistical Computations at FreeStatistics.org, Office for Research Development and Education, URL https://freestatistics.org/blog/index.php?pk=235709, Retrieved Thu, 16 May 2024 13:20:55 +0000
QR Codes:

Original text written by user:
IsPrivate?No (this computation is public)
User-defined keywordsVan Reusel Raphael
Estimated Impact70
Family? (F = Feedback message, R = changed R code, M = changed R Module, P = changed Parameters, D = changed Data)
-       [(Partial) Autocorrelation Function] [Tijdreeks 2] [2014-08-18 11:51:48] [bf566d88435d8cc6ce5d208f6f8dd684] [Current]
Feedback Forum

Post a new message
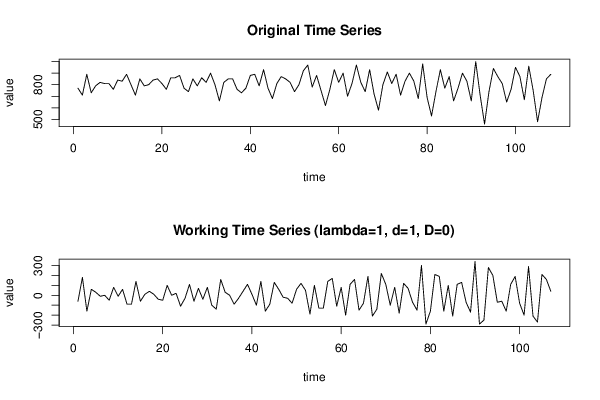
Dataseries X:
770
710
890
730
790
820
810
810
760
840
830
890
800
710
850
790
800
840
850
810
760
860
860
880
770
740
850
790
860
820
900
800
660
820
850
850
760
730
770
880
890
790
930
770
680
810
870
850
820
740
800
920
970
780
880
750
620
760
930
820
900
700
810
970
820
740
930
720
580
800
910
810
890
710
830
900
830
680
980
690
530
740
930
770
870
660
770
900
830
660
1000
710
460
740
940
870
810
650
760
950
870
670
960
750
480
690
850
890


Summary of computational transaction
Raw Inputview raw input (R code)
Raw Outputview raw output of R engine
Computing time2 seconds
R Server'Herman Ole Andreas Wold' @ wold.wessa.net

\begin{tabular}{lllllllll}
\hline
Summary of computational transaction \tabularnewline
Raw Input & view raw input (R code)  \tabularnewline
Raw Output & view raw output of R engine  \tabularnewline
Computing time & 2 seconds \tabularnewline
R Server & 'Herman Ole Andreas Wold' @ wold.wessa.net \tabularnewline
\hline
\end{tabular}
%Source: https://freestatistics.org/blog/index.php?pk=235709&T=0

[TABLE]
[ROW][C]Summary of computational transaction[/C][/ROW]
[ROW][C]Raw Input[/C][C]view raw input (R code) [/C][/ROW]
[ROW][C]Raw Output[/C][C]view raw output of R engine [/C][/ROW]
[ROW][C]Computing time[/C][C]2 seconds[/C][/ROW]
[ROW][C]R Server[/C][C]'Herman Ole Andreas Wold' @ wold.wessa.net[/C][/ROW]
[/TABLE]
Source: https://freestatistics.org/blog/index.php?pk=235709&T=0

Globally Unique Identifier (entire table): ba.freestatistics.org/blog/index.php?pk=235709&T=0

As an alternative you can also use a QR Code:  

The GUIDs for individual cells are displayed in the table below:

Summary of computational transaction
Raw Inputview raw input (R code)
Raw Outputview raw output of R engine
Computing time2 seconds
R Server'Herman Ole Andreas Wold' @ wold.wessa.net


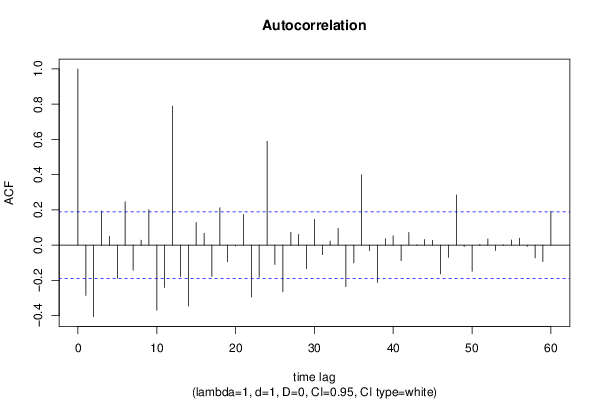
Autocorrelation Function
Time lag kACF(k)T-STATP-value
1-0.284992-2.9480.001964
2-0.405707-4.19672.8e-05
30.1936662.00330.023837
40.0506860.52430.300578
5-0.188228-1.9470.027075
60.2462422.54720.006141
7-0.14199-1.46880.072417
80.0284470.29430.384566
90.2012142.08140.019893
10-0.369045-3.81740.000113
11-0.24075-2.49030.00715
120.7890378.16190
13-0.177465-1.83570.034589
14-0.344473-3.56330.000274
150.1291911.33640.092133
160.0668090.69110.245506
17-0.177334-1.83440.03469
180.2127572.20080.01495
19-0.093808-0.97040.167027
20-0.004847-0.05010.480055
210.1744371.80440.036992
22-0.294772-3.04910.001446
23-0.181716-1.87970.031436
240.5901516.10460
25-0.109046-1.1280.130926
26-0.264105-2.73190.003684
270.0736720.76210.223847
280.0610770.63180.264439
29-0.13326-1.37850.08547
300.1463321.51370.066529
31-0.05373-0.55580.289758
320.0231180.23910.405731
330.0954430.98730.162868
34-0.235588-2.43690.008231
35-0.100799-1.04270.149725
360.3989394.12673.7e-05
37-0.03151-0.32590.372554
38-0.211791-2.19080.015318
390.0364320.37690.353515
400.053090.54920.292019
41-0.088022-0.91050.182302
420.0718470.74320.229498
430.0023030.02380.490521
440.0320240.33130.370547
450.0271810.28120.389565
46-0.162944-1.68550.047402
47-0.069373-0.71760.237282
480.2849832.94790.001964
49-0.007487-0.07740.469207
50-0.147971-1.53060.064407
510.0041690.04310.482842
520.0348420.36040.359625
53-0.029938-0.30970.378703
54-0.000796-0.00820.496723
550.0296520.30670.379825
560.0392710.40620.342697
57-0.007026-0.07270.471098
58-0.072087-0.74570.22875
59-0.092908-0.96110.169346
600.1915531.98140.025054

\begin{tabular}{lllllllll}
\hline
Autocorrelation Function \tabularnewline
Time lag k & ACF(k) & T-STAT & P-value \tabularnewline
1 & -0.284992 & -2.948 & 0.001964 \tabularnewline
2 & -0.405707 & -4.1967 & 2.8e-05 \tabularnewline
3 & 0.193666 & 2.0033 & 0.023837 \tabularnewline
4 & 0.050686 & 0.5243 & 0.300578 \tabularnewline
5 & -0.188228 & -1.947 & 0.027075 \tabularnewline
6 & 0.246242 & 2.5472 & 0.006141 \tabularnewline
7 & -0.14199 & -1.4688 & 0.072417 \tabularnewline
8 & 0.028447 & 0.2943 & 0.384566 \tabularnewline
9 & 0.201214 & 2.0814 & 0.019893 \tabularnewline
10 & -0.369045 & -3.8174 & 0.000113 \tabularnewline
11 & -0.24075 & -2.4903 & 0.00715 \tabularnewline
12 & 0.789037 & 8.1619 & 0 \tabularnewline
13 & -0.177465 & -1.8357 & 0.034589 \tabularnewline
14 & -0.344473 & -3.5633 & 0.000274 \tabularnewline
15 & 0.129191 & 1.3364 & 0.092133 \tabularnewline
16 & 0.066809 & 0.6911 & 0.245506 \tabularnewline
17 & -0.177334 & -1.8344 & 0.03469 \tabularnewline
18 & 0.212757 & 2.2008 & 0.01495 \tabularnewline
19 & -0.093808 & -0.9704 & 0.167027 \tabularnewline
20 & -0.004847 & -0.0501 & 0.480055 \tabularnewline
21 & 0.174437 & 1.8044 & 0.036992 \tabularnewline
22 & -0.294772 & -3.0491 & 0.001446 \tabularnewline
23 & -0.181716 & -1.8797 & 0.031436 \tabularnewline
24 & 0.590151 & 6.1046 & 0 \tabularnewline
25 & -0.109046 & -1.128 & 0.130926 \tabularnewline
26 & -0.264105 & -2.7319 & 0.003684 \tabularnewline
27 & 0.073672 & 0.7621 & 0.223847 \tabularnewline
28 & 0.061077 & 0.6318 & 0.264439 \tabularnewline
29 & -0.13326 & -1.3785 & 0.08547 \tabularnewline
30 & 0.146332 & 1.5137 & 0.066529 \tabularnewline
31 & -0.05373 & -0.5558 & 0.289758 \tabularnewline
32 & 0.023118 & 0.2391 & 0.405731 \tabularnewline
33 & 0.095443 & 0.9873 & 0.162868 \tabularnewline
34 & -0.235588 & -2.4369 & 0.008231 \tabularnewline
35 & -0.100799 & -1.0427 & 0.149725 \tabularnewline
36 & 0.398939 & 4.1267 & 3.7e-05 \tabularnewline
37 & -0.03151 & -0.3259 & 0.372554 \tabularnewline
38 & -0.211791 & -2.1908 & 0.015318 \tabularnewline
39 & 0.036432 & 0.3769 & 0.353515 \tabularnewline
40 & 0.05309 & 0.5492 & 0.292019 \tabularnewline
41 & -0.088022 & -0.9105 & 0.182302 \tabularnewline
42 & 0.071847 & 0.7432 & 0.229498 \tabularnewline
43 & 0.002303 & 0.0238 & 0.490521 \tabularnewline
44 & 0.032024 & 0.3313 & 0.370547 \tabularnewline
45 & 0.027181 & 0.2812 & 0.389565 \tabularnewline
46 & -0.162944 & -1.6855 & 0.047402 \tabularnewline
47 & -0.069373 & -0.7176 & 0.237282 \tabularnewline
48 & 0.284983 & 2.9479 & 0.001964 \tabularnewline
49 & -0.007487 & -0.0774 & 0.469207 \tabularnewline
50 & -0.147971 & -1.5306 & 0.064407 \tabularnewline
51 & 0.004169 & 0.0431 & 0.482842 \tabularnewline
52 & 0.034842 & 0.3604 & 0.359625 \tabularnewline
53 & -0.029938 & -0.3097 & 0.378703 \tabularnewline
54 & -0.000796 & -0.0082 & 0.496723 \tabularnewline
55 & 0.029652 & 0.3067 & 0.379825 \tabularnewline
56 & 0.039271 & 0.4062 & 0.342697 \tabularnewline
57 & -0.007026 & -0.0727 & 0.471098 \tabularnewline
58 & -0.072087 & -0.7457 & 0.22875 \tabularnewline
59 & -0.092908 & -0.9611 & 0.169346 \tabularnewline
60 & 0.191553 & 1.9814 & 0.025054 \tabularnewline
\hline
\end{tabular}
%Source: https://freestatistics.org/blog/index.php?pk=235709&T=1

[TABLE]
[ROW][C]Autocorrelation Function[/C][/ROW]
[ROW][C]Time lag k[/C][C]ACF(k)[/C][C]T-STAT[/C][C]P-value[/C][/ROW]
[ROW][C]1[/C][C]-0.284992[/C][C]-2.948[/C][C]0.001964[/C][/ROW]
[ROW][C]2[/C][C]-0.405707[/C][C]-4.1967[/C][C]2.8e-05[/C][/ROW]
[ROW][C]3[/C][C]0.193666[/C][C]2.0033[/C][C]0.023837[/C][/ROW]
[ROW][C]4[/C][C]0.050686[/C][C]0.5243[/C][C]0.300578[/C][/ROW]
[ROW][C]5[/C][C]-0.188228[/C][C]-1.947[/C][C]0.027075[/C][/ROW]
[ROW][C]6[/C][C]0.246242[/C][C]2.5472[/C][C]0.006141[/C][/ROW]
[ROW][C]7[/C][C]-0.14199[/C][C]-1.4688[/C][C]0.072417[/C][/ROW]
[ROW][C]8[/C][C]0.028447[/C][C]0.2943[/C][C]0.384566[/C][/ROW]
[ROW][C]9[/C][C]0.201214[/C][C]2.0814[/C][C]0.019893[/C][/ROW]
[ROW][C]10[/C][C]-0.369045[/C][C]-3.8174[/C][C]0.000113[/C][/ROW]
[ROW][C]11[/C][C]-0.24075[/C][C]-2.4903[/C][C]0.00715[/C][/ROW]
[ROW][C]12[/C][C]0.789037[/C][C]8.1619[/C][C]0[/C][/ROW]
[ROW][C]13[/C][C]-0.177465[/C][C]-1.8357[/C][C]0.034589[/C][/ROW]
[ROW][C]14[/C][C]-0.344473[/C][C]-3.5633[/C][C]0.000274[/C][/ROW]
[ROW][C]15[/C][C]0.129191[/C][C]1.3364[/C][C]0.092133[/C][/ROW]
[ROW][C]16[/C][C]0.066809[/C][C]0.6911[/C][C]0.245506[/C][/ROW]
[ROW][C]17[/C][C]-0.177334[/C][C]-1.8344[/C][C]0.03469[/C][/ROW]
[ROW][C]18[/C][C]0.212757[/C][C]2.2008[/C][C]0.01495[/C][/ROW]
[ROW][C]19[/C][C]-0.093808[/C][C]-0.9704[/C][C]0.167027[/C][/ROW]
[ROW][C]20[/C][C]-0.004847[/C][C]-0.0501[/C][C]0.480055[/C][/ROW]
[ROW][C]21[/C][C]0.174437[/C][C]1.8044[/C][C]0.036992[/C][/ROW]
[ROW][C]22[/C][C]-0.294772[/C][C]-3.0491[/C][C]0.001446[/C][/ROW]
[ROW][C]23[/C][C]-0.181716[/C][C]-1.8797[/C][C]0.031436[/C][/ROW]
[ROW][C]24[/C][C]0.590151[/C][C]6.1046[/C][C]0[/C][/ROW]
[ROW][C]25[/C][C]-0.109046[/C][C]-1.128[/C][C]0.130926[/C][/ROW]
[ROW][C]26[/C][C]-0.264105[/C][C]-2.7319[/C][C]0.003684[/C][/ROW]
[ROW][C]27[/C][C]0.073672[/C][C]0.7621[/C][C]0.223847[/C][/ROW]
[ROW][C]28[/C][C]0.061077[/C][C]0.6318[/C][C]0.264439[/C][/ROW]
[ROW][C]29[/C][C]-0.13326[/C][C]-1.3785[/C][C]0.08547[/C][/ROW]
[ROW][C]30[/C][C]0.146332[/C][C]1.5137[/C][C]0.066529[/C][/ROW]
[ROW][C]31[/C][C]-0.05373[/C][C]-0.5558[/C][C]0.289758[/C][/ROW]
[ROW][C]32[/C][C]0.023118[/C][C]0.2391[/C][C]0.405731[/C][/ROW]
[ROW][C]33[/C][C]0.095443[/C][C]0.9873[/C][C]0.162868[/C][/ROW]
[ROW][C]34[/C][C]-0.235588[/C][C]-2.4369[/C][C]0.008231[/C][/ROW]
[ROW][C]35[/C][C]-0.100799[/C][C]-1.0427[/C][C]0.149725[/C][/ROW]
[ROW][C]36[/C][C]0.398939[/C][C]4.1267[/C][C]3.7e-05[/C][/ROW]
[ROW][C]37[/C][C]-0.03151[/C][C]-0.3259[/C][C]0.372554[/C][/ROW]
[ROW][C]38[/C][C]-0.211791[/C][C]-2.1908[/C][C]0.015318[/C][/ROW]
[ROW][C]39[/C][C]0.036432[/C][C]0.3769[/C][C]0.353515[/C][/ROW]
[ROW][C]40[/C][C]0.05309[/C][C]0.5492[/C][C]0.292019[/C][/ROW]
[ROW][C]41[/C][C]-0.088022[/C][C]-0.9105[/C][C]0.182302[/C][/ROW]
[ROW][C]42[/C][C]0.071847[/C][C]0.7432[/C][C]0.229498[/C][/ROW]
[ROW][C]43[/C][C]0.002303[/C][C]0.0238[/C][C]0.490521[/C][/ROW]
[ROW][C]44[/C][C]0.032024[/C][C]0.3313[/C][C]0.370547[/C][/ROW]
[ROW][C]45[/C][C]0.027181[/C][C]0.2812[/C][C]0.389565[/C][/ROW]
[ROW][C]46[/C][C]-0.162944[/C][C]-1.6855[/C][C]0.047402[/C][/ROW]
[ROW][C]47[/C][C]-0.069373[/C][C]-0.7176[/C][C]0.237282[/C][/ROW]
[ROW][C]48[/C][C]0.284983[/C][C]2.9479[/C][C]0.001964[/C][/ROW]
[ROW][C]49[/C][C]-0.007487[/C][C]-0.0774[/C][C]0.469207[/C][/ROW]
[ROW][C]50[/C][C]-0.147971[/C][C]-1.5306[/C][C]0.064407[/C][/ROW]
[ROW][C]51[/C][C]0.004169[/C][C]0.0431[/C][C]0.482842[/C][/ROW]
[ROW][C]52[/C][C]0.034842[/C][C]0.3604[/C][C]0.359625[/C][/ROW]
[ROW][C]53[/C][C]-0.029938[/C][C]-0.3097[/C][C]0.378703[/C][/ROW]
[ROW][C]54[/C][C]-0.000796[/C][C]-0.0082[/C][C]0.496723[/C][/ROW]
[ROW][C]55[/C][C]0.029652[/C][C]0.3067[/C][C]0.379825[/C][/ROW]
[ROW][C]56[/C][C]0.039271[/C][C]0.4062[/C][C]0.342697[/C][/ROW]
[ROW][C]57[/C][C]-0.007026[/C][C]-0.0727[/C][C]0.471098[/C][/ROW]
[ROW][C]58[/C][C]-0.072087[/C][C]-0.7457[/C][C]0.22875[/C][/ROW]
[ROW][C]59[/C][C]-0.092908[/C][C]-0.9611[/C][C]0.169346[/C][/ROW]
[ROW][C]60[/C][C]0.191553[/C][C]1.9814[/C][C]0.025054[/C][/ROW]
[/TABLE]
Source: https://freestatistics.org/blog/index.php?pk=235709&T=1

Globally Unique Identifier (entire table): ba.freestatistics.org/blog/index.php?pk=235709&T=1

As an alternative you can also use a QR Code:  

The GUIDs for individual cells are displayed in the table below:

Autocorrelation Function
Time lag kACF(k)T-STATP-value
1-0.284992-2.9480.001964
2-0.405707-4.19672.8e-05
30.1936662.00330.023837
40.0506860.52430.300578
5-0.188228-1.9470.027075
60.2462422.54720.006141
7-0.14199-1.46880.072417
80.0284470.29430.384566
90.2012142.08140.019893
10-0.369045-3.81740.000113
11-0.24075-2.49030.00715
120.7890378.16190
13-0.177465-1.83570.034589
14-0.344473-3.56330.000274
150.1291911.33640.092133
160.0668090.69110.245506
17-0.177334-1.83440.03469
180.2127572.20080.01495
19-0.093808-0.97040.167027
20-0.004847-0.05010.480055
210.1744371.80440.036992
22-0.294772-3.04910.001446
23-0.181716-1.87970.031436
240.5901516.10460
25-0.109046-1.1280.130926
26-0.264105-2.73190.003684
270.0736720.76210.223847
280.0610770.63180.264439
29-0.13326-1.37850.08547
300.1463321.51370.066529
31-0.05373-0.55580.289758
320.0231180.23910.405731
330.0954430.98730.162868
34-0.235588-2.43690.008231
35-0.100799-1.04270.149725
360.3989394.12673.7e-05
37-0.03151-0.32590.372554
38-0.211791-2.19080.015318
390.0364320.37690.353515
400.053090.54920.292019
41-0.088022-0.91050.182302
420.0718470.74320.229498
430.0023030.02380.490521
440.0320240.33130.370547
450.0271810.28120.389565
46-0.162944-1.68550.047402
47-0.069373-0.71760.237282
480.2849832.94790.001964
49-0.007487-0.07740.469207
50-0.147971-1.53060.064407
510.0041690.04310.482842
520.0348420.36040.359625
53-0.029938-0.30970.378703
54-0.000796-0.00820.496723
550.0296520.30670.379825
560.0392710.40620.342697
57-0.007026-0.07270.471098
58-0.072087-0.74570.22875
59-0.092908-0.96110.169346
600.1915531.98140.025054


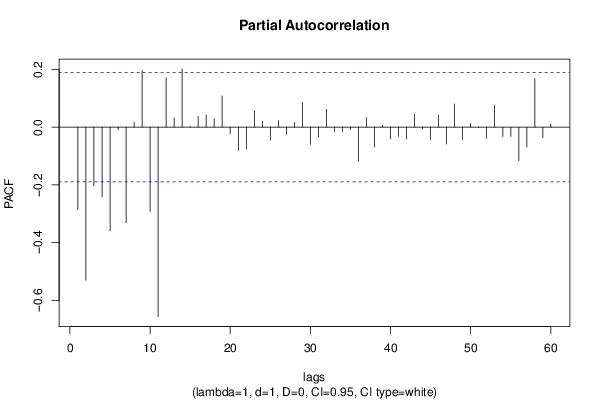
Partial Autocorrelation Function
Time lag kPACF(k)T-STATP-value
1-0.284992-2.9480.001964
2-0.529972-5.48210
3-0.203219-2.10210.018945
4-0.241368-2.49670.00703
5-0.358653-3.70990.000165
6-0.009448-0.09770.461165
7-0.330643-3.42020.000443
80.016730.17310.431466
90.1964882.03250.022291
10-0.291651-3.01690.001596
11-0.656298-6.78880
120.1714781.77380.039472
130.031690.32780.37185
140.2016472.08590.019685
150.000640.00660.497363
160.0372930.38580.350218
170.0423470.4380.33112
180.0291010.3010.381991
190.1078141.11520.133623
20-0.023134-0.23930.405666
21-0.079986-0.82740.204932
22-0.075429-0.78020.218484
230.0563820.58320.280485
240.020670.21380.415549
25-0.044426-0.45950.323388
260.0232080.24010.40537
27-0.024921-0.25780.398536
280.0165370.17110.432252
290.085760.88710.188505
30-0.059317-0.61360.270398
31-0.034255-0.35430.361892
320.0617730.6390.262099
33-0.01531-0.15840.437235
34-0.015159-0.15680.437848
35-0.008207-0.08490.466251
36-0.118297-1.22370.111882
370.0327960.33920.367543
38-0.068941-0.71310.238657
390.0054590.05650.477538
40-0.040701-0.4210.337296
41-0.031577-0.32660.37229
42-0.041221-0.42640.33534
430.0448490.46390.321821
44-0.005817-0.06020.476064
45-0.04297-0.44450.328795
460.0413290.42750.334934
47-0.0585-0.60510.273188
480.0803350.8310.203916
49-0.042986-0.44470.328734
500.0128960.13340.447067
51-0.001969-0.02040.491892
52-0.038692-0.40020.344891
530.076780.79420.214414
54-0.032189-0.3330.369908
55-0.032013-0.33110.370592
56-0.116175-1.20170.116063
57-0.068226-0.70570.240945
580.1678211.7360.042725
59-0.035536-0.36760.356955
600.0100620.10410.458649

\begin{tabular}{lllllllll}
\hline
Partial Autocorrelation Function \tabularnewline
Time lag k & PACF(k) & T-STAT & P-value \tabularnewline
1 & -0.284992 & -2.948 & 0.001964 \tabularnewline
2 & -0.529972 & -5.4821 & 0 \tabularnewline
3 & -0.203219 & -2.1021 & 0.018945 \tabularnewline
4 & -0.241368 & -2.4967 & 0.00703 \tabularnewline
5 & -0.358653 & -3.7099 & 0.000165 \tabularnewline
6 & -0.009448 & -0.0977 & 0.461165 \tabularnewline
7 & -0.330643 & -3.4202 & 0.000443 \tabularnewline
8 & 0.01673 & 0.1731 & 0.431466 \tabularnewline
9 & 0.196488 & 2.0325 & 0.022291 \tabularnewline
10 & -0.291651 & -3.0169 & 0.001596 \tabularnewline
11 & -0.656298 & -6.7888 & 0 \tabularnewline
12 & 0.171478 & 1.7738 & 0.039472 \tabularnewline
13 & 0.03169 & 0.3278 & 0.37185 \tabularnewline
14 & 0.201647 & 2.0859 & 0.019685 \tabularnewline
15 & 0.00064 & 0.0066 & 0.497363 \tabularnewline
16 & 0.037293 & 0.3858 & 0.350218 \tabularnewline
17 & 0.042347 & 0.438 & 0.33112 \tabularnewline
18 & 0.029101 & 0.301 & 0.381991 \tabularnewline
19 & 0.107814 & 1.1152 & 0.133623 \tabularnewline
20 & -0.023134 & -0.2393 & 0.405666 \tabularnewline
21 & -0.079986 & -0.8274 & 0.204932 \tabularnewline
22 & -0.075429 & -0.7802 & 0.218484 \tabularnewline
23 & 0.056382 & 0.5832 & 0.280485 \tabularnewline
24 & 0.02067 & 0.2138 & 0.415549 \tabularnewline
25 & -0.044426 & -0.4595 & 0.323388 \tabularnewline
26 & 0.023208 & 0.2401 & 0.40537 \tabularnewline
27 & -0.024921 & -0.2578 & 0.398536 \tabularnewline
28 & 0.016537 & 0.1711 & 0.432252 \tabularnewline
29 & 0.08576 & 0.8871 & 0.188505 \tabularnewline
30 & -0.059317 & -0.6136 & 0.270398 \tabularnewline
31 & -0.034255 & -0.3543 & 0.361892 \tabularnewline
32 & 0.061773 & 0.639 & 0.262099 \tabularnewline
33 & -0.01531 & -0.1584 & 0.437235 \tabularnewline
34 & -0.015159 & -0.1568 & 0.437848 \tabularnewline
35 & -0.008207 & -0.0849 & 0.466251 \tabularnewline
36 & -0.118297 & -1.2237 & 0.111882 \tabularnewline
37 & 0.032796 & 0.3392 & 0.367543 \tabularnewline
38 & -0.068941 & -0.7131 & 0.238657 \tabularnewline
39 & 0.005459 & 0.0565 & 0.477538 \tabularnewline
40 & -0.040701 & -0.421 & 0.337296 \tabularnewline
41 & -0.031577 & -0.3266 & 0.37229 \tabularnewline
42 & -0.041221 & -0.4264 & 0.33534 \tabularnewline
43 & 0.044849 & 0.4639 & 0.321821 \tabularnewline
44 & -0.005817 & -0.0602 & 0.476064 \tabularnewline
45 & -0.04297 & -0.4445 & 0.328795 \tabularnewline
46 & 0.041329 & 0.4275 & 0.334934 \tabularnewline
47 & -0.0585 & -0.6051 & 0.273188 \tabularnewline
48 & 0.080335 & 0.831 & 0.203916 \tabularnewline
49 & -0.042986 & -0.4447 & 0.328734 \tabularnewline
50 & 0.012896 & 0.1334 & 0.447067 \tabularnewline
51 & -0.001969 & -0.0204 & 0.491892 \tabularnewline
52 & -0.038692 & -0.4002 & 0.344891 \tabularnewline
53 & 0.07678 & 0.7942 & 0.214414 \tabularnewline
54 & -0.032189 & -0.333 & 0.369908 \tabularnewline
55 & -0.032013 & -0.3311 & 0.370592 \tabularnewline
56 & -0.116175 & -1.2017 & 0.116063 \tabularnewline
57 & -0.068226 & -0.7057 & 0.240945 \tabularnewline
58 & 0.167821 & 1.736 & 0.042725 \tabularnewline
59 & -0.035536 & -0.3676 & 0.356955 \tabularnewline
60 & 0.010062 & 0.1041 & 0.458649 \tabularnewline
\hline
\end{tabular}
%Source: https://freestatistics.org/blog/index.php?pk=235709&T=2

[TABLE]
[ROW][C]Partial Autocorrelation Function[/C][/ROW]
[ROW][C]Time lag k[/C][C]PACF(k)[/C][C]T-STAT[/C][C]P-value[/C][/ROW]
[ROW][C]1[/C][C]-0.284992[/C][C]-2.948[/C][C]0.001964[/C][/ROW]
[ROW][C]2[/C][C]-0.529972[/C][C]-5.4821[/C][C]0[/C][/ROW]
[ROW][C]3[/C][C]-0.203219[/C][C]-2.1021[/C][C]0.018945[/C][/ROW]
[ROW][C]4[/C][C]-0.241368[/C][C]-2.4967[/C][C]0.00703[/C][/ROW]
[ROW][C]5[/C][C]-0.358653[/C][C]-3.7099[/C][C]0.000165[/C][/ROW]
[ROW][C]6[/C][C]-0.009448[/C][C]-0.0977[/C][C]0.461165[/C][/ROW]
[ROW][C]7[/C][C]-0.330643[/C][C]-3.4202[/C][C]0.000443[/C][/ROW]
[ROW][C]8[/C][C]0.01673[/C][C]0.1731[/C][C]0.431466[/C][/ROW]
[ROW][C]9[/C][C]0.196488[/C][C]2.0325[/C][C]0.022291[/C][/ROW]
[ROW][C]10[/C][C]-0.291651[/C][C]-3.0169[/C][C]0.001596[/C][/ROW]
[ROW][C]11[/C][C]-0.656298[/C][C]-6.7888[/C][C]0[/C][/ROW]
[ROW][C]12[/C][C]0.171478[/C][C]1.7738[/C][C]0.039472[/C][/ROW]
[ROW][C]13[/C][C]0.03169[/C][C]0.3278[/C][C]0.37185[/C][/ROW]
[ROW][C]14[/C][C]0.201647[/C][C]2.0859[/C][C]0.019685[/C][/ROW]
[ROW][C]15[/C][C]0.00064[/C][C]0.0066[/C][C]0.497363[/C][/ROW]
[ROW][C]16[/C][C]0.037293[/C][C]0.3858[/C][C]0.350218[/C][/ROW]
[ROW][C]17[/C][C]0.042347[/C][C]0.438[/C][C]0.33112[/C][/ROW]
[ROW][C]18[/C][C]0.029101[/C][C]0.301[/C][C]0.381991[/C][/ROW]
[ROW][C]19[/C][C]0.107814[/C][C]1.1152[/C][C]0.133623[/C][/ROW]
[ROW][C]20[/C][C]-0.023134[/C][C]-0.2393[/C][C]0.405666[/C][/ROW]
[ROW][C]21[/C][C]-0.079986[/C][C]-0.8274[/C][C]0.204932[/C][/ROW]
[ROW][C]22[/C][C]-0.075429[/C][C]-0.7802[/C][C]0.218484[/C][/ROW]
[ROW][C]23[/C][C]0.056382[/C][C]0.5832[/C][C]0.280485[/C][/ROW]
[ROW][C]24[/C][C]0.02067[/C][C]0.2138[/C][C]0.415549[/C][/ROW]
[ROW][C]25[/C][C]-0.044426[/C][C]-0.4595[/C][C]0.323388[/C][/ROW]
[ROW][C]26[/C][C]0.023208[/C][C]0.2401[/C][C]0.40537[/C][/ROW]
[ROW][C]27[/C][C]-0.024921[/C][C]-0.2578[/C][C]0.398536[/C][/ROW]
[ROW][C]28[/C][C]0.016537[/C][C]0.1711[/C][C]0.432252[/C][/ROW]
[ROW][C]29[/C][C]0.08576[/C][C]0.8871[/C][C]0.188505[/C][/ROW]
[ROW][C]30[/C][C]-0.059317[/C][C]-0.6136[/C][C]0.270398[/C][/ROW]
[ROW][C]31[/C][C]-0.034255[/C][C]-0.3543[/C][C]0.361892[/C][/ROW]
[ROW][C]32[/C][C]0.061773[/C][C]0.639[/C][C]0.262099[/C][/ROW]
[ROW][C]33[/C][C]-0.01531[/C][C]-0.1584[/C][C]0.437235[/C][/ROW]
[ROW][C]34[/C][C]-0.015159[/C][C]-0.1568[/C][C]0.437848[/C][/ROW]
[ROW][C]35[/C][C]-0.008207[/C][C]-0.0849[/C][C]0.466251[/C][/ROW]
[ROW][C]36[/C][C]-0.118297[/C][C]-1.2237[/C][C]0.111882[/C][/ROW]
[ROW][C]37[/C][C]0.032796[/C][C]0.3392[/C][C]0.367543[/C][/ROW]
[ROW][C]38[/C][C]-0.068941[/C][C]-0.7131[/C][C]0.238657[/C][/ROW]
[ROW][C]39[/C][C]0.005459[/C][C]0.0565[/C][C]0.477538[/C][/ROW]
[ROW][C]40[/C][C]-0.040701[/C][C]-0.421[/C][C]0.337296[/C][/ROW]
[ROW][C]41[/C][C]-0.031577[/C][C]-0.3266[/C][C]0.37229[/C][/ROW]
[ROW][C]42[/C][C]-0.041221[/C][C]-0.4264[/C][C]0.33534[/C][/ROW]
[ROW][C]43[/C][C]0.044849[/C][C]0.4639[/C][C]0.321821[/C][/ROW]
[ROW][C]44[/C][C]-0.005817[/C][C]-0.0602[/C][C]0.476064[/C][/ROW]
[ROW][C]45[/C][C]-0.04297[/C][C]-0.4445[/C][C]0.328795[/C][/ROW]
[ROW][C]46[/C][C]0.041329[/C][C]0.4275[/C][C]0.334934[/C][/ROW]
[ROW][C]47[/C][C]-0.0585[/C][C]-0.6051[/C][C]0.273188[/C][/ROW]
[ROW][C]48[/C][C]0.080335[/C][C]0.831[/C][C]0.203916[/C][/ROW]
[ROW][C]49[/C][C]-0.042986[/C][C]-0.4447[/C][C]0.328734[/C][/ROW]
[ROW][C]50[/C][C]0.012896[/C][C]0.1334[/C][C]0.447067[/C][/ROW]
[ROW][C]51[/C][C]-0.001969[/C][C]-0.0204[/C][C]0.491892[/C][/ROW]
[ROW][C]52[/C][C]-0.038692[/C][C]-0.4002[/C][C]0.344891[/C][/ROW]
[ROW][C]53[/C][C]0.07678[/C][C]0.7942[/C][C]0.214414[/C][/ROW]
[ROW][C]54[/C][C]-0.032189[/C][C]-0.333[/C][C]0.369908[/C][/ROW]
[ROW][C]55[/C][C]-0.032013[/C][C]-0.3311[/C][C]0.370592[/C][/ROW]
[ROW][C]56[/C][C]-0.116175[/C][C]-1.2017[/C][C]0.116063[/C][/ROW]
[ROW][C]57[/C][C]-0.068226[/C][C]-0.7057[/C][C]0.240945[/C][/ROW]
[ROW][C]58[/C][C]0.167821[/C][C]1.736[/C][C]0.042725[/C][/ROW]
[ROW][C]59[/C][C]-0.035536[/C][C]-0.3676[/C][C]0.356955[/C][/ROW]
[ROW][C]60[/C][C]0.010062[/C][C]0.1041[/C][C]0.458649[/C][/ROW]
[/TABLE]
Source: https://freestatistics.org/blog/index.php?pk=235709&T=2

Globally Unique Identifier (entire table): ba.freestatistics.org/blog/index.php?pk=235709&T=2

As an alternative you can also use a QR Code:  

The GUIDs for individual cells are displayed in the table below:

Partial Autocorrelation Function
Time lag kPACF(k)T-STATP-value
1-0.284992-2.9480.001964
2-0.529972-5.48210
3-0.203219-2.10210.018945
4-0.241368-2.49670.00703
5-0.358653-3.70990.000165
6-0.009448-0.09770.461165
7-0.330643-3.42020.000443
80.016730.17310.431466
90.1964882.03250.022291
10-0.291651-3.01690.001596
11-0.656298-6.78880
120.1714781.77380.039472
130.031690.32780.37185
140.2016472.08590.019685
150.000640.00660.497363
160.0372930.38580.350218
170.0423470.4380.33112
180.0291010.3010.381991
190.1078141.11520.133623
20-0.023134-0.23930.405666
21-0.079986-0.82740.204932
22-0.075429-0.78020.218484
230.0563820.58320.280485
240.020670.21380.415549
25-0.044426-0.45950.323388
260.0232080.24010.40537
27-0.024921-0.25780.398536
280.0165370.17110.432252
290.085760.88710.188505
30-0.059317-0.61360.270398
31-0.034255-0.35430.361892
320.0617730.6390.262099
33-0.01531-0.15840.437235
34-0.015159-0.15680.437848
35-0.008207-0.08490.466251
36-0.118297-1.22370.111882
370.0327960.33920.367543
38-0.068941-0.71310.238657
390.0054590.05650.477538
40-0.040701-0.4210.337296
41-0.031577-0.32660.37229
42-0.041221-0.42640.33534
430.0448490.46390.321821
44-0.005817-0.06020.476064
45-0.04297-0.44450.328795
460.0413290.42750.334934
47-0.0585-0.60510.273188
480.0803350.8310.203916
49-0.042986-0.44470.328734
500.0128960.13340.447067
51-0.001969-0.02040.491892
52-0.038692-0.40020.344891
530.076780.79420.214414
54-0.032189-0.3330.369908
55-0.032013-0.33110.370592
56-0.116175-1.20170.116063
57-0.068226-0.70570.240945
580.1678211.7360.042725
59-0.035536-0.36760.356955
600.0100620.10410.458649


Parameters (Session):
par1 = 60 ; par2 = 1 ; par3 = 0 ; par4 = 0 ; par5 = 12 ; par6 = White Noise ; par7 = 0.95 ;
Parameters (R input):
par1 = 60 ; par2 = 1 ; par3 = 1 ; par4 = 0 ; par5 = 12 ; par6 = White Noise ; par7 = 0.95 ; par8 = ;
R code (references can be found in the software module):
par8 <- ''
par7 <- '0.95'
par6 <- 'White Noise'
par5 <- '12'
par4 <- '0'
par3 <- '0'
par2 <- '1'
par1 <- '60'
if (par1 == 'Default') {
par1 = 10*log10(length(x))
} else {
par1 <- as.numeric(par1)
}
par2 <- as.numeric(par2)
par3 <- as.numeric(par3)
par4 <- as.numeric(par4)
par5 <- as.numeric(par5)
if (par6 == 'White Noise') par6 <- 'white' else par6 <- 'ma'
par7 <- as.numeric(par7)
if (par8 != '') par8 <- as.numeric(par8)
ox <- x
if (par8 == '') {
if (par2 == 0) {
x <- log(x)
} else {
x <- (x ^ par2 - 1) / par2
}
} else {
x <- log(x,base=par8)
}
if (par3 > 0) x <- diff(x,lag=1,difference=par3)
if (par4 > 0) x <- diff(x,lag=par5,difference=par4)
bitmap(file='picts.png')
op <- par(mfrow=c(2,1))
plot(ox,type='l',main='Original Time Series',xlab='time',ylab='value')
if (par8=='') {
mytitle <- paste('Working Time Series (lambda=',par2,', d=',par3,', D=',par4,')',sep='')
mysub <- paste('(lambda=',par2,', d=',par3,', D=',par4,', CI=', par7, ', CI type=',par6,')',sep='')
} else {
mytitle <- paste('Working Time Series (base=',par8,', d=',par3,', D=',par4,')',sep='')
mysub <- paste('(base=',par8,', d=',par3,', D=',par4,', CI=', par7, ', CI type=',par6,')',sep='')
}
plot(x,type='l', main=mytitle,xlab='time',ylab='value')
par(op)
dev.off()
bitmap(file='pic1.png')
racf <- acf(x, par1, main='Autocorrelation', xlab='time lag', ylab='ACF', ci.type=par6, ci=par7, sub=mysub)
dev.off()
bitmap(file='pic2.png')
rpacf <- pacf(x,par1,main='Partial Autocorrelation',xlab='lags',ylab='PACF',sub=mysub)
dev.off()
(myacf <- c(racf$acf))
(mypacf <- c(rpacf$acf))
lengthx <- length(x)
sqrtn <- sqrt(lengthx)
load(file='createtable')
a<-table.start()
a<-table.row.start(a)
a<-table.element(a,'Autocorrelation Function',4,TRUE)
a<-table.row.end(a)
a<-table.row.start(a)
a<-table.element(a,'Time lag k',header=TRUE)
a<-table.element(a,hyperlink('basics.htm','ACF(k)','click here for more information about the Autocorrelation Function'),header=TRUE)
a<-table.element(a,'T-STAT',header=TRUE)
a<-table.element(a,'P-value',header=TRUE)
a<-table.row.end(a)
for (i in 2:(par1+1)) {
a<-table.row.start(a)
a<-table.element(a,i-1,header=TRUE)
a<-table.element(a,round(myacf[i],6))
mytstat <- myacf[i]*sqrtn
a<-table.element(a,round(mytstat,4))
a<-table.element(a,round(1-pt(abs(mytstat),lengthx),6))
a<-table.row.end(a)
}
a<-table.end(a)
table.save(a,file='mytable.tab')
a<-table.start()
a<-table.row.start(a)
a<-table.element(a,'Partial Autocorrelation Function',4,TRUE)
a<-table.row.end(a)
a<-table.row.start(a)
a<-table.element(a,'Time lag k',header=TRUE)
a<-table.element(a,hyperlink('basics.htm','PACF(k)','click here for more information about the Partial Autocorrelation Function'),header=TRUE)
a<-table.element(a,'T-STAT',header=TRUE)
a<-table.element(a,'P-value',header=TRUE)
a<-table.row.end(a)
for (i in 1:par1) {
a<-table.row.start(a)
a<-table.element(a,i,header=TRUE)
a<-table.element(a,round(mypacf[i],6))
mytstat <- mypacf[i]*sqrtn
a<-table.element(a,round(mytstat,4))
a<-table.element(a,round(1-pt(abs(mytstat),lengthx),6))
a<-table.row.end(a)
}
a<-table.end(a)
table.save(a,file='mytable1.tab')