Free Statistics

of Irreproducible Research!

Author's title

Author*Unverified author*
R Software Modulerwasp_correlation.wasp
Title produced by softwarePearson Correlation
Date of computationSat, 30 Aug 2014 21:25:24 +0100
Cite this page as followsStatistical Computations at FreeStatistics.org, Office for Research Development and Education, URL https://freestatistics.org/blog/index.php?v=date/2014/Aug/30/t1409430383gggl9shf3we5tr2.htm/, Retrieved Thu, 16 May 2024 16:47:20 +0000
Statistical Computations at FreeStatistics.org, Office for Research Development and Education, URL https://freestatistics.org/blog/index.php?pk=235771, Retrieved Thu, 16 May 2024 16:47:20 +0000
QR Codes:

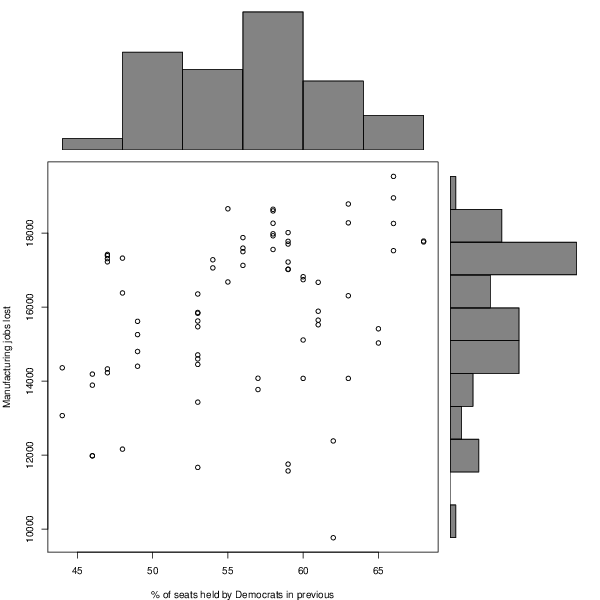
Original text written by user:% of policy-making seats held by Democrats Manufacturing job losses the following year
IsPrivate?No (this computation is public)
User-defined keywords
Estimated Impact110
Family? (F = Feedback message, R = changed R code, M = changed R Module, P = changed Parameters, D = changed Data)
-       [Pearson Correlation] [Democrats vs manu...] [2014-08-30 20:25:24] [d41d8cd98f00b204e9800998ecf8427e] [Current]
Feedback Forum

Post a new message
Dataseries X:
62
62
63
63
53
53
57
57
44
44
60
60
53
53
49
49
53
53
53
53
65
65
61
61
61
61
68
68
58
58
56
56
58
58
55
55
66
66
66
66
63
63
54
54
59
59
56
56
58
58
59
59
60
60
59
59
47
47
47
47
48
48
49
49
47
47
46
46
53
53
59
59
46
46
48
Dataseries Y:
9766
12382
14072
16306
15832
14599
13771
14076
14359
13067
14072
15110
14707
16353
14799
15614
15468
15854
14450
15623
15413
15029
15522
15646
15887
16669
17760
17784
18265
18642
17877
17126
17556
18598
18656
16678
17524
18259
18951
19531
18276
18785
17278
17059
18013
17776
17497
17593
17926
17980
17703
17015
16820
16740
17025
17217
17222
17389
17422
17308
17322
16381
15256
14401
14329
14225
14188
13889
13430
11666
11571
11755
11979
11982
12160


Summary of computational transaction
Raw Inputview raw input (R code)
Raw Outputview raw output of R engine
Computing time2 seconds
R Server'Gertrude Mary Cox' @ cox.wessa.net

\begin{tabular}{lllllllll}
\hline
Summary of computational transaction \tabularnewline
Raw Input & view raw input (R code)  \tabularnewline
Raw Output & view raw output of R engine  \tabularnewline
Computing time & 2 seconds \tabularnewline
R Server & 'Gertrude Mary Cox' @ cox.wessa.net \tabularnewline
\hline
\end{tabular}
%Source: https://freestatistics.org/blog/index.php?pk=235771&T=0

[TABLE]
[ROW][C]Summary of computational transaction[/C][/ROW]
[ROW][C]Raw Input[/C][C]view raw input (R code) [/C][/ROW]
[ROW][C]Raw Output[/C][C]view raw output of R engine [/C][/ROW]
[ROW][C]Computing time[/C][C]2 seconds[/C][/ROW]
[ROW][C]R Server[/C][C]'Gertrude Mary Cox' @ cox.wessa.net[/C][/ROW]
[/TABLE]
Source: https://freestatistics.org/blog/index.php?pk=235771&T=0

Globally Unique Identifier (entire table): ba.freestatistics.org/blog/index.php?pk=235771&T=0

As an alternative you can also use a QR Code:  

The GUIDs for individual cells are displayed in the table below:

Summary of computational transaction
Raw Inputview raw input (R code)
Raw Outputview raw output of R engine
Computing time2 seconds
R Server'Gertrude Mary Cox' @ cox.wessa.net


Pearson Product Moment Correlation - Ungrouped Data
StatisticVariable XVariable Y
Mean55.866666666666715896.4133333333
Biased Variance40.54222222222224495250.26915556
Biased Standard Deviation6.367277457612652120.20052569458
Covariance4605.13693693694
Correlation0.336575339365587
Determination0.11328295906906
T-Test3.05387456610945
p-value (2 sided)0.00315180720111119
p-value (1 sided)0.00157590360055559
Degrees of Freedom73
Number of Observations75

\begin{tabular}{lllllllll}
\hline
Pearson Product Moment Correlation - Ungrouped Data \tabularnewline
Statistic & Variable X & Variable Y \tabularnewline
Mean & 55.8666666666667 & 15896.4133333333 \tabularnewline
Biased Variance & 40.5422222222222 & 4495250.26915556 \tabularnewline
Biased Standard Deviation & 6.36727745761265 & 2120.20052569458 \tabularnewline
Covariance & 4605.13693693694 \tabularnewline
Correlation & 0.336575339365587 \tabularnewline
Determination & 0.11328295906906 \tabularnewline
T-Test & 3.05387456610945 \tabularnewline
p-value (2 sided) & 0.00315180720111119 \tabularnewline
p-value (1 sided) & 0.00157590360055559 \tabularnewline
Degrees of Freedom & 73 \tabularnewline
Number of Observations & 75 \tabularnewline
\hline
\end{tabular}
%Source: https://freestatistics.org/blog/index.php?pk=235771&T=1

[TABLE]
[ROW][C]Pearson Product Moment Correlation - Ungrouped Data[/C][/ROW]
[ROW][C]Statistic[/C][C]Variable X[/C][C]Variable Y[/C][/ROW]
[ROW][C]Mean[/C][C]55.8666666666667[/C][C]15896.4133333333[/C][/ROW]
[ROW][C]Biased Variance[/C][C]40.5422222222222[/C][C]4495250.26915556[/C][/ROW]
[ROW][C]Biased Standard Deviation[/C][C]6.36727745761265[/C][C]2120.20052569458[/C][/ROW]
[ROW][C]Covariance[/C][C]4605.13693693694[/C][/ROW]
[ROW][C]Correlation[/C][C]0.336575339365587[/C][/ROW]
[ROW][C]Determination[/C][C]0.11328295906906[/C][/ROW]
[ROW][C]T-Test[/C][C]3.05387456610945[/C][/ROW]
[ROW][C]p-value (2 sided)[/C][C]0.00315180720111119[/C][/ROW]
[ROW][C]p-value (1 sided)[/C][C]0.00157590360055559[/C][/ROW]
[ROW][C]Degrees of Freedom[/C][C]73[/C][/ROW]
[ROW][C]Number of Observations[/C][C]75[/C][/ROW]
[/TABLE]
Source: https://freestatistics.org/blog/index.php?pk=235771&T=1

Globally Unique Identifier (entire table): ba.freestatistics.org/blog/index.php?pk=235771&T=1

As an alternative you can also use a QR Code:  

The GUIDs for individual cells are displayed in the table below:

Pearson Product Moment Correlation - Ungrouped Data
StatisticVariable XVariable Y
Mean55.866666666666715896.4133333333
Biased Variance40.54222222222224495250.26915556
Biased Standard Deviation6.367277457612652120.20052569458
Covariance4605.13693693694
Correlation0.336575339365587
Determination0.11328295906906
T-Test3.05387456610945
p-value (2 sided)0.00315180720111119
p-value (1 sided)0.00157590360055559
Degrees of Freedom73
Number of Observations75


Normality Tests
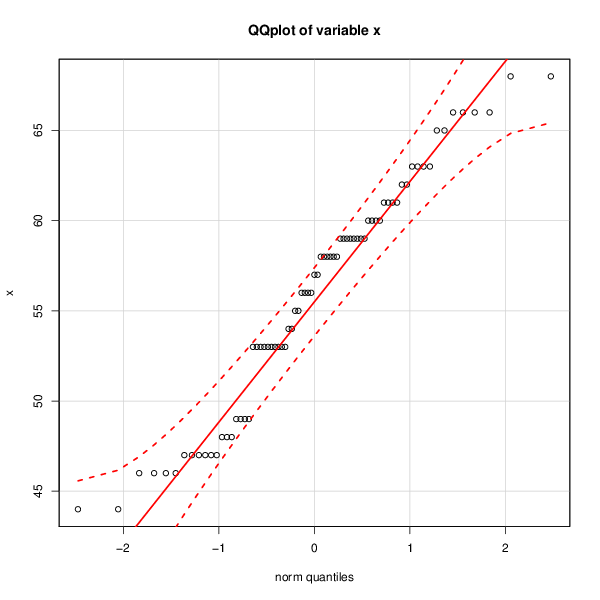
> jarque.x
	Jarque-Bera Normality Test
data:  x
JB = 2.9395, p-value = 0.23
alternative hypothesis: greater
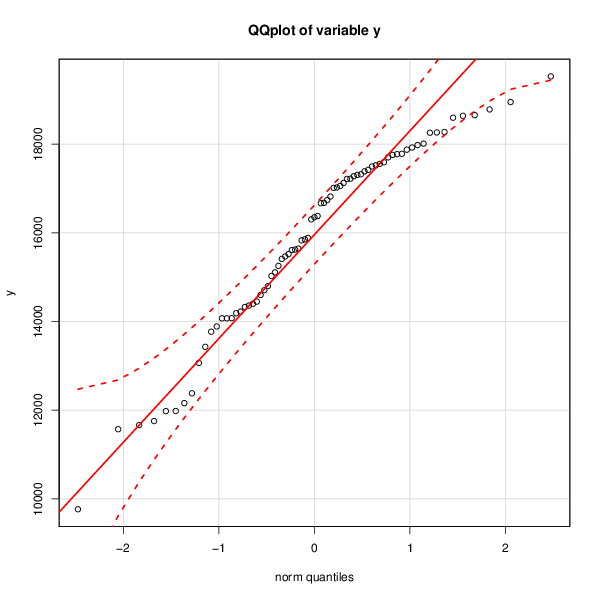
> jarque.y
	Jarque-Bera Normality Test
data:  y
JB = 5.546, p-value = 0.06247
alternative hypothesis: greater
> ad.x
	Anderson-Darling normality test
data:  x
A = 0.9685, p-value = 0.01391
> ad.y
	Anderson-Darling normality test
data:  y
A = 1.236, p-value = 0.003007

\begin{tabular}{lllllllll}
\hline
Normality Tests \tabularnewline
> jarque.x
	Jarque-Bera Normality Test
data:  x
JB = 2.9395, p-value = 0.23
alternative hypothesis: greater
\tabularnewline
> jarque.y
	Jarque-Bera Normality Test
data:  y
JB = 5.546, p-value = 0.06247
alternative hypothesis: greater
\tabularnewline
> ad.x
	Anderson-Darling normality test
data:  x
A = 0.9685, p-value = 0.01391
\tabularnewline
> ad.y
	Anderson-Darling normality test
data:  y
A = 1.236, p-value = 0.003007
\tabularnewline \hline \end{tabular} %Source: https://freestatistics.org/blog/index.php?pk=235771&T=2

[TABLE]
[ROW][C]Normality Tests[/C][/ROW]
[ROW][C]
> jarque.x
	Jarque-Bera Normality Test
data:  x
JB = 2.9395, p-value = 0.23
alternative hypothesis: greater
[/C][/ROW] [ROW][C]
> jarque.y
	Jarque-Bera Normality Test
data:  y
JB = 5.546, p-value = 0.06247
alternative hypothesis: greater
[/C][/ROW] [ROW][C]
> ad.x
	Anderson-Darling normality test
data:  x
A = 0.9685, p-value = 0.01391
[/C][/ROW] [ROW][C]
> ad.y
	Anderson-Darling normality test
data:  y
A = 1.236, p-value = 0.003007
[/C][/ROW] [/TABLE] Source: https://freestatistics.org/blog/index.php?pk=235771&T=2

Globally Unique Identifier (entire table): ba.freestatistics.org/blog/index.php?pk=235771&T=2

As an alternative you can also use a QR Code:  

The GUIDs for individual cells are displayed in the table below:

Normality Tests
> jarque.x
	Jarque-Bera Normality Test
data:  x
JB = 2.9395, p-value = 0.23
alternative hypothesis: greater
> jarque.y
	Jarque-Bera Normality Test
data:  y
JB = 5.546, p-value = 0.06247
alternative hypothesis: greater
> ad.x
	Anderson-Darling normality test
data:  x
A = 0.9685, p-value = 0.01391
> ad.y
	Anderson-Darling normality test
data:  y
A = 1.236, p-value = 0.003007


Parameters (Session):
Parameters (R input):
R code (references can be found in the software module):
x <- x[!is.na(y)]
y <- y[!is.na(y)]
y <- y[!is.na(x)]
x <- x[!is.na(x)]
bitmap(file='test1.png')
histx <- hist(x, plot=FALSE)
histy <- hist(y, plot=FALSE)
maxcounts <- max(c(histx$counts, histx$counts))
xrange <- c(min(x),max(x))
yrange <- c(min(y),max(y))
nf <- layout(matrix(c(2,0,1,3),2,2,byrow=TRUE), c(3,1), c(1,3), TRUE)
par(mar=c(4,4,1,1))
plot(x, y, xlim=xrange, ylim=yrange, xlab=xlab, ylab=ylab, sub=main)
par(mar=c(0,4,1,1))
barplot(histx$counts, axes=FALSE, ylim=c(0, maxcounts), space=0)
par(mar=c(4,0,1,1))
barplot(histy$counts, axes=FALSE, xlim=c(0, maxcounts), space=0, horiz=TRUE)
dev.off()
lx = length(x)
makebiased = (lx-1)/lx
varx = var(x)*makebiased
vary = var(y)*makebiased
corxy <- cor.test(x,y,method='pearson', na.rm = T)
cxy <- as.matrix(corxy$estimate)[1,1]
load(file='createtable')
a<-table.start()
a<-table.row.start(a)
a<-table.element(a,'Pearson Product Moment Correlation - Ungrouped Data',3,TRUE)
a<-table.row.end(a)
a<-table.row.start(a)
a<-table.element(a,'Statistic',1,TRUE)
a<-table.element(a,'Variable X',1,TRUE)
a<-table.element(a,'Variable Y',1,TRUE)
a<-table.row.end(a)
a<-table.row.start(a)
a<-table.element(a,hyperlink('arithmetic_mean.htm','Mean',''),header=TRUE)
a<-table.element(a,mean(x))
a<-table.element(a,mean(y))
a<-table.row.end(a)
a<-table.row.start(a)
a<-table.element(a,hyperlink('biased.htm','Biased Variance',''),header=TRUE)
a<-table.element(a,varx)
a<-table.element(a,vary)
a<-table.row.end(a)
a<-table.row.start(a)
a<-table.element(a,hyperlink('biased1.htm','Biased Standard Deviation',''),header=TRUE)
a<-table.element(a,sqrt(varx))
a<-table.element(a,sqrt(vary))
a<-table.row.end(a)
a<-table.row.start(a)
a<-table.element(a,hyperlink('covariance.htm','Covariance',''),header=TRUE)
a<-table.element(a,cov(x,y),2)
a<-table.row.end(a)
a<-table.row.start(a)
a<-table.element(a,hyperlink('pearson_correlation.htm','Correlation',''),header=TRUE)
a<-table.element(a,cxy,2)
a<-table.row.end(a)
a<-table.row.start(a)
a<-table.element(a,hyperlink('coeff_of_determination.htm','Determination',''),header=TRUE)
a<-table.element(a,cxy*cxy,2)
a<-table.row.end(a)
a<-table.row.start(a)
a<-table.element(a,hyperlink('ttest_statistic.htm','T-Test',''),header=TRUE)
a<-table.element(a,as.matrix(corxy$statistic)[1,1],2)
a<-table.row.end(a)
a<-table.row.start(a)
a<-table.element(a,'p-value (2 sided)',header=TRUE)
a<-table.element(a,(p2 <- as.matrix(corxy$p.value)[1,1]),2)
a<-table.row.end(a)
a<-table.row.start(a)
a<-table.element(a,'p-value (1 sided)',header=TRUE)
a<-table.element(a,p2/2,2)
a<-table.row.end(a)
a<-table.row.start(a)
a<-table.element(a,'Degrees of Freedom',header=TRUE)
a<-table.element(a,lx-2,2)
a<-table.row.end(a)
a<-table.row.start(a)
a<-table.element(a,'Number of Observations',header=TRUE)
a<-table.element(a,lx,2)
a<-table.row.end(a)
a<-table.end(a)
table.save(a,file='mytable.tab')
library(moments)
library(nortest)
jarque.x <- jarque.test(x)
jarque.y <- jarque.test(y)
if(lx>7) {
ad.x <- ad.test(x)
ad.y <- ad.test(y)
}
a<-table.start()
a<-table.row.start(a)
a<-table.element(a,'Normality Tests',1,TRUE)
a<-table.row.end(a)
a<-table.row.start(a)
a<-table.element(a,paste('
',RC.texteval('jarque.x'),'
',sep=''))
a<-table.row.end(a)
a<-table.row.start(a)
a<-table.element(a,paste('
',RC.texteval('jarque.y'),'
',sep=''))
a<-table.row.end(a)
if(lx>7) {
a<-table.row.start(a)
a<-table.element(a,paste('
',RC.texteval('ad.x'),'
',sep=''))
a<-table.row.end(a)
a<-table.row.start(a)
a<-table.element(a,paste('
',RC.texteval('ad.y'),'
',sep=''))
a<-table.row.end(a)
}
a<-table.end(a)
table.save(a,file='mytable1.tab')
library(car)
bitmap(file='test2.png')
qq.plot(x,main='QQplot of variable x')
dev.off()
bitmap(file='test3.png')
qq.plot(y,main='QQplot of variable y')
dev.off()