Free Statistics

of Irreproducible Research!

Author's title

Author*The author of this computation has been verified*
R Software Modulerwasp_multipleregression.wasp
Title produced by softwareMultiple Regression
Date of computationWed, 10 Dec 2014 12:24:44 +0000
Cite this page as followsStatistical Computations at FreeStatistics.org, Office for Research Development and Education, URL https://freestatistics.org/blog/index.php?v=date/2014/Dec/10/t1418214342qcn3xzwbxk0yxsk.htm/, Retrieved Sat, 18 May 2024 14:46:47 +0000
Statistical Computations at FreeStatistics.org, Office for Research Development and Education, URL https://freestatistics.org/blog/index.php?pk=265016, Retrieved Sat, 18 May 2024 14:46:47 +0000
QR Codes:

Original text written by user:
IsPrivate?No (this computation is public)
User-defined keywords
Estimated Impact58
Family? (F = Feedback message, R = changed R code, M = changed R Module, P = changed Parameters, D = changed Data)
-       [Multiple Regression] [MR impact numeracy] [2014-12-10 12:24:44] [ec1b40d1a9751af99658fe8fca4f9eca] [Current]
Feedback Forum

Post a new message
Dataseries X:
12.9 21
12.2 22
12.8 22
7.4 18
6.7 23
12.6 12
14.8 20
13.3 22
11.1 21
8.2 19
11.4 22
6.4 15
10.6 20
12 19
6.3 18
11.3 15
11.9 20
9.3 21
9.6 21
10 15
6.4 16
13.8 23
10.8 21
13.8 18
11.7 25
10.9 9
16.1 30
13.4 20
9.9 23
11.5 16
8.3 16
11.7 19
9 25
9.7 18
10.8 23
10.3 21
10.4 10
12.7 14
9.3 22
11.8 26
5.9 23
11.4 23
13 24
10.8 24
12.3 18
11.3 23
11.8 15
7.9 19
12.7 16
12.3 25
11.6 23
6.7 17
10.9 19
12.1 21
13.3 18
10.1 27
5.7 21
14.3 13
8 8
13.3 29
9.3 28
12.5 23
7.6 21
15.9 19
9.2 19
9.1 20
11.1 18
13 19
14.5 17
12.2 19
12.3 25
11.4 19
8.8 22
14.6 23
12.6 14
13 16
12.6 24
13.2 20
9.9 12
7.7 24
10.5 22
13.4 12
10.9 22
4.3 20
10.3 10
11.8 23
11.2 17
11.4 22
8.6 24
13.2 18
12.6 21
5.6 20
9.9 20
8.8 22
7.7 19
9 20
7.3 26
11.4 23
13.6 24
7.9 21
10.7 21
10.3 19
8.3 8
9.6 17
14.2 20
8.5 11
13.5 8
4.9 15
6.4 18
9.6 18
11.6 19
11.1 19


Summary of computational transaction
Raw Inputview raw input (R code)
Raw Outputview raw output of R engine
Computing time6 seconds
R Server'Gwilym Jenkins' @ jenkins.wessa.net

\begin{tabular}{lllllllll}
\hline
Summary of computational transaction \tabularnewline
Raw Input & view raw input (R code)  \tabularnewline
Raw Output & view raw output of R engine  \tabularnewline
Computing time & 6 seconds \tabularnewline
R Server & 'Gwilym Jenkins' @ jenkins.wessa.net \tabularnewline
\hline
\end{tabular}
%Source: https://freestatistics.org/blog/index.php?pk=265016&T=0

[TABLE]
[ROW][C]Summary of computational transaction[/C][/ROW]
[ROW][C]Raw Input[/C][C]view raw input (R code) [/C][/ROW]
[ROW][C]Raw Output[/C][C]view raw output of R engine [/C][/ROW]
[ROW][C]Computing time[/C][C]6 seconds[/C][/ROW]
[ROW][C]R Server[/C][C]'Gwilym Jenkins' @ jenkins.wessa.net[/C][/ROW]
[/TABLE]
Source: https://freestatistics.org/blog/index.php?pk=265016&T=0

Globally Unique Identifier (entire table): ba.freestatistics.org/blog/index.php?pk=265016&T=0

As an alternative you can also use a QR Code:  

The GUIDs for individual cells are displayed in the table below:

Summary of computational transaction
Raw Inputview raw input (R code)
Raw Outputview raw output of R engine
Computing time6 seconds
R Server'Gwilym Jenkins' @ jenkins.wessa.net


Multiple Linear Regression - Estimated Regression Equation
TOT[t] = + 9.70792 + 0.0501886NUMERACYTOT_op_32[t] + e[t]

\begin{tabular}{lllllllll}
\hline
Multiple Linear Regression - Estimated Regression Equation \tabularnewline
TOT[t] =  +  9.70792 +  0.0501886NUMERACYTOT_op_32[t]  + e[t] \tabularnewline
\hline
\end{tabular}
%Source: https://freestatistics.org/blog/index.php?pk=265016&T=1

[TABLE]
[ROW][C]Multiple Linear Regression - Estimated Regression Equation[/C][/ROW]
[ROW][C]TOT[t] =  +  9.70792 +  0.0501886NUMERACYTOT_op_32[t]  + e[t][/C][/ROW]
[/TABLE]
Source: https://freestatistics.org/blog/index.php?pk=265016&T=1

Globally Unique Identifier (entire table): ba.freestatistics.org/blog/index.php?pk=265016&T=1

As an alternative you can also use a QR Code:  

The GUIDs for individual cells are displayed in the table below:

Multiple Linear Regression - Estimated Regression Equation
TOT[t] = + 9.70792 + 0.0501886NUMERACYTOT_op_32[t] + e[t]


Multiple Linear Regression - Ordinary Least Squares
VariableParameterS.D.T-STATH0: parameter = 02-tail p-value1-tail p-value
(Intercept)9.707921.070069.0725.20474e-152.60237e-15
NUMERACYTOT_op_320.05018860.0534530.93890.3498240.174912

\begin{tabular}{lllllllll}
\hline
Multiple Linear Regression - Ordinary Least Squares \tabularnewline
Variable & Parameter & S.D. & T-STATH0: parameter = 0 & 2-tail p-value & 1-tail p-value \tabularnewline
(Intercept) & 9.70792 & 1.07006 & 9.072 & 5.20474e-15 & 2.60237e-15 \tabularnewline
NUMERACYTOT_op_32 & 0.0501886 & 0.053453 & 0.9389 & 0.349824 & 0.174912 \tabularnewline
\hline
\end{tabular}
%Source: https://freestatistics.org/blog/index.php?pk=265016&T=2

[TABLE]
[ROW][C]Multiple Linear Regression - Ordinary Least Squares[/C][/ROW]
[ROW][C]Variable[/C][C]Parameter[/C][C]S.D.[/C][C]T-STATH0: parameter = 0[/C][C]2-tail p-value[/C][C]1-tail p-value[/C][/ROW]
[ROW][C](Intercept)[/C][C]9.70792[/C][C]1.07006[/C][C]9.072[/C][C]5.20474e-15[/C][C]2.60237e-15[/C][/ROW]
[ROW][C]NUMERACYTOT_op_32[/C][C]0.0501886[/C][C]0.053453[/C][C]0.9389[/C][C]0.349824[/C][C]0.174912[/C][/ROW]
[/TABLE]
Source: https://freestatistics.org/blog/index.php?pk=265016&T=2

Globally Unique Identifier (entire table): ba.freestatistics.org/blog/index.php?pk=265016&T=2

As an alternative you can also use a QR Code:  

The GUIDs for individual cells are displayed in the table below:

Multiple Linear Regression - Ordinary Least Squares
VariableParameterS.D.T-STATH0: parameter = 02-tail p-value1-tail p-value
(Intercept)9.707921.070069.0725.20474e-152.60237e-15
NUMERACYTOT_op_320.05018860.0534530.93890.3498240.174912


Multiple Linear Regression - Regression Statistics
Multiple R0.0891669
R-squared0.00795073
Adjusted R-squared-0.0010679
F-TEST (value)0.881589
F-TEST (DF numerator)1
F-TEST (DF denominator)110
p-value0.349824
Multiple Linear Regression - Residual Statistics
Residual Standard Deviation2.47266
Sum Squared Residuals672.545

\begin{tabular}{lllllllll}
\hline
Multiple Linear Regression - Regression Statistics \tabularnewline
Multiple R & 0.0891669 \tabularnewline
R-squared & 0.00795073 \tabularnewline
Adjusted R-squared & -0.0010679 \tabularnewline
F-TEST (value) & 0.881589 \tabularnewline
F-TEST (DF numerator) & 1 \tabularnewline
F-TEST (DF denominator) & 110 \tabularnewline
p-value & 0.349824 \tabularnewline
Multiple Linear Regression - Residual Statistics \tabularnewline
Residual Standard Deviation & 2.47266 \tabularnewline
Sum Squared Residuals & 672.545 \tabularnewline
\hline
\end{tabular}
%Source: https://freestatistics.org/blog/index.php?pk=265016&T=3

[TABLE]
[ROW][C]Multiple Linear Regression - Regression Statistics[/C][/ROW]
[ROW][C]Multiple R[/C][C]0.0891669[/C][/ROW]
[ROW][C]R-squared[/C][C]0.00795073[/C][/ROW]
[ROW][C]Adjusted R-squared[/C][C]-0.0010679[/C][/ROW]
[ROW][C]F-TEST (value)[/C][C]0.881589[/C][/ROW]
[ROW][C]F-TEST (DF numerator)[/C][C]1[/C][/ROW]
[ROW][C]F-TEST (DF denominator)[/C][C]110[/C][/ROW]
[ROW][C]p-value[/C][C]0.349824[/C][/ROW]
[ROW][C]Multiple Linear Regression - Residual Statistics[/C][/ROW]
[ROW][C]Residual Standard Deviation[/C][C]2.47266[/C][/ROW]
[ROW][C]Sum Squared Residuals[/C][C]672.545[/C][/ROW]
[/TABLE]
Source: https://freestatistics.org/blog/index.php?pk=265016&T=3

Globally Unique Identifier (entire table): ba.freestatistics.org/blog/index.php?pk=265016&T=3

As an alternative you can also use a QR Code:  

The GUIDs for individual cells are displayed in the table below:

Multiple Linear Regression - Regression Statistics
Multiple R0.0891669
R-squared0.00795073
Adjusted R-squared-0.0010679
F-TEST (value)0.881589
F-TEST (DF numerator)1
F-TEST (DF denominator)110
p-value0.349824
Multiple Linear Regression - Residual Statistics
Residual Standard Deviation2.47266
Sum Squared Residuals672.545


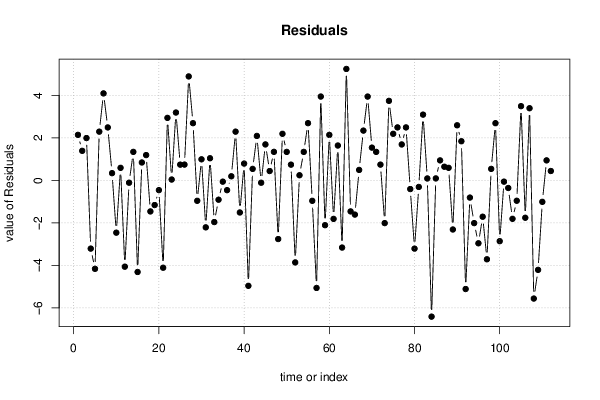
Multiple Linear Regression - Actuals, Interpolation, and Residuals
Time or IndexActualsInterpolationForecastResidualsPrediction Error
112.910.76192.13812
212.210.81211.38793
312.810.81211.98793
47.410.6113-3.21132
56.710.8623-4.16226
612.610.31022.28981
714.810.71174.08831
813.310.81212.48793
911.110.76190.338117
108.210.6615-2.46151
1111.410.81210.587928
126.410.4608-4.06075
1310.610.7117-0.111695
141210.66151.33849
156.310.6113-4.31132
1611.310.46080.839248
1711.910.71171.18831
189.310.7619-1.46188
199.610.7619-1.16188
201010.4608-0.460752
216.410.5109-4.11094
2213.810.86232.93774
2310.810.76190.0381167
2413.810.61133.18868
2511.710.96260.737362
2610.910.15960.74038
2716.111.21364.88642
2813.410.71172.68831
299.910.8623-0.96226
3011.510.51090.98906
318.310.5109-2.21094
3211.710.66151.03849
33910.9626-1.96264
349.710.6113-0.911318
3510.810.8623-0.0622605
3610.310.7619-0.461883
3710.410.20980.190191
3812.710.41062.28944
399.310.8121-1.51207
4011.811.01280.787174
415.910.8623-4.96226
4211.410.86230.53774
431310.91242.08755
4410.810.9124-0.112449
4512.310.61131.68868
4611.310.86230.43774
4711.810.46081.33925
487.910.6615-2.76151
4912.710.51092.18906
5012.310.96261.33736
5111.610.86230.73774
526.710.5611-3.86113
5310.910.66150.238494
5412.110.76191.33812
5513.310.61132.68868
5610.111.063-0.963015
575.710.7619-5.06188
5814.310.36043.93963
59810.1094-2.10943
6013.311.16342.13661
619.311.1132-1.8132
6212.510.86231.63774
637.610.7619-3.16188
6415.910.66155.23849
659.210.6615-1.46151
669.110.7117-1.61169
6711.110.61130.488682
681310.66152.33849
6914.510.56113.93887
7012.210.66151.53849
7112.310.96261.33736
7211.410.66150.738494
738.810.8121-2.01207
7414.610.86233.73774
7512.610.41062.18944
761310.51092.48906
7712.610.91241.68755
7813.210.71172.48831
799.910.3102-0.410186
807.710.9124-3.21245
8110.510.8121-0.312072
8213.410.31023.08981
8310.910.81210.0879281
844.310.7117-6.41169
8510.310.20980.0901913
8611.810.86230.93774
8711.210.56110.638871
8811.410.81210.587928
898.610.9124-2.31245
9013.210.61132.58868
9112.610.76191.83812
925.610.7117-5.11169
939.910.7117-0.811695
948.810.8121-2.01207
957.710.6615-2.96151
96910.7117-1.71169
977.311.0128-3.71283
9811.410.86230.53774
9913.610.91242.68755
1007.910.7619-2.86188
10110.710.7619-0.0618833
10210.310.6615-0.361506
1038.310.1094-1.80943
1049.610.5611-0.961129
10514.210.71173.48831
1068.510.26-1.76
10713.510.10943.39057
1084.910.4608-5.56075
1096.410.6113-4.21132
1109.610.6113-1.01132
11111.610.66150.938494
11211.110.66150.438494

\begin{tabular}{lllllllll}
\hline
Multiple Linear Regression - Actuals, Interpolation, and Residuals \tabularnewline
Time or Index & Actuals & InterpolationForecast & ResidualsPrediction Error \tabularnewline
1 & 12.9 & 10.7619 & 2.13812 \tabularnewline
2 & 12.2 & 10.8121 & 1.38793 \tabularnewline
3 & 12.8 & 10.8121 & 1.98793 \tabularnewline
4 & 7.4 & 10.6113 & -3.21132 \tabularnewline
5 & 6.7 & 10.8623 & -4.16226 \tabularnewline
6 & 12.6 & 10.3102 & 2.28981 \tabularnewline
7 & 14.8 & 10.7117 & 4.08831 \tabularnewline
8 & 13.3 & 10.8121 & 2.48793 \tabularnewline
9 & 11.1 & 10.7619 & 0.338117 \tabularnewline
10 & 8.2 & 10.6615 & -2.46151 \tabularnewline
11 & 11.4 & 10.8121 & 0.587928 \tabularnewline
12 & 6.4 & 10.4608 & -4.06075 \tabularnewline
13 & 10.6 & 10.7117 & -0.111695 \tabularnewline
14 & 12 & 10.6615 & 1.33849 \tabularnewline
15 & 6.3 & 10.6113 & -4.31132 \tabularnewline
16 & 11.3 & 10.4608 & 0.839248 \tabularnewline
17 & 11.9 & 10.7117 & 1.18831 \tabularnewline
18 & 9.3 & 10.7619 & -1.46188 \tabularnewline
19 & 9.6 & 10.7619 & -1.16188 \tabularnewline
20 & 10 & 10.4608 & -0.460752 \tabularnewline
21 & 6.4 & 10.5109 & -4.11094 \tabularnewline
22 & 13.8 & 10.8623 & 2.93774 \tabularnewline
23 & 10.8 & 10.7619 & 0.0381167 \tabularnewline
24 & 13.8 & 10.6113 & 3.18868 \tabularnewline
25 & 11.7 & 10.9626 & 0.737362 \tabularnewline
26 & 10.9 & 10.1596 & 0.74038 \tabularnewline
27 & 16.1 & 11.2136 & 4.88642 \tabularnewline
28 & 13.4 & 10.7117 & 2.68831 \tabularnewline
29 & 9.9 & 10.8623 & -0.96226 \tabularnewline
30 & 11.5 & 10.5109 & 0.98906 \tabularnewline
31 & 8.3 & 10.5109 & -2.21094 \tabularnewline
32 & 11.7 & 10.6615 & 1.03849 \tabularnewline
33 & 9 & 10.9626 & -1.96264 \tabularnewline
34 & 9.7 & 10.6113 & -0.911318 \tabularnewline
35 & 10.8 & 10.8623 & -0.0622605 \tabularnewline
36 & 10.3 & 10.7619 & -0.461883 \tabularnewline
37 & 10.4 & 10.2098 & 0.190191 \tabularnewline
38 & 12.7 & 10.4106 & 2.28944 \tabularnewline
39 & 9.3 & 10.8121 & -1.51207 \tabularnewline
40 & 11.8 & 11.0128 & 0.787174 \tabularnewline
41 & 5.9 & 10.8623 & -4.96226 \tabularnewline
42 & 11.4 & 10.8623 & 0.53774 \tabularnewline
43 & 13 & 10.9124 & 2.08755 \tabularnewline
44 & 10.8 & 10.9124 & -0.112449 \tabularnewline
45 & 12.3 & 10.6113 & 1.68868 \tabularnewline
46 & 11.3 & 10.8623 & 0.43774 \tabularnewline
47 & 11.8 & 10.4608 & 1.33925 \tabularnewline
48 & 7.9 & 10.6615 & -2.76151 \tabularnewline
49 & 12.7 & 10.5109 & 2.18906 \tabularnewline
50 & 12.3 & 10.9626 & 1.33736 \tabularnewline
51 & 11.6 & 10.8623 & 0.73774 \tabularnewline
52 & 6.7 & 10.5611 & -3.86113 \tabularnewline
53 & 10.9 & 10.6615 & 0.238494 \tabularnewline
54 & 12.1 & 10.7619 & 1.33812 \tabularnewline
55 & 13.3 & 10.6113 & 2.68868 \tabularnewline
56 & 10.1 & 11.063 & -0.963015 \tabularnewline
57 & 5.7 & 10.7619 & -5.06188 \tabularnewline
58 & 14.3 & 10.3604 & 3.93963 \tabularnewline
59 & 8 & 10.1094 & -2.10943 \tabularnewline
60 & 13.3 & 11.1634 & 2.13661 \tabularnewline
61 & 9.3 & 11.1132 & -1.8132 \tabularnewline
62 & 12.5 & 10.8623 & 1.63774 \tabularnewline
63 & 7.6 & 10.7619 & -3.16188 \tabularnewline
64 & 15.9 & 10.6615 & 5.23849 \tabularnewline
65 & 9.2 & 10.6615 & -1.46151 \tabularnewline
66 & 9.1 & 10.7117 & -1.61169 \tabularnewline
67 & 11.1 & 10.6113 & 0.488682 \tabularnewline
68 & 13 & 10.6615 & 2.33849 \tabularnewline
69 & 14.5 & 10.5611 & 3.93887 \tabularnewline
70 & 12.2 & 10.6615 & 1.53849 \tabularnewline
71 & 12.3 & 10.9626 & 1.33736 \tabularnewline
72 & 11.4 & 10.6615 & 0.738494 \tabularnewline
73 & 8.8 & 10.8121 & -2.01207 \tabularnewline
74 & 14.6 & 10.8623 & 3.73774 \tabularnewline
75 & 12.6 & 10.4106 & 2.18944 \tabularnewline
76 & 13 & 10.5109 & 2.48906 \tabularnewline
77 & 12.6 & 10.9124 & 1.68755 \tabularnewline
78 & 13.2 & 10.7117 & 2.48831 \tabularnewline
79 & 9.9 & 10.3102 & -0.410186 \tabularnewline
80 & 7.7 & 10.9124 & -3.21245 \tabularnewline
81 & 10.5 & 10.8121 & -0.312072 \tabularnewline
82 & 13.4 & 10.3102 & 3.08981 \tabularnewline
83 & 10.9 & 10.8121 & 0.0879281 \tabularnewline
84 & 4.3 & 10.7117 & -6.41169 \tabularnewline
85 & 10.3 & 10.2098 & 0.0901913 \tabularnewline
86 & 11.8 & 10.8623 & 0.93774 \tabularnewline
87 & 11.2 & 10.5611 & 0.638871 \tabularnewline
88 & 11.4 & 10.8121 & 0.587928 \tabularnewline
89 & 8.6 & 10.9124 & -2.31245 \tabularnewline
90 & 13.2 & 10.6113 & 2.58868 \tabularnewline
91 & 12.6 & 10.7619 & 1.83812 \tabularnewline
92 & 5.6 & 10.7117 & -5.11169 \tabularnewline
93 & 9.9 & 10.7117 & -0.811695 \tabularnewline
94 & 8.8 & 10.8121 & -2.01207 \tabularnewline
95 & 7.7 & 10.6615 & -2.96151 \tabularnewline
96 & 9 & 10.7117 & -1.71169 \tabularnewline
97 & 7.3 & 11.0128 & -3.71283 \tabularnewline
98 & 11.4 & 10.8623 & 0.53774 \tabularnewline
99 & 13.6 & 10.9124 & 2.68755 \tabularnewline
100 & 7.9 & 10.7619 & -2.86188 \tabularnewline
101 & 10.7 & 10.7619 & -0.0618833 \tabularnewline
102 & 10.3 & 10.6615 & -0.361506 \tabularnewline
103 & 8.3 & 10.1094 & -1.80943 \tabularnewline
104 & 9.6 & 10.5611 & -0.961129 \tabularnewline
105 & 14.2 & 10.7117 & 3.48831 \tabularnewline
106 & 8.5 & 10.26 & -1.76 \tabularnewline
107 & 13.5 & 10.1094 & 3.39057 \tabularnewline
108 & 4.9 & 10.4608 & -5.56075 \tabularnewline
109 & 6.4 & 10.6113 & -4.21132 \tabularnewline
110 & 9.6 & 10.6113 & -1.01132 \tabularnewline
111 & 11.6 & 10.6615 & 0.938494 \tabularnewline
112 & 11.1 & 10.6615 & 0.438494 \tabularnewline
\hline
\end{tabular}
%Source: https://freestatistics.org/blog/index.php?pk=265016&T=4

[TABLE]
[ROW][C]Multiple Linear Regression - Actuals, Interpolation, and Residuals[/C][/ROW]
[ROW][C]Time or Index[/C][C]Actuals[/C][C]InterpolationForecast[/C][C]ResidualsPrediction Error[/C][/ROW]
[ROW][C]1[/C][C]12.9[/C][C]10.7619[/C][C]2.13812[/C][/ROW]
[ROW][C]2[/C][C]12.2[/C][C]10.8121[/C][C]1.38793[/C][/ROW]
[ROW][C]3[/C][C]12.8[/C][C]10.8121[/C][C]1.98793[/C][/ROW]
[ROW][C]4[/C][C]7.4[/C][C]10.6113[/C][C]-3.21132[/C][/ROW]
[ROW][C]5[/C][C]6.7[/C][C]10.8623[/C][C]-4.16226[/C][/ROW]
[ROW][C]6[/C][C]12.6[/C][C]10.3102[/C][C]2.28981[/C][/ROW]
[ROW][C]7[/C][C]14.8[/C][C]10.7117[/C][C]4.08831[/C][/ROW]
[ROW][C]8[/C][C]13.3[/C][C]10.8121[/C][C]2.48793[/C][/ROW]
[ROW][C]9[/C][C]11.1[/C][C]10.7619[/C][C]0.338117[/C][/ROW]
[ROW][C]10[/C][C]8.2[/C][C]10.6615[/C][C]-2.46151[/C][/ROW]
[ROW][C]11[/C][C]11.4[/C][C]10.8121[/C][C]0.587928[/C][/ROW]
[ROW][C]12[/C][C]6.4[/C][C]10.4608[/C][C]-4.06075[/C][/ROW]
[ROW][C]13[/C][C]10.6[/C][C]10.7117[/C][C]-0.111695[/C][/ROW]
[ROW][C]14[/C][C]12[/C][C]10.6615[/C][C]1.33849[/C][/ROW]
[ROW][C]15[/C][C]6.3[/C][C]10.6113[/C][C]-4.31132[/C][/ROW]
[ROW][C]16[/C][C]11.3[/C][C]10.4608[/C][C]0.839248[/C][/ROW]
[ROW][C]17[/C][C]11.9[/C][C]10.7117[/C][C]1.18831[/C][/ROW]
[ROW][C]18[/C][C]9.3[/C][C]10.7619[/C][C]-1.46188[/C][/ROW]
[ROW][C]19[/C][C]9.6[/C][C]10.7619[/C][C]-1.16188[/C][/ROW]
[ROW][C]20[/C][C]10[/C][C]10.4608[/C][C]-0.460752[/C][/ROW]
[ROW][C]21[/C][C]6.4[/C][C]10.5109[/C][C]-4.11094[/C][/ROW]
[ROW][C]22[/C][C]13.8[/C][C]10.8623[/C][C]2.93774[/C][/ROW]
[ROW][C]23[/C][C]10.8[/C][C]10.7619[/C][C]0.0381167[/C][/ROW]
[ROW][C]24[/C][C]13.8[/C][C]10.6113[/C][C]3.18868[/C][/ROW]
[ROW][C]25[/C][C]11.7[/C][C]10.9626[/C][C]0.737362[/C][/ROW]
[ROW][C]26[/C][C]10.9[/C][C]10.1596[/C][C]0.74038[/C][/ROW]
[ROW][C]27[/C][C]16.1[/C][C]11.2136[/C][C]4.88642[/C][/ROW]
[ROW][C]28[/C][C]13.4[/C][C]10.7117[/C][C]2.68831[/C][/ROW]
[ROW][C]29[/C][C]9.9[/C][C]10.8623[/C][C]-0.96226[/C][/ROW]
[ROW][C]30[/C][C]11.5[/C][C]10.5109[/C][C]0.98906[/C][/ROW]
[ROW][C]31[/C][C]8.3[/C][C]10.5109[/C][C]-2.21094[/C][/ROW]
[ROW][C]32[/C][C]11.7[/C][C]10.6615[/C][C]1.03849[/C][/ROW]
[ROW][C]33[/C][C]9[/C][C]10.9626[/C][C]-1.96264[/C][/ROW]
[ROW][C]34[/C][C]9.7[/C][C]10.6113[/C][C]-0.911318[/C][/ROW]
[ROW][C]35[/C][C]10.8[/C][C]10.8623[/C][C]-0.0622605[/C][/ROW]
[ROW][C]36[/C][C]10.3[/C][C]10.7619[/C][C]-0.461883[/C][/ROW]
[ROW][C]37[/C][C]10.4[/C][C]10.2098[/C][C]0.190191[/C][/ROW]
[ROW][C]38[/C][C]12.7[/C][C]10.4106[/C][C]2.28944[/C][/ROW]
[ROW][C]39[/C][C]9.3[/C][C]10.8121[/C][C]-1.51207[/C][/ROW]
[ROW][C]40[/C][C]11.8[/C][C]11.0128[/C][C]0.787174[/C][/ROW]
[ROW][C]41[/C][C]5.9[/C][C]10.8623[/C][C]-4.96226[/C][/ROW]
[ROW][C]42[/C][C]11.4[/C][C]10.8623[/C][C]0.53774[/C][/ROW]
[ROW][C]43[/C][C]13[/C][C]10.9124[/C][C]2.08755[/C][/ROW]
[ROW][C]44[/C][C]10.8[/C][C]10.9124[/C][C]-0.112449[/C][/ROW]
[ROW][C]45[/C][C]12.3[/C][C]10.6113[/C][C]1.68868[/C][/ROW]
[ROW][C]46[/C][C]11.3[/C][C]10.8623[/C][C]0.43774[/C][/ROW]
[ROW][C]47[/C][C]11.8[/C][C]10.4608[/C][C]1.33925[/C][/ROW]
[ROW][C]48[/C][C]7.9[/C][C]10.6615[/C][C]-2.76151[/C][/ROW]
[ROW][C]49[/C][C]12.7[/C][C]10.5109[/C][C]2.18906[/C][/ROW]
[ROW][C]50[/C][C]12.3[/C][C]10.9626[/C][C]1.33736[/C][/ROW]
[ROW][C]51[/C][C]11.6[/C][C]10.8623[/C][C]0.73774[/C][/ROW]
[ROW][C]52[/C][C]6.7[/C][C]10.5611[/C][C]-3.86113[/C][/ROW]
[ROW][C]53[/C][C]10.9[/C][C]10.6615[/C][C]0.238494[/C][/ROW]
[ROW][C]54[/C][C]12.1[/C][C]10.7619[/C][C]1.33812[/C][/ROW]
[ROW][C]55[/C][C]13.3[/C][C]10.6113[/C][C]2.68868[/C][/ROW]
[ROW][C]56[/C][C]10.1[/C][C]11.063[/C][C]-0.963015[/C][/ROW]
[ROW][C]57[/C][C]5.7[/C][C]10.7619[/C][C]-5.06188[/C][/ROW]
[ROW][C]58[/C][C]14.3[/C][C]10.3604[/C][C]3.93963[/C][/ROW]
[ROW][C]59[/C][C]8[/C][C]10.1094[/C][C]-2.10943[/C][/ROW]
[ROW][C]60[/C][C]13.3[/C][C]11.1634[/C][C]2.13661[/C][/ROW]
[ROW][C]61[/C][C]9.3[/C][C]11.1132[/C][C]-1.8132[/C][/ROW]
[ROW][C]62[/C][C]12.5[/C][C]10.8623[/C][C]1.63774[/C][/ROW]
[ROW][C]63[/C][C]7.6[/C][C]10.7619[/C][C]-3.16188[/C][/ROW]
[ROW][C]64[/C][C]15.9[/C][C]10.6615[/C][C]5.23849[/C][/ROW]
[ROW][C]65[/C][C]9.2[/C][C]10.6615[/C][C]-1.46151[/C][/ROW]
[ROW][C]66[/C][C]9.1[/C][C]10.7117[/C][C]-1.61169[/C][/ROW]
[ROW][C]67[/C][C]11.1[/C][C]10.6113[/C][C]0.488682[/C][/ROW]
[ROW][C]68[/C][C]13[/C][C]10.6615[/C][C]2.33849[/C][/ROW]
[ROW][C]69[/C][C]14.5[/C][C]10.5611[/C][C]3.93887[/C][/ROW]
[ROW][C]70[/C][C]12.2[/C][C]10.6615[/C][C]1.53849[/C][/ROW]
[ROW][C]71[/C][C]12.3[/C][C]10.9626[/C][C]1.33736[/C][/ROW]
[ROW][C]72[/C][C]11.4[/C][C]10.6615[/C][C]0.738494[/C][/ROW]
[ROW][C]73[/C][C]8.8[/C][C]10.8121[/C][C]-2.01207[/C][/ROW]
[ROW][C]74[/C][C]14.6[/C][C]10.8623[/C][C]3.73774[/C][/ROW]
[ROW][C]75[/C][C]12.6[/C][C]10.4106[/C][C]2.18944[/C][/ROW]
[ROW][C]76[/C][C]13[/C][C]10.5109[/C][C]2.48906[/C][/ROW]
[ROW][C]77[/C][C]12.6[/C][C]10.9124[/C][C]1.68755[/C][/ROW]
[ROW][C]78[/C][C]13.2[/C][C]10.7117[/C][C]2.48831[/C][/ROW]
[ROW][C]79[/C][C]9.9[/C][C]10.3102[/C][C]-0.410186[/C][/ROW]
[ROW][C]80[/C][C]7.7[/C][C]10.9124[/C][C]-3.21245[/C][/ROW]
[ROW][C]81[/C][C]10.5[/C][C]10.8121[/C][C]-0.312072[/C][/ROW]
[ROW][C]82[/C][C]13.4[/C][C]10.3102[/C][C]3.08981[/C][/ROW]
[ROW][C]83[/C][C]10.9[/C][C]10.8121[/C][C]0.0879281[/C][/ROW]
[ROW][C]84[/C][C]4.3[/C][C]10.7117[/C][C]-6.41169[/C][/ROW]
[ROW][C]85[/C][C]10.3[/C][C]10.2098[/C][C]0.0901913[/C][/ROW]
[ROW][C]86[/C][C]11.8[/C][C]10.8623[/C][C]0.93774[/C][/ROW]
[ROW][C]87[/C][C]11.2[/C][C]10.5611[/C][C]0.638871[/C][/ROW]
[ROW][C]88[/C][C]11.4[/C][C]10.8121[/C][C]0.587928[/C][/ROW]
[ROW][C]89[/C][C]8.6[/C][C]10.9124[/C][C]-2.31245[/C][/ROW]
[ROW][C]90[/C][C]13.2[/C][C]10.6113[/C][C]2.58868[/C][/ROW]
[ROW][C]91[/C][C]12.6[/C][C]10.7619[/C][C]1.83812[/C][/ROW]
[ROW][C]92[/C][C]5.6[/C][C]10.7117[/C][C]-5.11169[/C][/ROW]
[ROW][C]93[/C][C]9.9[/C][C]10.7117[/C][C]-0.811695[/C][/ROW]
[ROW][C]94[/C][C]8.8[/C][C]10.8121[/C][C]-2.01207[/C][/ROW]
[ROW][C]95[/C][C]7.7[/C][C]10.6615[/C][C]-2.96151[/C][/ROW]
[ROW][C]96[/C][C]9[/C][C]10.7117[/C][C]-1.71169[/C][/ROW]
[ROW][C]97[/C][C]7.3[/C][C]11.0128[/C][C]-3.71283[/C][/ROW]
[ROW][C]98[/C][C]11.4[/C][C]10.8623[/C][C]0.53774[/C][/ROW]
[ROW][C]99[/C][C]13.6[/C][C]10.9124[/C][C]2.68755[/C][/ROW]
[ROW][C]100[/C][C]7.9[/C][C]10.7619[/C][C]-2.86188[/C][/ROW]
[ROW][C]101[/C][C]10.7[/C][C]10.7619[/C][C]-0.0618833[/C][/ROW]
[ROW][C]102[/C][C]10.3[/C][C]10.6615[/C][C]-0.361506[/C][/ROW]
[ROW][C]103[/C][C]8.3[/C][C]10.1094[/C][C]-1.80943[/C][/ROW]
[ROW][C]104[/C][C]9.6[/C][C]10.5611[/C][C]-0.961129[/C][/ROW]
[ROW][C]105[/C][C]14.2[/C][C]10.7117[/C][C]3.48831[/C][/ROW]
[ROW][C]106[/C][C]8.5[/C][C]10.26[/C][C]-1.76[/C][/ROW]
[ROW][C]107[/C][C]13.5[/C][C]10.1094[/C][C]3.39057[/C][/ROW]
[ROW][C]108[/C][C]4.9[/C][C]10.4608[/C][C]-5.56075[/C][/ROW]
[ROW][C]109[/C][C]6.4[/C][C]10.6113[/C][C]-4.21132[/C][/ROW]
[ROW][C]110[/C][C]9.6[/C][C]10.6113[/C][C]-1.01132[/C][/ROW]
[ROW][C]111[/C][C]11.6[/C][C]10.6615[/C][C]0.938494[/C][/ROW]
[ROW][C]112[/C][C]11.1[/C][C]10.6615[/C][C]0.438494[/C][/ROW]
[/TABLE]
Source: https://freestatistics.org/blog/index.php?pk=265016&T=4

Globally Unique Identifier (entire table): ba.freestatistics.org/blog/index.php?pk=265016&T=4

As an alternative you can also use a QR Code:  

The GUIDs for individual cells are displayed in the table below:

Multiple Linear Regression - Actuals, Interpolation, and Residuals
Time or IndexActualsInterpolationForecastResidualsPrediction Error
112.910.76192.13812
212.210.81211.38793
312.810.81211.98793
47.410.6113-3.21132
56.710.8623-4.16226
612.610.31022.28981
714.810.71174.08831
813.310.81212.48793
911.110.76190.338117
108.210.6615-2.46151
1111.410.81210.587928
126.410.4608-4.06075
1310.610.7117-0.111695
141210.66151.33849
156.310.6113-4.31132
1611.310.46080.839248
1711.910.71171.18831
189.310.7619-1.46188
199.610.7619-1.16188
201010.4608-0.460752
216.410.5109-4.11094
2213.810.86232.93774
2310.810.76190.0381167
2413.810.61133.18868
2511.710.96260.737362
2610.910.15960.74038
2716.111.21364.88642
2813.410.71172.68831
299.910.8623-0.96226
3011.510.51090.98906
318.310.5109-2.21094
3211.710.66151.03849
33910.9626-1.96264
349.710.6113-0.911318
3510.810.8623-0.0622605
3610.310.7619-0.461883
3710.410.20980.190191
3812.710.41062.28944
399.310.8121-1.51207
4011.811.01280.787174
415.910.8623-4.96226
4211.410.86230.53774
431310.91242.08755
4410.810.9124-0.112449
4512.310.61131.68868
4611.310.86230.43774
4711.810.46081.33925
487.910.6615-2.76151
4912.710.51092.18906
5012.310.96261.33736
5111.610.86230.73774
526.710.5611-3.86113
5310.910.66150.238494
5412.110.76191.33812
5513.310.61132.68868
5610.111.063-0.963015
575.710.7619-5.06188
5814.310.36043.93963
59810.1094-2.10943
6013.311.16342.13661
619.311.1132-1.8132
6212.510.86231.63774
637.610.7619-3.16188
6415.910.66155.23849
659.210.6615-1.46151
669.110.7117-1.61169
6711.110.61130.488682
681310.66152.33849
6914.510.56113.93887
7012.210.66151.53849
7112.310.96261.33736
7211.410.66150.738494
738.810.8121-2.01207
7414.610.86233.73774
7512.610.41062.18944
761310.51092.48906
7712.610.91241.68755
7813.210.71172.48831
799.910.3102-0.410186
807.710.9124-3.21245
8110.510.8121-0.312072
8213.410.31023.08981
8310.910.81210.0879281
844.310.7117-6.41169
8510.310.20980.0901913
8611.810.86230.93774
8711.210.56110.638871
8811.410.81210.587928
898.610.9124-2.31245
9013.210.61132.58868
9112.610.76191.83812
925.610.7117-5.11169
939.910.7117-0.811695
948.810.8121-2.01207
957.710.6615-2.96151
96910.7117-1.71169
977.311.0128-3.71283
9811.410.86230.53774
9913.610.91242.68755
1007.910.7619-2.86188
10110.710.7619-0.0618833
10210.310.6615-0.361506
1038.310.1094-1.80943
1049.610.5611-0.961129
10514.210.71173.48831
1068.510.26-1.76
10713.510.10943.39057
1084.910.4608-5.56075
1096.410.6113-4.21132
1109.610.6113-1.01132
11111.610.66150.938494
11211.110.66150.438494


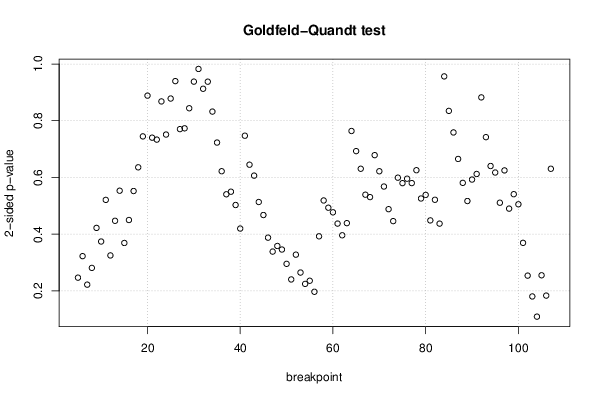
Goldfeld-Quandt test for Heteroskedasticity
p-valuesAlternative Hypothesis
breakpoint indexgreater2-sidedless
50.8766580.2466840.123342
60.8387250.3225490.161275
70.8889950.2220090.111005
80.8594390.2811210.140561
90.7889430.4221130.211057
100.8129280.3741450.187072
110.7395170.5209660.260483
120.8374650.3250690.162535
130.7764190.4471620.223581
140.7233720.5532570.276628
150.8154980.3690040.184502
160.7750190.4499630.224981
170.7239380.5521240.276062
180.6820840.6358320.317916
190.6275840.7448320.372416
200.5557870.8884260.444213
210.6298350.7403310.370165
220.633260.7334790.36674
230.5659110.8681780.434089
240.6243460.7513070.375654
250.5608560.8782890.439144
260.5301470.9397060.469853
270.6147520.7704960.385248
280.6133370.7733250.386663
290.5779530.8440950.422047
300.5310470.9379060.468953
310.5086880.9826240.491312
320.4563840.9127680.543616
330.4688420.9376850.531158
340.4161360.8322720.583864
350.3615270.7230540.638473
360.3109850.621970.689015
370.2703680.5407360.729632
380.2748670.5497340.725133
390.2514560.5029130.748544
400.2099230.4198470.790077
410.3735720.7471430.626428
420.3224810.6449610.677519
430.3032520.6065040.696748
440.2567280.5134560.743272
450.2337720.4675440.766228
460.1938560.3877130.806144
470.1693270.3386550.830673
480.1792260.3584520.820774
490.1729490.3458970.827051
500.1477190.2954380.852281
510.1202140.2404280.879786
520.1639050.327810.836095
530.1323770.2647540.867623
540.1123480.2246960.887652
550.1178820.2357650.882118
560.09847560.1969510.901524
570.1962780.3925570.803722
580.2594210.5188420.740579
590.2466440.4932890.753356
600.2385750.4771490.761425
610.2186550.437310.781345
620.1980810.3961630.801919
630.2194710.4389430.780529
640.3819240.7638480.618076
650.3464630.6929260.653537
660.3153650.630730.684635
670.2696110.5392220.730389
680.265410.5308190.73459
690.339340.6786810.66066
700.3109580.6219160.689042
710.2840240.5680480.715976
720.2440810.4881630.755919
730.2230340.4460680.776966
740.2996250.5992490.700375
750.2899750.5799510.710025
760.2977650.595530.702235
770.290090.580180.70991
780.3127810.6255620.687219
790.2629250.5258490.737075
800.2692740.5385480.730726
810.2242780.4485550.775722
820.2606770.5213530.739323
830.2185970.4371930.781403
840.4781860.9563710.521814
850.4173740.8347480.582626
860.3793750.758750.620625
870.3326130.6652260.667387
880.2904930.5809860.709507
890.2584440.5168880.741556
900.2963080.5926170.703692
910.3061550.612310.693845
920.4411750.882350.558825
930.3710710.7421410.628929
940.3201950.640390.679805
950.308710.6174190.69129
960.2554330.5108670.744567
970.312430.624860.68757
980.2450720.4901430.754928
990.2705170.5410340.729483
1000.2527250.5054490.747275
1010.1847120.3694250.815288
1020.1269440.2538880.873056
1030.09021910.1804380.909781
1040.05460950.1092190.945391
1050.1275440.2550880.872456
1060.091740.183480.90826
1070.684660.630680.31534

\begin{tabular}{lllllllll}
\hline
Goldfeld-Quandt test for Heteroskedasticity \tabularnewline
p-values & Alternative Hypothesis \tabularnewline
breakpoint index & greater & 2-sided & less \tabularnewline
5 & 0.876658 & 0.246684 & 0.123342 \tabularnewline
6 & 0.838725 & 0.322549 & 0.161275 \tabularnewline
7 & 0.888995 & 0.222009 & 0.111005 \tabularnewline
8 & 0.859439 & 0.281121 & 0.140561 \tabularnewline
9 & 0.788943 & 0.422113 & 0.211057 \tabularnewline
10 & 0.812928 & 0.374145 & 0.187072 \tabularnewline
11 & 0.739517 & 0.520966 & 0.260483 \tabularnewline
12 & 0.837465 & 0.325069 & 0.162535 \tabularnewline
13 & 0.776419 & 0.447162 & 0.223581 \tabularnewline
14 & 0.723372 & 0.553257 & 0.276628 \tabularnewline
15 & 0.815498 & 0.369004 & 0.184502 \tabularnewline
16 & 0.775019 & 0.449963 & 0.224981 \tabularnewline
17 & 0.723938 & 0.552124 & 0.276062 \tabularnewline
18 & 0.682084 & 0.635832 & 0.317916 \tabularnewline
19 & 0.627584 & 0.744832 & 0.372416 \tabularnewline
20 & 0.555787 & 0.888426 & 0.444213 \tabularnewline
21 & 0.629835 & 0.740331 & 0.370165 \tabularnewline
22 & 0.63326 & 0.733479 & 0.36674 \tabularnewline
23 & 0.565911 & 0.868178 & 0.434089 \tabularnewline
24 & 0.624346 & 0.751307 & 0.375654 \tabularnewline
25 & 0.560856 & 0.878289 & 0.439144 \tabularnewline
26 & 0.530147 & 0.939706 & 0.469853 \tabularnewline
27 & 0.614752 & 0.770496 & 0.385248 \tabularnewline
28 & 0.613337 & 0.773325 & 0.386663 \tabularnewline
29 & 0.577953 & 0.844095 & 0.422047 \tabularnewline
30 & 0.531047 & 0.937906 & 0.468953 \tabularnewline
31 & 0.508688 & 0.982624 & 0.491312 \tabularnewline
32 & 0.456384 & 0.912768 & 0.543616 \tabularnewline
33 & 0.468842 & 0.937685 & 0.531158 \tabularnewline
34 & 0.416136 & 0.832272 & 0.583864 \tabularnewline
35 & 0.361527 & 0.723054 & 0.638473 \tabularnewline
36 & 0.310985 & 0.62197 & 0.689015 \tabularnewline
37 & 0.270368 & 0.540736 & 0.729632 \tabularnewline
38 & 0.274867 & 0.549734 & 0.725133 \tabularnewline
39 & 0.251456 & 0.502913 & 0.748544 \tabularnewline
40 & 0.209923 & 0.419847 & 0.790077 \tabularnewline
41 & 0.373572 & 0.747143 & 0.626428 \tabularnewline
42 & 0.322481 & 0.644961 & 0.677519 \tabularnewline
43 & 0.303252 & 0.606504 & 0.696748 \tabularnewline
44 & 0.256728 & 0.513456 & 0.743272 \tabularnewline
45 & 0.233772 & 0.467544 & 0.766228 \tabularnewline
46 & 0.193856 & 0.387713 & 0.806144 \tabularnewline
47 & 0.169327 & 0.338655 & 0.830673 \tabularnewline
48 & 0.179226 & 0.358452 & 0.820774 \tabularnewline
49 & 0.172949 & 0.345897 & 0.827051 \tabularnewline
50 & 0.147719 & 0.295438 & 0.852281 \tabularnewline
51 & 0.120214 & 0.240428 & 0.879786 \tabularnewline
52 & 0.163905 & 0.32781 & 0.836095 \tabularnewline
53 & 0.132377 & 0.264754 & 0.867623 \tabularnewline
54 & 0.112348 & 0.224696 & 0.887652 \tabularnewline
55 & 0.117882 & 0.235765 & 0.882118 \tabularnewline
56 & 0.0984756 & 0.196951 & 0.901524 \tabularnewline
57 & 0.196278 & 0.392557 & 0.803722 \tabularnewline
58 & 0.259421 & 0.518842 & 0.740579 \tabularnewline
59 & 0.246644 & 0.493289 & 0.753356 \tabularnewline
60 & 0.238575 & 0.477149 & 0.761425 \tabularnewline
61 & 0.218655 & 0.43731 & 0.781345 \tabularnewline
62 & 0.198081 & 0.396163 & 0.801919 \tabularnewline
63 & 0.219471 & 0.438943 & 0.780529 \tabularnewline
64 & 0.381924 & 0.763848 & 0.618076 \tabularnewline
65 & 0.346463 & 0.692926 & 0.653537 \tabularnewline
66 & 0.315365 & 0.63073 & 0.684635 \tabularnewline
67 & 0.269611 & 0.539222 & 0.730389 \tabularnewline
68 & 0.26541 & 0.530819 & 0.73459 \tabularnewline
69 & 0.33934 & 0.678681 & 0.66066 \tabularnewline
70 & 0.310958 & 0.621916 & 0.689042 \tabularnewline
71 & 0.284024 & 0.568048 & 0.715976 \tabularnewline
72 & 0.244081 & 0.488163 & 0.755919 \tabularnewline
73 & 0.223034 & 0.446068 & 0.776966 \tabularnewline
74 & 0.299625 & 0.599249 & 0.700375 \tabularnewline
75 & 0.289975 & 0.579951 & 0.710025 \tabularnewline
76 & 0.297765 & 0.59553 & 0.702235 \tabularnewline
77 & 0.29009 & 0.58018 & 0.70991 \tabularnewline
78 & 0.312781 & 0.625562 & 0.687219 \tabularnewline
79 & 0.262925 & 0.525849 & 0.737075 \tabularnewline
80 & 0.269274 & 0.538548 & 0.730726 \tabularnewline
81 & 0.224278 & 0.448555 & 0.775722 \tabularnewline
82 & 0.260677 & 0.521353 & 0.739323 \tabularnewline
83 & 0.218597 & 0.437193 & 0.781403 \tabularnewline
84 & 0.478186 & 0.956371 & 0.521814 \tabularnewline
85 & 0.417374 & 0.834748 & 0.582626 \tabularnewline
86 & 0.379375 & 0.75875 & 0.620625 \tabularnewline
87 & 0.332613 & 0.665226 & 0.667387 \tabularnewline
88 & 0.290493 & 0.580986 & 0.709507 \tabularnewline
89 & 0.258444 & 0.516888 & 0.741556 \tabularnewline
90 & 0.296308 & 0.592617 & 0.703692 \tabularnewline
91 & 0.306155 & 0.61231 & 0.693845 \tabularnewline
92 & 0.441175 & 0.88235 & 0.558825 \tabularnewline
93 & 0.371071 & 0.742141 & 0.628929 \tabularnewline
94 & 0.320195 & 0.64039 & 0.679805 \tabularnewline
95 & 0.30871 & 0.617419 & 0.69129 \tabularnewline
96 & 0.255433 & 0.510867 & 0.744567 \tabularnewline
97 & 0.31243 & 0.62486 & 0.68757 \tabularnewline
98 & 0.245072 & 0.490143 & 0.754928 \tabularnewline
99 & 0.270517 & 0.541034 & 0.729483 \tabularnewline
100 & 0.252725 & 0.505449 & 0.747275 \tabularnewline
101 & 0.184712 & 0.369425 & 0.815288 \tabularnewline
102 & 0.126944 & 0.253888 & 0.873056 \tabularnewline
103 & 0.0902191 & 0.180438 & 0.909781 \tabularnewline
104 & 0.0546095 & 0.109219 & 0.945391 \tabularnewline
105 & 0.127544 & 0.255088 & 0.872456 \tabularnewline
106 & 0.09174 & 0.18348 & 0.90826 \tabularnewline
107 & 0.68466 & 0.63068 & 0.31534 \tabularnewline
\hline
\end{tabular}
%Source: https://freestatistics.org/blog/index.php?pk=265016&T=5

[TABLE]
[ROW][C]Goldfeld-Quandt test for Heteroskedasticity[/C][/ROW]
[ROW][C]p-values[/C][C]Alternative Hypothesis[/C][/ROW]
[ROW][C]breakpoint index[/C][C]greater[/C][C]2-sided[/C][C]less[/C][/ROW]
[ROW][C]5[/C][C]0.876658[/C][C]0.246684[/C][C]0.123342[/C][/ROW]
[ROW][C]6[/C][C]0.838725[/C][C]0.322549[/C][C]0.161275[/C][/ROW]
[ROW][C]7[/C][C]0.888995[/C][C]0.222009[/C][C]0.111005[/C][/ROW]
[ROW][C]8[/C][C]0.859439[/C][C]0.281121[/C][C]0.140561[/C][/ROW]
[ROW][C]9[/C][C]0.788943[/C][C]0.422113[/C][C]0.211057[/C][/ROW]
[ROW][C]10[/C][C]0.812928[/C][C]0.374145[/C][C]0.187072[/C][/ROW]
[ROW][C]11[/C][C]0.739517[/C][C]0.520966[/C][C]0.260483[/C][/ROW]
[ROW][C]12[/C][C]0.837465[/C][C]0.325069[/C][C]0.162535[/C][/ROW]
[ROW][C]13[/C][C]0.776419[/C][C]0.447162[/C][C]0.223581[/C][/ROW]
[ROW][C]14[/C][C]0.723372[/C][C]0.553257[/C][C]0.276628[/C][/ROW]
[ROW][C]15[/C][C]0.815498[/C][C]0.369004[/C][C]0.184502[/C][/ROW]
[ROW][C]16[/C][C]0.775019[/C][C]0.449963[/C][C]0.224981[/C][/ROW]
[ROW][C]17[/C][C]0.723938[/C][C]0.552124[/C][C]0.276062[/C][/ROW]
[ROW][C]18[/C][C]0.682084[/C][C]0.635832[/C][C]0.317916[/C][/ROW]
[ROW][C]19[/C][C]0.627584[/C][C]0.744832[/C][C]0.372416[/C][/ROW]
[ROW][C]20[/C][C]0.555787[/C][C]0.888426[/C][C]0.444213[/C][/ROW]
[ROW][C]21[/C][C]0.629835[/C][C]0.740331[/C][C]0.370165[/C][/ROW]
[ROW][C]22[/C][C]0.63326[/C][C]0.733479[/C][C]0.36674[/C][/ROW]
[ROW][C]23[/C][C]0.565911[/C][C]0.868178[/C][C]0.434089[/C][/ROW]
[ROW][C]24[/C][C]0.624346[/C][C]0.751307[/C][C]0.375654[/C][/ROW]
[ROW][C]25[/C][C]0.560856[/C][C]0.878289[/C][C]0.439144[/C][/ROW]
[ROW][C]26[/C][C]0.530147[/C][C]0.939706[/C][C]0.469853[/C][/ROW]
[ROW][C]27[/C][C]0.614752[/C][C]0.770496[/C][C]0.385248[/C][/ROW]
[ROW][C]28[/C][C]0.613337[/C][C]0.773325[/C][C]0.386663[/C][/ROW]
[ROW][C]29[/C][C]0.577953[/C][C]0.844095[/C][C]0.422047[/C][/ROW]
[ROW][C]30[/C][C]0.531047[/C][C]0.937906[/C][C]0.468953[/C][/ROW]
[ROW][C]31[/C][C]0.508688[/C][C]0.982624[/C][C]0.491312[/C][/ROW]
[ROW][C]32[/C][C]0.456384[/C][C]0.912768[/C][C]0.543616[/C][/ROW]
[ROW][C]33[/C][C]0.468842[/C][C]0.937685[/C][C]0.531158[/C][/ROW]
[ROW][C]34[/C][C]0.416136[/C][C]0.832272[/C][C]0.583864[/C][/ROW]
[ROW][C]35[/C][C]0.361527[/C][C]0.723054[/C][C]0.638473[/C][/ROW]
[ROW][C]36[/C][C]0.310985[/C][C]0.62197[/C][C]0.689015[/C][/ROW]
[ROW][C]37[/C][C]0.270368[/C][C]0.540736[/C][C]0.729632[/C][/ROW]
[ROW][C]38[/C][C]0.274867[/C][C]0.549734[/C][C]0.725133[/C][/ROW]
[ROW][C]39[/C][C]0.251456[/C][C]0.502913[/C][C]0.748544[/C][/ROW]
[ROW][C]40[/C][C]0.209923[/C][C]0.419847[/C][C]0.790077[/C][/ROW]
[ROW][C]41[/C][C]0.373572[/C][C]0.747143[/C][C]0.626428[/C][/ROW]
[ROW][C]42[/C][C]0.322481[/C][C]0.644961[/C][C]0.677519[/C][/ROW]
[ROW][C]43[/C][C]0.303252[/C][C]0.606504[/C][C]0.696748[/C][/ROW]
[ROW][C]44[/C][C]0.256728[/C][C]0.513456[/C][C]0.743272[/C][/ROW]
[ROW][C]45[/C][C]0.233772[/C][C]0.467544[/C][C]0.766228[/C][/ROW]
[ROW][C]46[/C][C]0.193856[/C][C]0.387713[/C][C]0.806144[/C][/ROW]
[ROW][C]47[/C][C]0.169327[/C][C]0.338655[/C][C]0.830673[/C][/ROW]
[ROW][C]48[/C][C]0.179226[/C][C]0.358452[/C][C]0.820774[/C][/ROW]
[ROW][C]49[/C][C]0.172949[/C][C]0.345897[/C][C]0.827051[/C][/ROW]
[ROW][C]50[/C][C]0.147719[/C][C]0.295438[/C][C]0.852281[/C][/ROW]
[ROW][C]51[/C][C]0.120214[/C][C]0.240428[/C][C]0.879786[/C][/ROW]
[ROW][C]52[/C][C]0.163905[/C][C]0.32781[/C][C]0.836095[/C][/ROW]
[ROW][C]53[/C][C]0.132377[/C][C]0.264754[/C][C]0.867623[/C][/ROW]
[ROW][C]54[/C][C]0.112348[/C][C]0.224696[/C][C]0.887652[/C][/ROW]
[ROW][C]55[/C][C]0.117882[/C][C]0.235765[/C][C]0.882118[/C][/ROW]
[ROW][C]56[/C][C]0.0984756[/C][C]0.196951[/C][C]0.901524[/C][/ROW]
[ROW][C]57[/C][C]0.196278[/C][C]0.392557[/C][C]0.803722[/C][/ROW]
[ROW][C]58[/C][C]0.259421[/C][C]0.518842[/C][C]0.740579[/C][/ROW]
[ROW][C]59[/C][C]0.246644[/C][C]0.493289[/C][C]0.753356[/C][/ROW]
[ROW][C]60[/C][C]0.238575[/C][C]0.477149[/C][C]0.761425[/C][/ROW]
[ROW][C]61[/C][C]0.218655[/C][C]0.43731[/C][C]0.781345[/C][/ROW]
[ROW][C]62[/C][C]0.198081[/C][C]0.396163[/C][C]0.801919[/C][/ROW]
[ROW][C]63[/C][C]0.219471[/C][C]0.438943[/C][C]0.780529[/C][/ROW]
[ROW][C]64[/C][C]0.381924[/C][C]0.763848[/C][C]0.618076[/C][/ROW]
[ROW][C]65[/C][C]0.346463[/C][C]0.692926[/C][C]0.653537[/C][/ROW]
[ROW][C]66[/C][C]0.315365[/C][C]0.63073[/C][C]0.684635[/C][/ROW]
[ROW][C]67[/C][C]0.269611[/C][C]0.539222[/C][C]0.730389[/C][/ROW]
[ROW][C]68[/C][C]0.26541[/C][C]0.530819[/C][C]0.73459[/C][/ROW]
[ROW][C]69[/C][C]0.33934[/C][C]0.678681[/C][C]0.66066[/C][/ROW]
[ROW][C]70[/C][C]0.310958[/C][C]0.621916[/C][C]0.689042[/C][/ROW]
[ROW][C]71[/C][C]0.284024[/C][C]0.568048[/C][C]0.715976[/C][/ROW]
[ROW][C]72[/C][C]0.244081[/C][C]0.488163[/C][C]0.755919[/C][/ROW]
[ROW][C]73[/C][C]0.223034[/C][C]0.446068[/C][C]0.776966[/C][/ROW]
[ROW][C]74[/C][C]0.299625[/C][C]0.599249[/C][C]0.700375[/C][/ROW]
[ROW][C]75[/C][C]0.289975[/C][C]0.579951[/C][C]0.710025[/C][/ROW]
[ROW][C]76[/C][C]0.297765[/C][C]0.59553[/C][C]0.702235[/C][/ROW]
[ROW][C]77[/C][C]0.29009[/C][C]0.58018[/C][C]0.70991[/C][/ROW]
[ROW][C]78[/C][C]0.312781[/C][C]0.625562[/C][C]0.687219[/C][/ROW]
[ROW][C]79[/C][C]0.262925[/C][C]0.525849[/C][C]0.737075[/C][/ROW]
[ROW][C]80[/C][C]0.269274[/C][C]0.538548[/C][C]0.730726[/C][/ROW]
[ROW][C]81[/C][C]0.224278[/C][C]0.448555[/C][C]0.775722[/C][/ROW]
[ROW][C]82[/C][C]0.260677[/C][C]0.521353[/C][C]0.739323[/C][/ROW]
[ROW][C]83[/C][C]0.218597[/C][C]0.437193[/C][C]0.781403[/C][/ROW]
[ROW][C]84[/C][C]0.478186[/C][C]0.956371[/C][C]0.521814[/C][/ROW]
[ROW][C]85[/C][C]0.417374[/C][C]0.834748[/C][C]0.582626[/C][/ROW]
[ROW][C]86[/C][C]0.379375[/C][C]0.75875[/C][C]0.620625[/C][/ROW]
[ROW][C]87[/C][C]0.332613[/C][C]0.665226[/C][C]0.667387[/C][/ROW]
[ROW][C]88[/C][C]0.290493[/C][C]0.580986[/C][C]0.709507[/C][/ROW]
[ROW][C]89[/C][C]0.258444[/C][C]0.516888[/C][C]0.741556[/C][/ROW]
[ROW][C]90[/C][C]0.296308[/C][C]0.592617[/C][C]0.703692[/C][/ROW]
[ROW][C]91[/C][C]0.306155[/C][C]0.61231[/C][C]0.693845[/C][/ROW]
[ROW][C]92[/C][C]0.441175[/C][C]0.88235[/C][C]0.558825[/C][/ROW]
[ROW][C]93[/C][C]0.371071[/C][C]0.742141[/C][C]0.628929[/C][/ROW]
[ROW][C]94[/C][C]0.320195[/C][C]0.64039[/C][C]0.679805[/C][/ROW]
[ROW][C]95[/C][C]0.30871[/C][C]0.617419[/C][C]0.69129[/C][/ROW]
[ROW][C]96[/C][C]0.255433[/C][C]0.510867[/C][C]0.744567[/C][/ROW]
[ROW][C]97[/C][C]0.31243[/C][C]0.62486[/C][C]0.68757[/C][/ROW]
[ROW][C]98[/C][C]0.245072[/C][C]0.490143[/C][C]0.754928[/C][/ROW]
[ROW][C]99[/C][C]0.270517[/C][C]0.541034[/C][C]0.729483[/C][/ROW]
[ROW][C]100[/C][C]0.252725[/C][C]0.505449[/C][C]0.747275[/C][/ROW]
[ROW][C]101[/C][C]0.184712[/C][C]0.369425[/C][C]0.815288[/C][/ROW]
[ROW][C]102[/C][C]0.126944[/C][C]0.253888[/C][C]0.873056[/C][/ROW]
[ROW][C]103[/C][C]0.0902191[/C][C]0.180438[/C][C]0.909781[/C][/ROW]
[ROW][C]104[/C][C]0.0546095[/C][C]0.109219[/C][C]0.945391[/C][/ROW]
[ROW][C]105[/C][C]0.127544[/C][C]0.255088[/C][C]0.872456[/C][/ROW]
[ROW][C]106[/C][C]0.09174[/C][C]0.18348[/C][C]0.90826[/C][/ROW]
[ROW][C]107[/C][C]0.68466[/C][C]0.63068[/C][C]0.31534[/C][/ROW]
[/TABLE]
Source: https://freestatistics.org/blog/index.php?pk=265016&T=5

Globally Unique Identifier (entire table): ba.freestatistics.org/blog/index.php?pk=265016&T=5

As an alternative you can also use a QR Code:  

The GUIDs for individual cells are displayed in the table below:

Goldfeld-Quandt test for Heteroskedasticity
p-valuesAlternative Hypothesis
breakpoint indexgreater2-sidedless
50.8766580.2466840.123342
60.8387250.3225490.161275
70.8889950.2220090.111005
80.8594390.2811210.140561
90.7889430.4221130.211057
100.8129280.3741450.187072
110.7395170.5209660.260483
120.8374650.3250690.162535
130.7764190.4471620.223581
140.7233720.5532570.276628
150.8154980.3690040.184502
160.7750190.4499630.224981
170.7239380.5521240.276062
180.6820840.6358320.317916
190.6275840.7448320.372416
200.5557870.8884260.444213
210.6298350.7403310.370165
220.633260.7334790.36674
230.5659110.8681780.434089
240.6243460.7513070.375654
250.5608560.8782890.439144
260.5301470.9397060.469853
270.6147520.7704960.385248
280.6133370.7733250.386663
290.5779530.8440950.422047
300.5310470.9379060.468953
310.5086880.9826240.491312
320.4563840.9127680.543616
330.4688420.9376850.531158
340.4161360.8322720.583864
350.3615270.7230540.638473
360.3109850.621970.689015
370.2703680.5407360.729632
380.2748670.5497340.725133
390.2514560.5029130.748544
400.2099230.4198470.790077
410.3735720.7471430.626428
420.3224810.6449610.677519
430.3032520.6065040.696748
440.2567280.5134560.743272
450.2337720.4675440.766228
460.1938560.3877130.806144
470.1693270.3386550.830673
480.1792260.3584520.820774
490.1729490.3458970.827051
500.1477190.2954380.852281
510.1202140.2404280.879786
520.1639050.327810.836095
530.1323770.2647540.867623
540.1123480.2246960.887652
550.1178820.2357650.882118
560.09847560.1969510.901524
570.1962780.3925570.803722
580.2594210.5188420.740579
590.2466440.4932890.753356
600.2385750.4771490.761425
610.2186550.437310.781345
620.1980810.3961630.801919
630.2194710.4389430.780529
640.3819240.7638480.618076
650.3464630.6929260.653537
660.3153650.630730.684635
670.2696110.5392220.730389
680.265410.5308190.73459
690.339340.6786810.66066
700.3109580.6219160.689042
710.2840240.5680480.715976
720.2440810.4881630.755919
730.2230340.4460680.776966
740.2996250.5992490.700375
750.2899750.5799510.710025
760.2977650.595530.702235
770.290090.580180.70991
780.3127810.6255620.687219
790.2629250.5258490.737075
800.2692740.5385480.730726
810.2242780.4485550.775722
820.2606770.5213530.739323
830.2185970.4371930.781403
840.4781860.9563710.521814
850.4173740.8347480.582626
860.3793750.758750.620625
870.3326130.6652260.667387
880.2904930.5809860.709507
890.2584440.5168880.741556
900.2963080.5926170.703692
910.3061550.612310.693845
920.4411750.882350.558825
930.3710710.7421410.628929
940.3201950.640390.679805
950.308710.6174190.69129
960.2554330.5108670.744567
970.312430.624860.68757
980.2450720.4901430.754928
990.2705170.5410340.729483
1000.2527250.5054490.747275
1010.1847120.3694250.815288
1020.1269440.2538880.873056
1030.09021910.1804380.909781
1040.05460950.1092190.945391
1050.1275440.2550880.872456
1060.091740.183480.90826
1070.684660.630680.31534


Meta Analysis of Goldfeld-Quandt test for Heteroskedasticity
Description# significant tests% significant testsOK/NOK
1% type I error level00OK
5% type I error level00OK
10% type I error level00OK

\begin{tabular}{lllllllll}
\hline
Meta Analysis of Goldfeld-Quandt test for Heteroskedasticity \tabularnewline
Description & # significant tests & % significant tests & OK/NOK \tabularnewline
1% type I error level & 0 & 0 & OK \tabularnewline
5% type I error level & 0 & 0 & OK \tabularnewline
10% type I error level & 0 & 0 & OK \tabularnewline
\hline
\end{tabular}
%Source: https://freestatistics.org/blog/index.php?pk=265016&T=6

[TABLE]
[ROW][C]Meta Analysis of Goldfeld-Quandt test for Heteroskedasticity[/C][/ROW]
[ROW][C]Description[/C][C]# significant tests[/C][C]% significant tests[/C][C]OK/NOK[/C][/ROW]
[ROW][C]1% type I error level[/C][C]0[/C][C]0[/C][C]OK[/C][/ROW]
[ROW][C]5% type I error level[/C][C]0[/C][C]0[/C][C]OK[/C][/ROW]
[ROW][C]10% type I error level[/C][C]0[/C][C]0[/C][C]OK[/C][/ROW]
[/TABLE]
Source: https://freestatistics.org/blog/index.php?pk=265016&T=6

Globally Unique Identifier (entire table): ba.freestatistics.org/blog/index.php?pk=265016&T=6

As an alternative you can also use a QR Code:  

The GUIDs for individual cells are displayed in the table below:

Meta Analysis of Goldfeld-Quandt test for Heteroskedasticity
Description# significant tests% significant testsOK/NOK
1% type I error level00OK
5% type I error level00OK
10% type I error level00OK


Parameters (Session):
par1 = 1 ; par2 = Do not include Seasonal Dummies ; par3 = No Linear Trend ;
Parameters (R input):
par1 = 1 ; par2 = Do not include Seasonal Dummies ; par3 = No Linear Trend ;
R code (references can be found in the software module):
library(lattice)
library(lmtest)
n25 <- 25 #minimum number of obs. for Goldfeld-Quandt test
par1 <- as.numeric(par1)
x <- t(y)
k <- length(x[1,])
n <- length(x[,1])
x1 <- cbind(x[,par1], x[,1:k!=par1])
mycolnames <- c(colnames(x)[par1], colnames(x)[1:k!=par1])
colnames(x1) <- mycolnames #colnames(x)[par1]
x <- x1
if (par3 == 'First Differences'){
x2 <- array(0, dim=c(n-1,k), dimnames=list(1:(n-1), paste('(1-B)',colnames(x),sep='')))
for (i in 1:n-1) {
for (j in 1:k) {
x2[i,j] <- x[i+1,j] - x[i,j]
}
}
x <- x2
}
if (par2 == 'Include Monthly Dummies'){
x2 <- array(0, dim=c(n,11), dimnames=list(1:n, paste('M', seq(1:11), sep ='')))
for (i in 1:11){
x2[seq(i,n,12),i] <- 1
}
x <- cbind(x, x2)
}
if (par2 == 'Include Quarterly Dummies'){
x2 <- array(0, dim=c(n,3), dimnames=list(1:n, paste('Q', seq(1:3), sep ='')))
for (i in 1:3){
x2[seq(i,n,4),i] <- 1
}
x <- cbind(x, x2)
}
k <- length(x[1,])
if (par3 == 'Linear Trend'){
x <- cbind(x, c(1:n))
colnames(x)[k+1] <- 't'
}
x
k <- length(x[1,])
df <- as.data.frame(x)
(mylm <- lm(df))
(mysum <- summary(mylm))
if (n > n25) {
kp3 <- k + 3
nmkm3 <- n - k - 3
gqarr <- array(NA, dim=c(nmkm3-kp3+1,3))
numgqtests <- 0
numsignificant1 <- 0
numsignificant5 <- 0
numsignificant10 <- 0
for (mypoint in kp3:nmkm3) {
j <- 0
numgqtests <- numgqtests + 1
for (myalt in c('greater', 'two.sided', 'less')) {
j <- j + 1
gqarr[mypoint-kp3+1,j] <- gqtest(mylm, point=mypoint, alternative=myalt)$p.value
}
if (gqarr[mypoint-kp3+1,2] < 0.01) numsignificant1 <- numsignificant1 + 1
if (gqarr[mypoint-kp3+1,2] < 0.05) numsignificant5 <- numsignificant5 + 1
if (gqarr[mypoint-kp3+1,2] < 0.10) numsignificant10 <- numsignificant10 + 1
}
gqarr
}
bitmap(file='test0.png')
plot(x[,1], type='l', main='Actuals and Interpolation', ylab='value of Actuals and Interpolation (dots)', xlab='time or index')
points(x[,1]-mysum$resid)
grid()
dev.off()
bitmap(file='test1.png')
plot(mysum$resid, type='b', pch=19, main='Residuals', ylab='value of Residuals', xlab='time or index')
grid()
dev.off()
bitmap(file='test2.png')
hist(mysum$resid, main='Residual Histogram', xlab='values of Residuals')
grid()
dev.off()
bitmap(file='test3.png')
densityplot(~mysum$resid,col='black',main='Residual Density Plot', xlab='values of Residuals')
dev.off()
bitmap(file='test4.png')
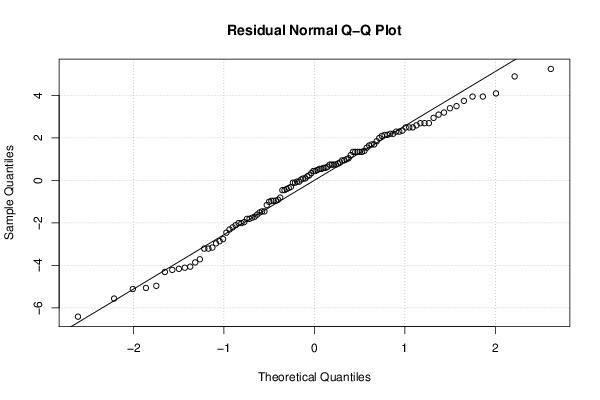
qqnorm(mysum$resid, main='Residual Normal Q-Q Plot')
qqline(mysum$resid)
grid()
dev.off()
(myerror <- as.ts(mysum$resid))
bitmap(file='test5.png')
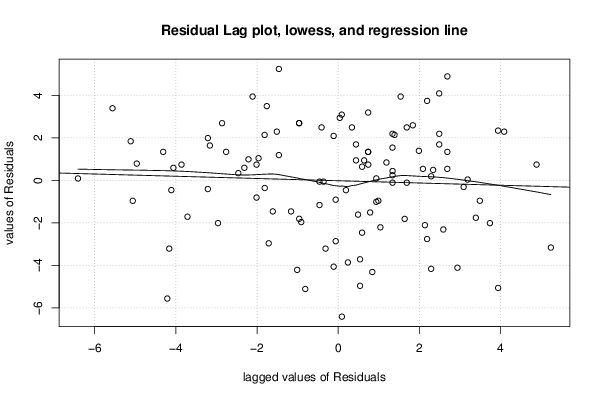
dum <- cbind(lag(myerror,k=1),myerror)
dum
dum1 <- dum[2:length(myerror),]
dum1
z <- as.data.frame(dum1)
z
plot(z,main=paste('Residual Lag plot, lowess, and regression line'), ylab='values of Residuals', xlab='lagged values of Residuals')
lines(lowess(z))
abline(lm(z))
grid()
dev.off()
bitmap(file='test6.png')
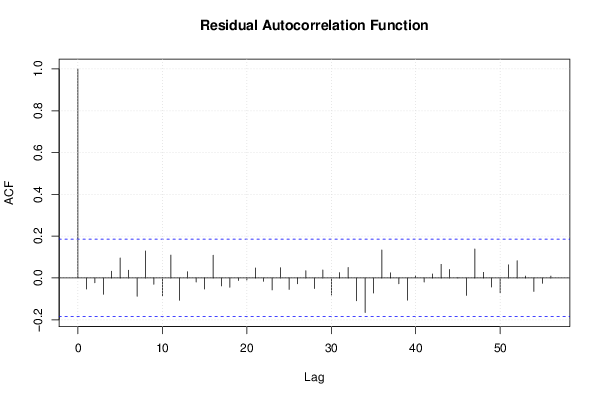
acf(mysum$resid, lag.max=length(mysum$resid)/2, main='Residual Autocorrelation Function')
grid()
dev.off()
bitmap(file='test7.png')
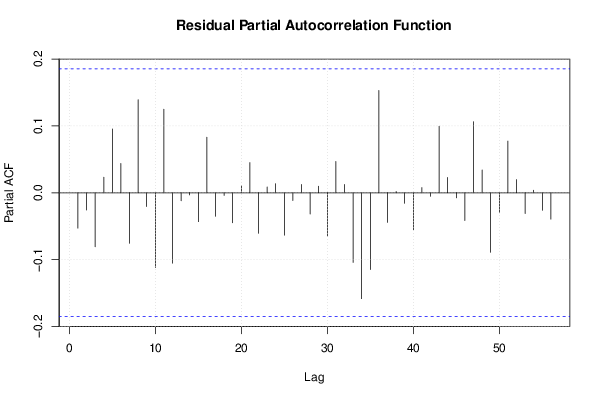
pacf(mysum$resid, lag.max=length(mysum$resid)/2, main='Residual Partial Autocorrelation Function')
grid()
dev.off()
bitmap(file='test8.png')
opar <- par(mfrow = c(2,2), oma = c(0, 0, 1.1, 0))
plot(mylm, las = 1, sub='Residual Diagnostics')
par(opar)
dev.off()
if (n > n25) {
bitmap(file='test9.png')
plot(kp3:nmkm3,gqarr[,2], main='Goldfeld-Quandt test',ylab='2-sided p-value',xlab='breakpoint')
grid()
dev.off()
}
load(file='createtable')
a<-table.start()
a<-table.row.start(a)
a<-table.element(a, 'Multiple Linear Regression - Estimated Regression Equation', 1, TRUE)
a<-table.row.end(a)
myeq <- colnames(x)[1]
myeq <- paste(myeq, '[t] = ', sep='')
for (i in 1:k){
if (mysum$coefficients[i,1] > 0) myeq <- paste(myeq, '+', '')
myeq <- paste(myeq, signif(mysum$coefficients[i,1],6), sep=' ')
if (rownames(mysum$coefficients)[i] != '(Intercept)') {
myeq <- paste(myeq, rownames(mysum$coefficients)[i], sep='')
if (rownames(mysum$coefficients)[i] != 't') myeq <- paste(myeq, '[t]', sep='')
}
}
myeq <- paste(myeq, ' + e[t]')
a<-table.row.start(a)
a<-table.element(a, myeq)
a<-table.row.end(a)
a<-table.end(a)
table.save(a,file='mytable1.tab')
a<-table.start()
a<-table.row.start(a)
a<-table.element(a,hyperlink('ols1.htm','Multiple Linear Regression - Ordinary Least Squares',''), 6, TRUE)
a<-table.row.end(a)
a<-table.row.start(a)
a<-table.element(a,'Variable',header=TRUE)
a<-table.element(a,'Parameter',header=TRUE)
a<-table.element(a,'S.D.',header=TRUE)
a<-table.element(a,'T-STAT
H0: parameter = 0',header=TRUE)
a<-table.element(a,'2-tail p-value',header=TRUE)
a<-table.element(a,'1-tail p-value',header=TRUE)
a<-table.row.end(a)
for (i in 1:k){
a<-table.row.start(a)
a<-table.element(a,rownames(mysum$coefficients)[i],header=TRUE)
a<-table.element(a,signif(mysum$coefficients[i,1],6))
a<-table.element(a, signif(mysum$coefficients[i,2],6))
a<-table.element(a, signif(mysum$coefficients[i,3],4))
a<-table.element(a, signif(mysum$coefficients[i,4],6))
a<-table.element(a, signif(mysum$coefficients[i,4]/2,6))
a<-table.row.end(a)
}
a<-table.end(a)
table.save(a,file='mytable2.tab')
a<-table.start()
a<-table.row.start(a)
a<-table.element(a, 'Multiple Linear Regression - Regression Statistics', 2, TRUE)
a<-table.row.end(a)
a<-table.row.start(a)
a<-table.element(a, 'Multiple R',1,TRUE)
a<-table.element(a, signif(sqrt(mysum$r.squared),6))
a<-table.row.end(a)
a<-table.row.start(a)
a<-table.element(a, 'R-squared',1,TRUE)
a<-table.element(a, signif(mysum$r.squared,6))
a<-table.row.end(a)
a<-table.row.start(a)
a<-table.element(a, 'Adjusted R-squared',1,TRUE)
a<-table.element(a, signif(mysum$adj.r.squared,6))
a<-table.row.end(a)
a<-table.row.start(a)
a<-table.element(a, 'F-TEST (value)',1,TRUE)
a<-table.element(a, signif(mysum$fstatistic[1],6))
a<-table.row.end(a)
a<-table.row.start(a)
a<-table.element(a, 'F-TEST (DF numerator)',1,TRUE)
a<-table.element(a, signif(mysum$fstatistic[2],6))
a<-table.row.end(a)
a<-table.row.start(a)
a<-table.element(a, 'F-TEST (DF denominator)',1,TRUE)
a<-table.element(a, signif(mysum$fstatistic[3],6))
a<-table.row.end(a)
a<-table.row.start(a)
a<-table.element(a, 'p-value',1,TRUE)
a<-table.element(a, signif(1-pf(mysum$fstatistic[1],mysum$fstatistic[2],mysum$fstatistic[3]),6))
a<-table.row.end(a)
a<-table.row.start(a)
a<-table.element(a, 'Multiple Linear Regression - Residual Statistics', 2, TRUE)
a<-table.row.end(a)
a<-table.row.start(a)
a<-table.element(a, 'Residual Standard Deviation',1,TRUE)
a<-table.element(a, signif(mysum$sigma,6))
a<-table.row.end(a)
a<-table.row.start(a)
a<-table.element(a, 'Sum Squared Residuals',1,TRUE)
a<-table.element(a, signif(sum(myerror*myerror),6))
a<-table.row.end(a)
a<-table.end(a)
table.save(a,file='mytable3.tab')
a<-table.start()
a<-table.row.start(a)
a<-table.element(a, 'Multiple Linear Regression - Actuals, Interpolation, and Residuals', 4, TRUE)
a<-table.row.end(a)
a<-table.row.start(a)
a<-table.element(a, 'Time or Index', 1, TRUE)
a<-table.element(a, 'Actuals', 1, TRUE)
a<-table.element(a, 'Interpolation
Forecast', 1, TRUE)
a<-table.element(a, 'Residuals
Prediction Error', 1, TRUE)
a<-table.row.end(a)
for (i in 1:n) {
a<-table.row.start(a)
a<-table.element(a,i, 1, TRUE)
a<-table.element(a,signif(x[i],6))
a<-table.element(a,signif(x[i]-mysum$resid[i],6))
a<-table.element(a,signif(mysum$resid[i],6))
a<-table.row.end(a)
}
a<-table.end(a)
table.save(a,file='mytable4.tab')
if (n > n25) {
a<-table.start()
a<-table.row.start(a)
a<-table.element(a,'Goldfeld-Quandt test for Heteroskedasticity',4,TRUE)
a<-table.row.end(a)
a<-table.row.start(a)
a<-table.element(a,'p-values',header=TRUE)
a<-table.element(a,'Alternative Hypothesis',3,header=TRUE)
a<-table.row.end(a)
a<-table.row.start(a)
a<-table.element(a,'breakpoint index',header=TRUE)
a<-table.element(a,'greater',header=TRUE)
a<-table.element(a,'2-sided',header=TRUE)
a<-table.element(a,'less',header=TRUE)
a<-table.row.end(a)
for (mypoint in kp3:nmkm3) {
a<-table.row.start(a)
a<-table.element(a,mypoint,header=TRUE)
a<-table.element(a,signif(gqarr[mypoint-kp3+1,1],6))
a<-table.element(a,signif(gqarr[mypoint-kp3+1,2],6))
a<-table.element(a,signif(gqarr[mypoint-kp3+1,3],6))
a<-table.row.end(a)
}
a<-table.end(a)
table.save(a,file='mytable5.tab')
a<-table.start()
a<-table.row.start(a)
a<-table.element(a,'Meta Analysis of Goldfeld-Quandt test for Heteroskedasticity',4,TRUE)
a<-table.row.end(a)
a<-table.row.start(a)
a<-table.element(a,'Description',header=TRUE)
a<-table.element(a,'# significant tests',header=TRUE)
a<-table.element(a,'% significant tests',header=TRUE)
a<-table.element(a,'OK/NOK',header=TRUE)
a<-table.row.end(a)
a<-table.row.start(a)
a<-table.element(a,'1% type I error level',header=TRUE)
a<-table.element(a,signif(numsignificant1,6))
a<-table.element(a,signif(numsignificant1/numgqtests,6))
if (numsignificant1/numgqtests < 0.01) dum <- 'OK' else dum <- 'NOK'
a<-table.element(a,dum)
a<-table.row.end(a)
a<-table.row.start(a)
a<-table.element(a,'5% type I error level',header=TRUE)
a<-table.element(a,signif(numsignificant5,6))
a<-table.element(a,signif(numsignificant5/numgqtests,6))
if (numsignificant5/numgqtests < 0.05) dum <- 'OK' else dum <- 'NOK'
a<-table.element(a,dum)
a<-table.row.end(a)
a<-table.row.start(a)
a<-table.element(a,'10% type I error level',header=TRUE)
a<-table.element(a,signif(numsignificant10,6))
a<-table.element(a,signif(numsignificant10/numgqtests,6))
if (numsignificant10/numgqtests < 0.1) dum <- 'OK' else dum <- 'NOK'
a<-table.element(a,dum)
a<-table.row.end(a)
a<-table.end(a)
table.save(a,file='mytable6.tab')
}