Free Statistics

of Irreproducible Research!

Author's title

Author*The author of this computation has been verified*
R Software Modulerwasp_density.wasp
Title produced by softwareKernel Density Estimation
Date of computationWed, 17 Dec 2014 19:47:37 +0000
Cite this page as followsStatistical Computations at FreeStatistics.org, Office for Research Development and Education, URL https://freestatistics.org/blog/index.php?v=date/2014/Dec/17/t141884568103m5kikyll2w5xn.htm/, Retrieved Sun, 19 May 2024 03:11:55 +0000
Statistical Computations at FreeStatistics.org, Office for Research Development and Education, URL https://freestatistics.org/blog/index.php?pk=270617, Retrieved Sun, 19 May 2024 03:11:55 +0000
QR Codes:

Original text written by user:
IsPrivate?No (this computation is public)
User-defined keywords
Estimated Impact99
Family? (F = Feedback message, R = changed R code, M = changed R Module, P = changed Parameters, D = changed Data)
-     [Histogram] [Frequency Plot (B...] [2014-10-01 12:48:26] [1a6d42b46b3d01bc960fcfb45e99fecd]
-   PD  [Histogram] [leeftijd studenten] [2014-12-17 14:57:15] [be945163e51ed825733188af308451be]
- RMP       [Kernel Density Estimation] [age] [2014-12-17 19:47:37] [88f8137dd67cdcd531568536dca46410] [Current]
Feedback Forum

Post a new message
Dataseries X:
21
22
21
21
21
21
21
23
22
25
21
23
22
21
21
25
21
21
20
24
23
21
24
23
21
22
20
18
21
22
22
21
21
25
22
22
20
21
21
21
22
21
24
22
22
21
22
19
22
23
20
20
23
20
23
21
22
21
21
19
22
21
21
21
21
21
21
22
22
18
21
23
19
19
21
21
21
20
19
21
19
19
19
20
19
19
19
20
19
18
19
21
18
18
19
21
20
24
22
21
21
19
19
20
18
19
19
20
21
18
19
19
22
22
22
20
19
20
22
21
21
21
21
21
21
21
22
24
21
22
20
21
24
25
22
21
21
22
23
24
20
22
25
22
21
21
21
22
22
21
22
23
21
21
21
19
21
21
19
18
19
21
22
22
19
20
19
21
19
20
21
19
21
21
21
19
25
21
20
25
19
20
22
19
20
19
19
18
19
21
19
20
20
19
19
22
21
19
19
19
23
19
20
19
22
19
25
19
19
19
20
20
21
19
21
23
19
22
20
18
21
20
21
21
21
19
21
19
21
21
22
21
22
22
22
22
21
22
23
19
22
21
19
19
20
18
21
21
20
20
21
21
19
19
21
19
19
24
19
19
20
19
19
19
19
19
19
20
20
19
21
19
19
19
21
22
19
19


Summary of computational transaction
Raw Inputview raw input (R code)
Raw Outputview raw output of R engine
Computing time4 seconds
R Server'Sir Maurice George Kendall' @ kendall.wessa.net

\begin{tabular}{lllllllll}
\hline
Summary of computational transaction \tabularnewline
Raw Input & view raw input (R code)  \tabularnewline
Raw Output & view raw output of R engine  \tabularnewline
Computing time & 4 seconds \tabularnewline
R Server & 'Sir Maurice George Kendall' @ kendall.wessa.net \tabularnewline
\hline
\end{tabular}
%Source: https://freestatistics.org/blog/index.php?pk=270617&T=0

[TABLE]
[ROW][C]Summary of computational transaction[/C][/ROW]
[ROW][C]Raw Input[/C][C]view raw input (R code) [/C][/ROW]
[ROW][C]Raw Output[/C][C]view raw output of R engine [/C][/ROW]
[ROW][C]Computing time[/C][C]4 seconds[/C][/ROW]
[ROW][C]R Server[/C][C]'Sir Maurice George Kendall' @ kendall.wessa.net[/C][/ROW]
[/TABLE]
Source: https://freestatistics.org/blog/index.php?pk=270617&T=0

Globally Unique Identifier (entire table): ba.freestatistics.org/blog/index.php?pk=270617&T=0

As an alternative you can also use a QR Code:  

The GUIDs for individual cells are displayed in the table below:

Summary of computational transaction
Raw Inputview raw input (R code)
Raw Outputview raw output of R engine
Computing time4 seconds
R Server'Sir Maurice George Kendall' @ kendall.wessa.net


Properties of Density Trace
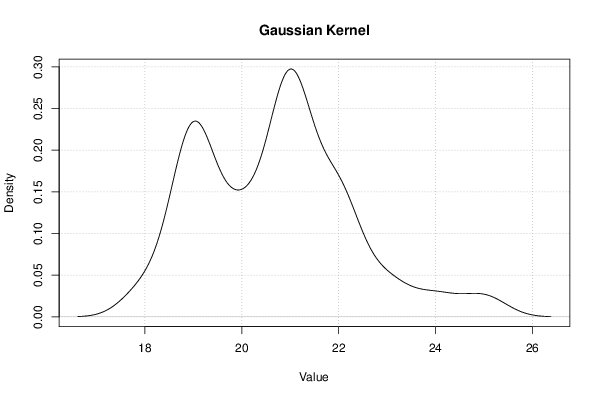
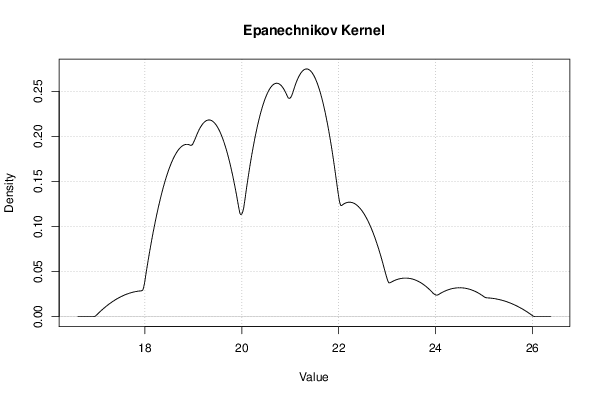
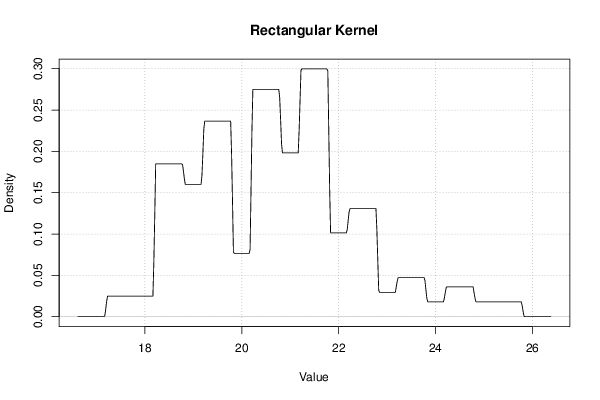
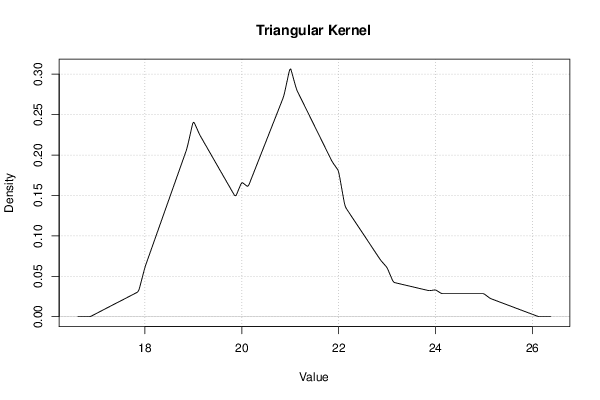
Bandwidth0.46084972981946
#Observations278

\begin{tabular}{lllllllll}
\hline
Properties of Density Trace \tabularnewline
Bandwidth & 0.46084972981946 \tabularnewline
#Observations & 278 \tabularnewline
\hline
\end{tabular}
%Source: https://freestatistics.org/blog/index.php?pk=270617&T=1

[TABLE]
[ROW][C]Properties of Density Trace[/C][/ROW]
[ROW][C]Bandwidth[/C][C]0.46084972981946[/C][/ROW]
[ROW][C]#Observations[/C][C]278[/C][/ROW]
[/TABLE]
Source: https://freestatistics.org/blog/index.php?pk=270617&T=1

Globally Unique Identifier (entire table): ba.freestatistics.org/blog/index.php?pk=270617&T=1

As an alternative you can also use a QR Code:  

The GUIDs for individual cells are displayed in the table below:

Properties of Density Trace
Bandwidth0.46084972981946
#Observations278


Maximum Density Values
Kernelx-valuemax. density
Gaussian21.01270057013230.297558100698876
Epanechnikov21.33756685671080.274827206845523
Rectangular21.24201794889360.299679396065033
Triangular21.01270057013230.306535759367577
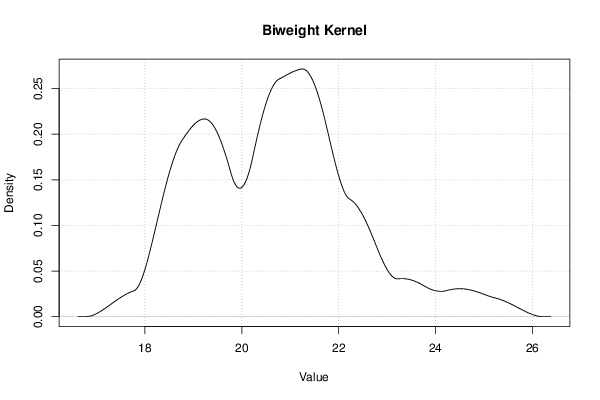
Biweight21.24201794889360.271511257031226
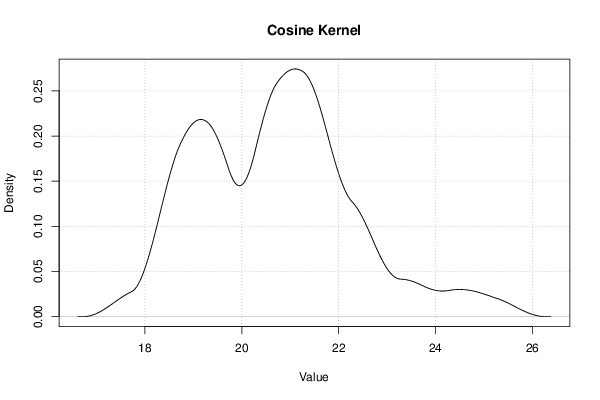
Cosine21.10824947794950.274283646469291
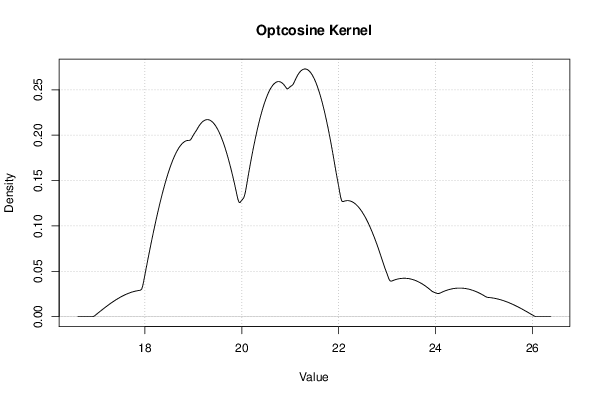
Optcosine21.29934729358390.272939340790838

\begin{tabular}{lllllllll}
\hline
Maximum Density Values \tabularnewline
Kernel & x-value & max. density \tabularnewline
Gaussian & 21.0127005701323 & 0.297558100698876 \tabularnewline
Epanechnikov & 21.3375668567108 & 0.274827206845523 \tabularnewline
Rectangular & 21.2420179488936 & 0.299679396065033 \tabularnewline
Triangular & 21.0127005701323 & 0.306535759367577 \tabularnewline
Biweight & 21.2420179488936 & 0.271511257031226 \tabularnewline
Cosine & 21.1082494779495 & 0.274283646469291 \tabularnewline
Optcosine & 21.2993472935839 & 0.272939340790838 \tabularnewline
 \hline
\end{tabular}
%Source: https://freestatistics.org/blog/index.php?pk=270617&T=2

[TABLE]
[ROW][C]Maximum Density Values[/C][/ROW]
[ROW][C]Kernel[/C][C]x-value[/C][C]max. density[/C][/ROW]
[ROW][C]Gaussian[/C][C]21.0127005701323[/C][C]0.297558100698876[/C][/ROW]
[ROW][C]Epanechnikov[/C][C]21.3375668567108[/C][C]0.274827206845523[/C][/ROW]
[ROW][C]Rectangular[/C][C]21.2420179488936[/C][C]0.299679396065033[/C][/ROW]
[ROW][C]Triangular[/C][C]21.0127005701323[/C][C]0.306535759367577[/C][/ROW]
[ROW][C]Biweight[/C][C]21.2420179488936[/C][C]0.271511257031226[/C][/ROW]
[ROW][C]Cosine[/C][C]21.1082494779495[/C][C]0.274283646469291[/C][/ROW]
[ROW][C]Optcosine[/C][C]21.2993472935839[/C][C]0.272939340790838[/C][/ROW]
 [/TABLE]
Source: https://freestatistics.org/blog/index.php?pk=270617&T=2

Globally Unique Identifier (entire table): ba.freestatistics.org/blog/index.php?pk=270617&T=2

As an alternative you can also use a QR Code:  

The GUIDs for individual cells are displayed in the table below:

Maximum Density Values
Kernelx-valuemax. density
Gaussian21.01270057013230.297558100698876
Epanechnikov21.33756685671080.274827206845523
Rectangular21.24201794889360.299679396065033
Triangular21.01270057013230.306535759367577
Biweight21.24201794889360.271511257031226
Cosine21.10824947794950.274283646469291
Optcosine21.29934729358390.272939340790838


Maximum Density Values
Kernelx-valuemax. density
Gaussian21.01270057013230.297558100698876
Epanechnikov21.33756685671080.274827206845523
Rectangular21.2611277304570.299679396065033
Triangular21.01270057013230.306535759367577
Biweight21.24201794889360.271511257031226
Cosine21.10824947794950.274283646469291
Optcosine21.29934729358390.272939340790838

\begin{tabular}{lllllllll}
\hline
Maximum Density Values \tabularnewline
Kernel & x-value & max. density \tabularnewline
Gaussian & 21.0127005701323 & 0.297558100698876 \tabularnewline
Epanechnikov & 21.3375668567108 & 0.274827206845523 \tabularnewline
Rectangular & 21.261127730457 & 0.299679396065033 \tabularnewline
Triangular & 21.0127005701323 & 0.306535759367577 \tabularnewline
Biweight & 21.2420179488936 & 0.271511257031226 \tabularnewline
Cosine & 21.1082494779495 & 0.274283646469291 \tabularnewline
Optcosine & 21.2993472935839 & 0.272939340790838 \tabularnewline
 \hline
\end{tabular}
%Source: https://freestatistics.org/blog/index.php?pk=270617&T=3

[TABLE]
[ROW][C]Maximum Density Values[/C][/ROW]
[ROW][C]Kernel[/C][C]x-value[/C][C]max. density[/C][/ROW]
[ROW][C]Gaussian[/C][C]21.0127005701323[/C][C]0.297558100698876[/C][/ROW]
[ROW][C]Epanechnikov[/C][C]21.3375668567108[/C][C]0.274827206845523[/C][/ROW]
[ROW][C]Rectangular[/C][C]21.261127730457[/C][C]0.299679396065033[/C][/ROW]
[ROW][C]Triangular[/C][C]21.0127005701323[/C][C]0.306535759367577[/C][/ROW]
[ROW][C]Biweight[/C][C]21.2420179488936[/C][C]0.271511257031226[/C][/ROW]
[ROW][C]Cosine[/C][C]21.1082494779495[/C][C]0.274283646469291[/C][/ROW]
[ROW][C]Optcosine[/C][C]21.2993472935839[/C][C]0.272939340790838[/C][/ROW]
 [/TABLE]
Source: https://freestatistics.org/blog/index.php?pk=270617&T=3

Globally Unique Identifier (entire table): ba.freestatistics.org/blog/index.php?pk=270617&T=3

As an alternative you can also use a QR Code:  

The GUIDs for individual cells are displayed in the table below:

Maximum Density Values
Kernelx-valuemax. density
Gaussian21.01270057013230.297558100698876
Epanechnikov21.33756685671080.274827206845523
Rectangular21.2611277304570.299679396065033
Triangular21.01270057013230.306535759367577
Biweight21.24201794889360.271511257031226
Cosine21.10824947794950.274283646469291
Optcosine21.29934729358390.272939340790838


Maximum Density Values
Kernelx-valuemax. density
Gaussian21.01270057013230.297558100698876
Epanechnikov21.33756685671080.274827206845523
Rectangular21.28023751202050.299679396065033
Triangular21.01270057013230.306535759367577
Biweight21.24201794889360.271511257031226
Cosine21.10824947794950.274283646469291
Optcosine21.29934729358390.272939340790838

\begin{tabular}{lllllllll}
\hline
Maximum Density Values \tabularnewline
Kernel & x-value & max. density \tabularnewline
Gaussian & 21.0127005701323 & 0.297558100698876 \tabularnewline
Epanechnikov & 21.3375668567108 & 0.274827206845523 \tabularnewline
Rectangular & 21.2802375120205 & 0.299679396065033 \tabularnewline
Triangular & 21.0127005701323 & 0.306535759367577 \tabularnewline
Biweight & 21.2420179488936 & 0.271511257031226 \tabularnewline
Cosine & 21.1082494779495 & 0.274283646469291 \tabularnewline
Optcosine & 21.2993472935839 & 0.272939340790838 \tabularnewline
 \hline
\end{tabular}
%Source: https://freestatistics.org/blog/index.php?pk=270617&T=4

[TABLE]
[ROW][C]Maximum Density Values[/C][/ROW]
[ROW][C]Kernel[/C][C]x-value[/C][C]max. density[/C][/ROW]
[ROW][C]Gaussian[/C][C]21.0127005701323[/C][C]0.297558100698876[/C][/ROW]
[ROW][C]Epanechnikov[/C][C]21.3375668567108[/C][C]0.274827206845523[/C][/ROW]
[ROW][C]Rectangular[/C][C]21.2802375120205[/C][C]0.299679396065033[/C][/ROW]
[ROW][C]Triangular[/C][C]21.0127005701323[/C][C]0.306535759367577[/C][/ROW]
[ROW][C]Biweight[/C][C]21.2420179488936[/C][C]0.271511257031226[/C][/ROW]
[ROW][C]Cosine[/C][C]21.1082494779495[/C][C]0.274283646469291[/C][/ROW]
[ROW][C]Optcosine[/C][C]21.2993472935839[/C][C]0.272939340790838[/C][/ROW]
 [/TABLE]
Source: https://freestatistics.org/blog/index.php?pk=270617&T=4

Globally Unique Identifier (entire table): ba.freestatistics.org/blog/index.php?pk=270617&T=4

As an alternative you can also use a QR Code:  

The GUIDs for individual cells are displayed in the table below:

Maximum Density Values
Kernelx-valuemax. density
Gaussian21.01270057013230.297558100698876
Epanechnikov21.33756685671080.274827206845523
Rectangular21.28023751202050.299679396065033
Triangular21.01270057013230.306535759367577
Biweight21.24201794889360.271511257031226
Cosine21.10824947794950.274283646469291
Optcosine21.29934729358390.272939340790838


Maximum Density Values
Kernelx-valuemax. density
Gaussian21.01270057013230.297558100698876
Epanechnikov21.33756685671080.274827206845523
Rectangular21.29934729358390.299679396065033
Triangular21.01270057013230.306535759367577
Biweight21.24201794889360.271511257031226
Cosine21.10824947794950.274283646469291
Optcosine21.29934729358390.272939340790838

\begin{tabular}{lllllllll}
\hline
Maximum Density Values \tabularnewline
Kernel & x-value & max. density \tabularnewline
Gaussian & 21.0127005701323 & 0.297558100698876 \tabularnewline
Epanechnikov & 21.3375668567108 & 0.274827206845523 \tabularnewline
Rectangular & 21.2993472935839 & 0.299679396065033 \tabularnewline
Triangular & 21.0127005701323 & 0.306535759367577 \tabularnewline
Biweight & 21.2420179488936 & 0.271511257031226 \tabularnewline
Cosine & 21.1082494779495 & 0.274283646469291 \tabularnewline
Optcosine & 21.2993472935839 & 0.272939340790838 \tabularnewline
 \hline
\end{tabular}
%Source: https://freestatistics.org/blog/index.php?pk=270617&T=5

[TABLE]
[ROW][C]Maximum Density Values[/C][/ROW]
[ROW][C]Kernel[/C][C]x-value[/C][C]max. density[/C][/ROW]
[ROW][C]Gaussian[/C][C]21.0127005701323[/C][C]0.297558100698876[/C][/ROW]
[ROW][C]Epanechnikov[/C][C]21.3375668567108[/C][C]0.274827206845523[/C][/ROW]
[ROW][C]Rectangular[/C][C]21.2993472935839[/C][C]0.299679396065033[/C][/ROW]
[ROW][C]Triangular[/C][C]21.0127005701323[/C][C]0.306535759367577[/C][/ROW]
[ROW][C]Biweight[/C][C]21.2420179488936[/C][C]0.271511257031226[/C][/ROW]
[ROW][C]Cosine[/C][C]21.1082494779495[/C][C]0.274283646469291[/C][/ROW]
[ROW][C]Optcosine[/C][C]21.2993472935839[/C][C]0.272939340790838[/C][/ROW]
 [/TABLE]
Source: https://freestatistics.org/blog/index.php?pk=270617&T=5

Globally Unique Identifier (entire table): ba.freestatistics.org/blog/index.php?pk=270617&T=5

As an alternative you can also use a QR Code:  

The GUIDs for individual cells are displayed in the table below:

Maximum Density Values
Kernelx-valuemax. density
Gaussian21.01270057013230.297558100698876
Epanechnikov21.33756685671080.274827206845523
Rectangular21.29934729358390.299679396065033
Triangular21.01270057013230.306535759367577
Biweight21.24201794889360.271511257031226
Cosine21.10824947794950.274283646469291
Optcosine21.29934729358390.272939340790838


Maximum Density Values
Kernelx-valuemax. density
Gaussian21.01270057013230.297558100698876
Epanechnikov21.33756685671080.274827206845523
Rectangular21.31845707514730.299679396065033
Triangular21.01270057013230.306535759367577
Biweight21.24201794889360.271511257031226
Cosine21.10824947794950.274283646469291
Optcosine21.29934729358390.272939340790838

\begin{tabular}{lllllllll}
\hline
Maximum Density Values \tabularnewline
Kernel & x-value & max. density \tabularnewline
Gaussian & 21.0127005701323 & 0.297558100698876 \tabularnewline
Epanechnikov & 21.3375668567108 & 0.274827206845523 \tabularnewline
Rectangular & 21.3184570751473 & 0.299679396065033 \tabularnewline
Triangular & 21.0127005701323 & 0.306535759367577 \tabularnewline
Biweight & 21.2420179488936 & 0.271511257031226 \tabularnewline
Cosine & 21.1082494779495 & 0.274283646469291 \tabularnewline
Optcosine & 21.2993472935839 & 0.272939340790838 \tabularnewline
 \hline
\end{tabular}
%Source: https://freestatistics.org/blog/index.php?pk=270617&T=6

[TABLE]
[ROW][C]Maximum Density Values[/C][/ROW]
[ROW][C]Kernel[/C][C]x-value[/C][C]max. density[/C][/ROW]
[ROW][C]Gaussian[/C][C]21.0127005701323[/C][C]0.297558100698876[/C][/ROW]
[ROW][C]Epanechnikov[/C][C]21.3375668567108[/C][C]0.274827206845523[/C][/ROW]
[ROW][C]Rectangular[/C][C]21.3184570751473[/C][C]0.299679396065033[/C][/ROW]
[ROW][C]Triangular[/C][C]21.0127005701323[/C][C]0.306535759367577[/C][/ROW]
[ROW][C]Biweight[/C][C]21.2420179488936[/C][C]0.271511257031226[/C][/ROW]
[ROW][C]Cosine[/C][C]21.1082494779495[/C][C]0.274283646469291[/C][/ROW]
[ROW][C]Optcosine[/C][C]21.2993472935839[/C][C]0.272939340790838[/C][/ROW]
 [/TABLE]
Source: https://freestatistics.org/blog/index.php?pk=270617&T=6

Globally Unique Identifier (entire table): ba.freestatistics.org/blog/index.php?pk=270617&T=6

As an alternative you can also use a QR Code:  

The GUIDs for individual cells are displayed in the table below:

Maximum Density Values
Kernelx-valuemax. density
Gaussian21.01270057013230.297558100698876
Epanechnikov21.33756685671080.274827206845523
Rectangular21.31845707514730.299679396065033
Triangular21.01270057013230.306535759367577
Biweight21.24201794889360.271511257031226
Cosine21.10824947794950.274283646469291
Optcosine21.29934729358390.272939340790838


Maximum Density Values
Kernelx-valuemax. density
Gaussian21.01270057013230.297558100698876
Epanechnikov21.33756685671080.274827206845523
Rectangular21.33756685671080.299679396065033
Triangular21.01270057013230.306535759367577
Biweight21.24201794889360.271511257031226
Cosine21.10824947794950.274283646469291
Optcosine21.29934729358390.272939340790838

\begin{tabular}{lllllllll}
\hline
Maximum Density Values \tabularnewline
Kernel & x-value & max. density \tabularnewline
Gaussian & 21.0127005701323 & 0.297558100698876 \tabularnewline
Epanechnikov & 21.3375668567108 & 0.274827206845523 \tabularnewline
Rectangular & 21.3375668567108 & 0.299679396065033 \tabularnewline
Triangular & 21.0127005701323 & 0.306535759367577 \tabularnewline
Biweight & 21.2420179488936 & 0.271511257031226 \tabularnewline
Cosine & 21.1082494779495 & 0.274283646469291 \tabularnewline
Optcosine & 21.2993472935839 & 0.272939340790838 \tabularnewline
 \hline
\end{tabular}
%Source: https://freestatistics.org/blog/index.php?pk=270617&T=7

[TABLE]
[ROW][C]Maximum Density Values[/C][/ROW]
[ROW][C]Kernel[/C][C]x-value[/C][C]max. density[/C][/ROW]
[ROW][C]Gaussian[/C][C]21.0127005701323[/C][C]0.297558100698876[/C][/ROW]
[ROW][C]Epanechnikov[/C][C]21.3375668567108[/C][C]0.274827206845523[/C][/ROW]
[ROW][C]Rectangular[/C][C]21.3375668567108[/C][C]0.299679396065033[/C][/ROW]
[ROW][C]Triangular[/C][C]21.0127005701323[/C][C]0.306535759367577[/C][/ROW]
[ROW][C]Biweight[/C][C]21.2420179488936[/C][C]0.271511257031226[/C][/ROW]
[ROW][C]Cosine[/C][C]21.1082494779495[/C][C]0.274283646469291[/C][/ROW]
[ROW][C]Optcosine[/C][C]21.2993472935839[/C][C]0.272939340790838[/C][/ROW]
 [/TABLE]
Source: https://freestatistics.org/blog/index.php?pk=270617&T=7

Globally Unique Identifier (entire table): ba.freestatistics.org/blog/index.php?pk=270617&T=7

As an alternative you can also use a QR Code:  

The GUIDs for individual cells are displayed in the table below:

Maximum Density Values
Kernelx-valuemax. density
Gaussian21.01270057013230.297558100698876
Epanechnikov21.33756685671080.274827206845523
Rectangular21.33756685671080.299679396065033
Triangular21.01270057013230.306535759367577
Biweight21.24201794889360.271511257031226
Cosine21.10824947794950.274283646469291
Optcosine21.29934729358390.272939340790838


Maximum Density Values
Kernelx-valuemax. density
Gaussian21.01270057013230.297558100698876
Epanechnikov21.33756685671080.274827206845523
Rectangular21.37578641983770.299679396065033
Triangular21.01270057013230.306535759367577
Biweight21.24201794889360.271511257031226
Cosine21.10824947794950.274283646469291
Optcosine21.29934729358390.272939340790838

\begin{tabular}{lllllllll}
\hline
Maximum Density Values \tabularnewline
Kernel & x-value & max. density \tabularnewline
Gaussian & 21.0127005701323 & 0.297558100698876 \tabularnewline
Epanechnikov & 21.3375668567108 & 0.274827206845523 \tabularnewline
Rectangular & 21.3757864198377 & 0.299679396065033 \tabularnewline
Triangular & 21.0127005701323 & 0.306535759367577 \tabularnewline
Biweight & 21.2420179488936 & 0.271511257031226 \tabularnewline
Cosine & 21.1082494779495 & 0.274283646469291 \tabularnewline
Optcosine & 21.2993472935839 & 0.272939340790838 \tabularnewline
 \hline
\end{tabular}
%Source: https://freestatistics.org/blog/index.php?pk=270617&T=8

[TABLE]
[ROW][C]Maximum Density Values[/C][/ROW]
[ROW][C]Kernel[/C][C]x-value[/C][C]max. density[/C][/ROW]
[ROW][C]Gaussian[/C][C]21.0127005701323[/C][C]0.297558100698876[/C][/ROW]
[ROW][C]Epanechnikov[/C][C]21.3375668567108[/C][C]0.274827206845523[/C][/ROW]
[ROW][C]Rectangular[/C][C]21.3757864198377[/C][C]0.299679396065033[/C][/ROW]
[ROW][C]Triangular[/C][C]21.0127005701323[/C][C]0.306535759367577[/C][/ROW]
[ROW][C]Biweight[/C][C]21.2420179488936[/C][C]0.271511257031226[/C][/ROW]
[ROW][C]Cosine[/C][C]21.1082494779495[/C][C]0.274283646469291[/C][/ROW]
[ROW][C]Optcosine[/C][C]21.2993472935839[/C][C]0.272939340790838[/C][/ROW]
 [/TABLE]
Source: https://freestatistics.org/blog/index.php?pk=270617&T=8

Globally Unique Identifier (entire table): ba.freestatistics.org/blog/index.php?pk=270617&T=8

As an alternative you can also use a QR Code:  

The GUIDs for individual cells are displayed in the table below:

Maximum Density Values
Kernelx-valuemax. density
Gaussian21.01270057013230.297558100698876
Epanechnikov21.33756685671080.274827206845523
Rectangular21.37578641983770.299679396065033
Triangular21.01270057013230.306535759367577
Biweight21.24201794889360.271511257031226
Cosine21.10824947794950.274283646469291
Optcosine21.29934729358390.272939340790838


Maximum Density Values
Kernelx-valuemax. density
Gaussian21.01270057013230.297558100698876
Epanechnikov21.33756685671080.274827206845523
Rectangular21.39489620140110.299679396065033
Triangular21.01270057013230.306535759367577
Biweight21.24201794889360.271511257031226
Cosine21.10824947794950.274283646469291
Optcosine21.29934729358390.272939340790838

\begin{tabular}{lllllllll}
\hline
Maximum Density Values \tabularnewline
Kernel & x-value & max. density \tabularnewline
Gaussian & 21.0127005701323 & 0.297558100698876 \tabularnewline
Epanechnikov & 21.3375668567108 & 0.274827206845523 \tabularnewline
Rectangular & 21.3948962014011 & 0.299679396065033 \tabularnewline
Triangular & 21.0127005701323 & 0.306535759367577 \tabularnewline
Biweight & 21.2420179488936 & 0.271511257031226 \tabularnewline
Cosine & 21.1082494779495 & 0.274283646469291 \tabularnewline
Optcosine & 21.2993472935839 & 0.272939340790838 \tabularnewline
 \hline
\end{tabular}
%Source: https://freestatistics.org/blog/index.php?pk=270617&T=9

[TABLE]
[ROW][C]Maximum Density Values[/C][/ROW]
[ROW][C]Kernel[/C][C]x-value[/C][C]max. density[/C][/ROW]
[ROW][C]Gaussian[/C][C]21.0127005701323[/C][C]0.297558100698876[/C][/ROW]
[ROW][C]Epanechnikov[/C][C]21.3375668567108[/C][C]0.274827206845523[/C][/ROW]
[ROW][C]Rectangular[/C][C]21.3948962014011[/C][C]0.299679396065033[/C][/ROW]
[ROW][C]Triangular[/C][C]21.0127005701323[/C][C]0.306535759367577[/C][/ROW]
[ROW][C]Biweight[/C][C]21.2420179488936[/C][C]0.271511257031226[/C][/ROW]
[ROW][C]Cosine[/C][C]21.1082494779495[/C][C]0.274283646469291[/C][/ROW]
[ROW][C]Optcosine[/C][C]21.2993472935839[/C][C]0.272939340790838[/C][/ROW]
 [/TABLE]
Source: https://freestatistics.org/blog/index.php?pk=270617&T=9

Globally Unique Identifier (entire table): ba.freestatistics.org/blog/index.php?pk=270617&T=9

As an alternative you can also use a QR Code:  

The GUIDs for individual cells are displayed in the table below:

Maximum Density Values
Kernelx-valuemax. density
Gaussian21.01270057013230.297558100698876
Epanechnikov21.33756685671080.274827206845523
Rectangular21.39489620140110.299679396065033
Triangular21.01270057013230.306535759367577
Biweight21.24201794889360.271511257031226
Cosine21.10824947794950.274283646469291
Optcosine21.29934729358390.272939340790838


Maximum Density Values
Kernelx-valuemax. density
Gaussian21.01270057013230.297558100698876
Epanechnikov21.33756685671080.274827206845523
Rectangular21.41400598296450.299679396065033
Triangular21.01270057013230.306535759367577
Biweight21.24201794889360.271511257031226
Cosine21.10824947794950.274283646469291
Optcosine21.29934729358390.272939340790838

\begin{tabular}{lllllllll}
\hline
Maximum Density Values \tabularnewline
Kernel & x-value & max. density \tabularnewline
Gaussian & 21.0127005701323 & 0.297558100698876 \tabularnewline
Epanechnikov & 21.3375668567108 & 0.274827206845523 \tabularnewline
Rectangular & 21.4140059829645 & 0.299679396065033 \tabularnewline
Triangular & 21.0127005701323 & 0.306535759367577 \tabularnewline
Biweight & 21.2420179488936 & 0.271511257031226 \tabularnewline
Cosine & 21.1082494779495 & 0.274283646469291 \tabularnewline
Optcosine & 21.2993472935839 & 0.272939340790838 \tabularnewline
 \hline
\end{tabular}
%Source: https://freestatistics.org/blog/index.php?pk=270617&T=10

[TABLE]
[ROW][C]Maximum Density Values[/C][/ROW]
[ROW][C]Kernel[/C][C]x-value[/C][C]max. density[/C][/ROW]
[ROW][C]Gaussian[/C][C]21.0127005701323[/C][C]0.297558100698876[/C][/ROW]
[ROW][C]Epanechnikov[/C][C]21.3375668567108[/C][C]0.274827206845523[/C][/ROW]
[ROW][C]Rectangular[/C][C]21.4140059829645[/C][C]0.299679396065033[/C][/ROW]
[ROW][C]Triangular[/C][C]21.0127005701323[/C][C]0.306535759367577[/C][/ROW]
[ROW][C]Biweight[/C][C]21.2420179488936[/C][C]0.271511257031226[/C][/ROW]
[ROW][C]Cosine[/C][C]21.1082494779495[/C][C]0.274283646469291[/C][/ROW]
[ROW][C]Optcosine[/C][C]21.2993472935839[/C][C]0.272939340790838[/C][/ROW]
 [/TABLE]
Source: https://freestatistics.org/blog/index.php?pk=270617&T=10

Globally Unique Identifier (entire table): ba.freestatistics.org/blog/index.php?pk=270617&T=10

As an alternative you can also use a QR Code:  

The GUIDs for individual cells are displayed in the table below:

Maximum Density Values
Kernelx-valuemax. density
Gaussian21.01270057013230.297558100698876
Epanechnikov21.33756685671080.274827206845523
Rectangular21.41400598296450.299679396065033
Triangular21.01270057013230.306535759367577
Biweight21.24201794889360.271511257031226
Cosine21.10824947794950.274283646469291
Optcosine21.29934729358390.272939340790838


Maximum Density Values
Kernelx-valuemax. density
Gaussian21.01270057013230.297558100698876
Epanechnikov21.33756685671080.274827206845523
Rectangular21.4331157645280.299679396065033
Triangular21.01270057013230.306535759367577
Biweight21.24201794889360.271511257031226
Cosine21.10824947794950.274283646469291
Optcosine21.29934729358390.272939340790838

\begin{tabular}{lllllllll}
\hline
Maximum Density Values \tabularnewline
Kernel & x-value & max. density \tabularnewline
Gaussian & 21.0127005701323 & 0.297558100698876 \tabularnewline
Epanechnikov & 21.3375668567108 & 0.274827206845523 \tabularnewline
Rectangular & 21.433115764528 & 0.299679396065033 \tabularnewline
Triangular & 21.0127005701323 & 0.306535759367577 \tabularnewline
Biweight & 21.2420179488936 & 0.271511257031226 \tabularnewline
Cosine & 21.1082494779495 & 0.274283646469291 \tabularnewline
Optcosine & 21.2993472935839 & 0.272939340790838 \tabularnewline
 \hline
\end{tabular}
%Source: https://freestatistics.org/blog/index.php?pk=270617&T=11

[TABLE]
[ROW][C]Maximum Density Values[/C][/ROW]
[ROW][C]Kernel[/C][C]x-value[/C][C]max. density[/C][/ROW]
[ROW][C]Gaussian[/C][C]21.0127005701323[/C][C]0.297558100698876[/C][/ROW]
[ROW][C]Epanechnikov[/C][C]21.3375668567108[/C][C]0.274827206845523[/C][/ROW]
[ROW][C]Rectangular[/C][C]21.433115764528[/C][C]0.299679396065033[/C][/ROW]
[ROW][C]Triangular[/C][C]21.0127005701323[/C][C]0.306535759367577[/C][/ROW]
[ROW][C]Biweight[/C][C]21.2420179488936[/C][C]0.271511257031226[/C][/ROW]
[ROW][C]Cosine[/C][C]21.1082494779495[/C][C]0.274283646469291[/C][/ROW]
[ROW][C]Optcosine[/C][C]21.2993472935839[/C][C]0.272939340790838[/C][/ROW]
 [/TABLE]
Source: https://freestatistics.org/blog/index.php?pk=270617&T=11

Globally Unique Identifier (entire table): ba.freestatistics.org/blog/index.php?pk=270617&T=11

As an alternative you can also use a QR Code:  

The GUIDs for individual cells are displayed in the table below:

Maximum Density Values
Kernelx-valuemax. density
Gaussian21.01270057013230.297558100698876
Epanechnikov21.33756685671080.274827206845523
Rectangular21.4331157645280.299679396065033
Triangular21.01270057013230.306535759367577
Biweight21.24201794889360.271511257031226
Cosine21.10824947794950.274283646469291
Optcosine21.29934729358390.272939340790838


Maximum Density Values
Kernelx-valuemax. density
Gaussian21.01270057013230.297558100698876
Epanechnikov21.33756685671080.274827206845523
Rectangular21.45222554609140.299679396065033
Triangular21.01270057013230.306535759367577
Biweight21.24201794889360.271511257031226
Cosine21.10824947794950.274283646469291
Optcosine21.29934729358390.272939340790838

\begin{tabular}{lllllllll}
\hline
Maximum Density Values \tabularnewline
Kernel & x-value & max. density \tabularnewline
Gaussian & 21.0127005701323 & 0.297558100698876 \tabularnewline
Epanechnikov & 21.3375668567108 & 0.274827206845523 \tabularnewline
Rectangular & 21.4522255460914 & 0.299679396065033 \tabularnewline
Triangular & 21.0127005701323 & 0.306535759367577 \tabularnewline
Biweight & 21.2420179488936 & 0.271511257031226 \tabularnewline
Cosine & 21.1082494779495 & 0.274283646469291 \tabularnewline
Optcosine & 21.2993472935839 & 0.272939340790838 \tabularnewline
 \hline
\end{tabular}
%Source: https://freestatistics.org/blog/index.php?pk=270617&T=12

[TABLE]
[ROW][C]Maximum Density Values[/C][/ROW]
[ROW][C]Kernel[/C][C]x-value[/C][C]max. density[/C][/ROW]
[ROW][C]Gaussian[/C][C]21.0127005701323[/C][C]0.297558100698876[/C][/ROW]
[ROW][C]Epanechnikov[/C][C]21.3375668567108[/C][C]0.274827206845523[/C][/ROW]
[ROW][C]Rectangular[/C][C]21.4522255460914[/C][C]0.299679396065033[/C][/ROW]
[ROW][C]Triangular[/C][C]21.0127005701323[/C][C]0.306535759367577[/C][/ROW]
[ROW][C]Biweight[/C][C]21.2420179488936[/C][C]0.271511257031226[/C][/ROW]
[ROW][C]Cosine[/C][C]21.1082494779495[/C][C]0.274283646469291[/C][/ROW]
[ROW][C]Optcosine[/C][C]21.2993472935839[/C][C]0.272939340790838[/C][/ROW]
 [/TABLE]
Source: https://freestatistics.org/blog/index.php?pk=270617&T=12

Globally Unique Identifier (entire table): ba.freestatistics.org/blog/index.php?pk=270617&T=12

As an alternative you can also use a QR Code:  

The GUIDs for individual cells are displayed in the table below:

Maximum Density Values
Kernelx-valuemax. density
Gaussian21.01270057013230.297558100698876
Epanechnikov21.33756685671080.274827206845523
Rectangular21.45222554609140.299679396065033
Triangular21.01270057013230.306535759367577
Biweight21.24201794889360.271511257031226
Cosine21.10824947794950.274283646469291
Optcosine21.29934729358390.272939340790838


Maximum Density Values
Kernelx-valuemax. density
Gaussian21.01270057013230.297558100698876
Epanechnikov21.33756685671080.274827206845523
Rectangular21.47133532765480.299679396065033
Triangular21.01270057013230.306535759367577
Biweight21.24201794889360.271511257031226
Cosine21.10824947794950.274283646469291
Optcosine21.29934729358390.272939340790838

\begin{tabular}{lllllllll}
\hline
Maximum Density Values \tabularnewline
Kernel & x-value & max. density \tabularnewline
Gaussian & 21.0127005701323 & 0.297558100698876 \tabularnewline
Epanechnikov & 21.3375668567108 & 0.274827206845523 \tabularnewline
Rectangular & 21.4713353276548 & 0.299679396065033 \tabularnewline
Triangular & 21.0127005701323 & 0.306535759367577 \tabularnewline
Biweight & 21.2420179488936 & 0.271511257031226 \tabularnewline
Cosine & 21.1082494779495 & 0.274283646469291 \tabularnewline
Optcosine & 21.2993472935839 & 0.272939340790838 \tabularnewline
 \hline
\end{tabular}
%Source: https://freestatistics.org/blog/index.php?pk=270617&T=13

[TABLE]
[ROW][C]Maximum Density Values[/C][/ROW]
[ROW][C]Kernel[/C][C]x-value[/C][C]max. density[/C][/ROW]
[ROW][C]Gaussian[/C][C]21.0127005701323[/C][C]0.297558100698876[/C][/ROW]
[ROW][C]Epanechnikov[/C][C]21.3375668567108[/C][C]0.274827206845523[/C][/ROW]
[ROW][C]Rectangular[/C][C]21.4713353276548[/C][C]0.299679396065033[/C][/ROW]
[ROW][C]Triangular[/C][C]21.0127005701323[/C][C]0.306535759367577[/C][/ROW]
[ROW][C]Biweight[/C][C]21.2420179488936[/C][C]0.271511257031226[/C][/ROW]
[ROW][C]Cosine[/C][C]21.1082494779495[/C][C]0.274283646469291[/C][/ROW]
[ROW][C]Optcosine[/C][C]21.2993472935839[/C][C]0.272939340790838[/C][/ROW]
 [/TABLE]
Source: https://freestatistics.org/blog/index.php?pk=270617&T=13

Globally Unique Identifier (entire table): ba.freestatistics.org/blog/index.php?pk=270617&T=13

As an alternative you can also use a QR Code:  

The GUIDs for individual cells are displayed in the table below:

Maximum Density Values
Kernelx-valuemax. density
Gaussian21.01270057013230.297558100698876
Epanechnikov21.33756685671080.274827206845523
Rectangular21.47133532765480.299679396065033
Triangular21.01270057013230.306535759367577
Biweight21.24201794889360.271511257031226
Cosine21.10824947794950.274283646469291
Optcosine21.29934729358390.272939340790838


Maximum Density Values
Kernelx-valuemax. density
Gaussian21.01270057013230.297558100698876
Epanechnikov21.33756685671080.274827206845523
Rectangular21.49044510921830.299679396065033
Triangular21.01270057013230.306535759367577
Biweight21.24201794889360.271511257031226
Cosine21.10824947794950.274283646469291
Optcosine21.29934729358390.272939340790838

\begin{tabular}{lllllllll}
\hline
Maximum Density Values \tabularnewline
Kernel & x-value & max. density \tabularnewline
Gaussian & 21.0127005701323 & 0.297558100698876 \tabularnewline
Epanechnikov & 21.3375668567108 & 0.274827206845523 \tabularnewline
Rectangular & 21.4904451092183 & 0.299679396065033 \tabularnewline
Triangular & 21.0127005701323 & 0.306535759367577 \tabularnewline
Biweight & 21.2420179488936 & 0.271511257031226 \tabularnewline
Cosine & 21.1082494779495 & 0.274283646469291 \tabularnewline
Optcosine & 21.2993472935839 & 0.272939340790838 \tabularnewline
 \hline
\end{tabular}
%Source: https://freestatistics.org/blog/index.php?pk=270617&T=14

[TABLE]
[ROW][C]Maximum Density Values[/C][/ROW]
[ROW][C]Kernel[/C][C]x-value[/C][C]max. density[/C][/ROW]
[ROW][C]Gaussian[/C][C]21.0127005701323[/C][C]0.297558100698876[/C][/ROW]
[ROW][C]Epanechnikov[/C][C]21.3375668567108[/C][C]0.274827206845523[/C][/ROW]
[ROW][C]Rectangular[/C][C]21.4904451092183[/C][C]0.299679396065033[/C][/ROW]
[ROW][C]Triangular[/C][C]21.0127005701323[/C][C]0.306535759367577[/C][/ROW]
[ROW][C]Biweight[/C][C]21.2420179488936[/C][C]0.271511257031226[/C][/ROW]
[ROW][C]Cosine[/C][C]21.1082494779495[/C][C]0.274283646469291[/C][/ROW]
[ROW][C]Optcosine[/C][C]21.2993472935839[/C][C]0.272939340790838[/C][/ROW]
 [/TABLE]
Source: https://freestatistics.org/blog/index.php?pk=270617&T=14

Globally Unique Identifier (entire table): ba.freestatistics.org/blog/index.php?pk=270617&T=14

As an alternative you can also use a QR Code:  

The GUIDs for individual cells are displayed in the table below:

Maximum Density Values
Kernelx-valuemax. density
Gaussian21.01270057013230.297558100698876
Epanechnikov21.33756685671080.274827206845523
Rectangular21.49044510921830.299679396065033
Triangular21.01270057013230.306535759367577
Biweight21.24201794889360.271511257031226
Cosine21.10824947794950.274283646469291
Optcosine21.29934729358390.272939340790838


Maximum Density Values
Kernelx-valuemax. density
Gaussian21.01270057013230.297558100698876
Epanechnikov21.33756685671080.274827206845523
Rectangular21.50955489078170.299679396065033
Triangular21.01270057013230.306535759367577
Biweight21.24201794889360.271511257031226
Cosine21.10824947794950.274283646469291
Optcosine21.29934729358390.272939340790838

\begin{tabular}{lllllllll}
\hline
Maximum Density Values \tabularnewline
Kernel & x-value & max. density \tabularnewline
Gaussian & 21.0127005701323 & 0.297558100698876 \tabularnewline
Epanechnikov & 21.3375668567108 & 0.274827206845523 \tabularnewline
Rectangular & 21.5095548907817 & 0.299679396065033 \tabularnewline
Triangular & 21.0127005701323 & 0.306535759367577 \tabularnewline
Biweight & 21.2420179488936 & 0.271511257031226 \tabularnewline
Cosine & 21.1082494779495 & 0.274283646469291 \tabularnewline
Optcosine & 21.2993472935839 & 0.272939340790838 \tabularnewline
 \hline
\end{tabular}
%Source: https://freestatistics.org/blog/index.php?pk=270617&T=15

[TABLE]
[ROW][C]Maximum Density Values[/C][/ROW]
[ROW][C]Kernel[/C][C]x-value[/C][C]max. density[/C][/ROW]
[ROW][C]Gaussian[/C][C]21.0127005701323[/C][C]0.297558100698876[/C][/ROW]
[ROW][C]Epanechnikov[/C][C]21.3375668567108[/C][C]0.274827206845523[/C][/ROW]
[ROW][C]Rectangular[/C][C]21.5095548907817[/C][C]0.299679396065033[/C][/ROW]
[ROW][C]Triangular[/C][C]21.0127005701323[/C][C]0.306535759367577[/C][/ROW]
[ROW][C]Biweight[/C][C]21.2420179488936[/C][C]0.271511257031226[/C][/ROW]
[ROW][C]Cosine[/C][C]21.1082494779495[/C][C]0.274283646469291[/C][/ROW]
[ROW][C]Optcosine[/C][C]21.2993472935839[/C][C]0.272939340790838[/C][/ROW]
 [/TABLE]
Source: https://freestatistics.org/blog/index.php?pk=270617&T=15

Globally Unique Identifier (entire table): ba.freestatistics.org/blog/index.php?pk=270617&T=15

As an alternative you can also use a QR Code:  

The GUIDs for individual cells are displayed in the table below:

Maximum Density Values
Kernelx-valuemax. density
Gaussian21.01270057013230.297558100698876
Epanechnikov21.33756685671080.274827206845523
Rectangular21.50955489078170.299679396065033
Triangular21.01270057013230.306535759367577
Biweight21.24201794889360.271511257031226
Cosine21.10824947794950.274283646469291
Optcosine21.29934729358390.272939340790838


Maximum Density Values
Kernelx-valuemax. density
Gaussian21.01270057013230.297558100698876
Epanechnikov21.33756685671080.274827206845523
Rectangular21.52866467234520.299679396065033
Triangular21.01270057013230.306535759367577
Biweight21.24201794889360.271511257031226
Cosine21.10824947794950.274283646469291
Optcosine21.29934729358390.272939340790838

\begin{tabular}{lllllllll}
\hline
Maximum Density Values \tabularnewline
Kernel & x-value & max. density \tabularnewline
Gaussian & 21.0127005701323 & 0.297558100698876 \tabularnewline
Epanechnikov & 21.3375668567108 & 0.274827206845523 \tabularnewline
Rectangular & 21.5286646723452 & 0.299679396065033 \tabularnewline
Triangular & 21.0127005701323 & 0.306535759367577 \tabularnewline
Biweight & 21.2420179488936 & 0.271511257031226 \tabularnewline
Cosine & 21.1082494779495 & 0.274283646469291 \tabularnewline
Optcosine & 21.2993472935839 & 0.272939340790838 \tabularnewline
 \hline
\end{tabular}
%Source: https://freestatistics.org/blog/index.php?pk=270617&T=16

[TABLE]
[ROW][C]Maximum Density Values[/C][/ROW]
[ROW][C]Kernel[/C][C]x-value[/C][C]max. density[/C][/ROW]
[ROW][C]Gaussian[/C][C]21.0127005701323[/C][C]0.297558100698876[/C][/ROW]
[ROW][C]Epanechnikov[/C][C]21.3375668567108[/C][C]0.274827206845523[/C][/ROW]
[ROW][C]Rectangular[/C][C]21.5286646723452[/C][C]0.299679396065033[/C][/ROW]
[ROW][C]Triangular[/C][C]21.0127005701323[/C][C]0.306535759367577[/C][/ROW]
[ROW][C]Biweight[/C][C]21.2420179488936[/C][C]0.271511257031226[/C][/ROW]
[ROW][C]Cosine[/C][C]21.1082494779495[/C][C]0.274283646469291[/C][/ROW]
[ROW][C]Optcosine[/C][C]21.2993472935839[/C][C]0.272939340790838[/C][/ROW]
 [/TABLE]
Source: https://freestatistics.org/blog/index.php?pk=270617&T=16

Globally Unique Identifier (entire table): ba.freestatistics.org/blog/index.php?pk=270617&T=16

As an alternative you can also use a QR Code:  

The GUIDs for individual cells are displayed in the table below:

Maximum Density Values
Kernelx-valuemax. density
Gaussian21.01270057013230.297558100698876
Epanechnikov21.33756685671080.274827206845523
Rectangular21.52866467234520.299679396065033
Triangular21.01270057013230.306535759367577
Biweight21.24201794889360.271511257031226
Cosine21.10824947794950.274283646469291
Optcosine21.29934729358390.272939340790838


Maximum Density Values
Kernelx-valuemax. density
Gaussian21.01270057013230.297558100698876
Epanechnikov21.33756685671080.274827206845523
Rectangular21.54777445390860.299679396065033
Triangular21.01270057013230.306535759367577
Biweight21.24201794889360.271511257031226
Cosine21.10824947794950.274283646469291
Optcosine21.29934729358390.272939340790838

\begin{tabular}{lllllllll}
\hline
Maximum Density Values \tabularnewline
Kernel & x-value & max. density \tabularnewline
Gaussian & 21.0127005701323 & 0.297558100698876 \tabularnewline
Epanechnikov & 21.3375668567108 & 0.274827206845523 \tabularnewline
Rectangular & 21.5477744539086 & 0.299679396065033 \tabularnewline
Triangular & 21.0127005701323 & 0.306535759367577 \tabularnewline
Biweight & 21.2420179488936 & 0.271511257031226 \tabularnewline
Cosine & 21.1082494779495 & 0.274283646469291 \tabularnewline
Optcosine & 21.2993472935839 & 0.272939340790838 \tabularnewline
 \hline
\end{tabular}
%Source: https://freestatistics.org/blog/index.php?pk=270617&T=17

[TABLE]
[ROW][C]Maximum Density Values[/C][/ROW]
[ROW][C]Kernel[/C][C]x-value[/C][C]max. density[/C][/ROW]
[ROW][C]Gaussian[/C][C]21.0127005701323[/C][C]0.297558100698876[/C][/ROW]
[ROW][C]Epanechnikov[/C][C]21.3375668567108[/C][C]0.274827206845523[/C][/ROW]
[ROW][C]Rectangular[/C][C]21.5477744539086[/C][C]0.299679396065033[/C][/ROW]
[ROW][C]Triangular[/C][C]21.0127005701323[/C][C]0.306535759367577[/C][/ROW]
[ROW][C]Biweight[/C][C]21.2420179488936[/C][C]0.271511257031226[/C][/ROW]
[ROW][C]Cosine[/C][C]21.1082494779495[/C][C]0.274283646469291[/C][/ROW]
[ROW][C]Optcosine[/C][C]21.2993472935839[/C][C]0.272939340790838[/C][/ROW]
 [/TABLE]
Source: https://freestatistics.org/blog/index.php?pk=270617&T=17

Globally Unique Identifier (entire table): ba.freestatistics.org/blog/index.php?pk=270617&T=17

As an alternative you can also use a QR Code:  

The GUIDs for individual cells are displayed in the table below:

Maximum Density Values
Kernelx-valuemax. density
Gaussian21.01270057013230.297558100698876
Epanechnikov21.33756685671080.274827206845523
Rectangular21.54777445390860.299679396065033
Triangular21.01270057013230.306535759367577
Biweight21.24201794889360.271511257031226
Cosine21.10824947794950.274283646469291
Optcosine21.29934729358390.272939340790838


Maximum Density Values
Kernelx-valuemax. density
Gaussian21.01270057013230.297558100698876
Epanechnikov21.33756685671080.274827206845523
Rectangular21.5668842354720.299679396065033
Triangular21.01270057013230.306535759367577
Biweight21.24201794889360.271511257031226
Cosine21.10824947794950.274283646469291
Optcosine21.29934729358390.272939340790838

\begin{tabular}{lllllllll}
\hline
Maximum Density Values \tabularnewline
Kernel & x-value & max. density \tabularnewline
Gaussian & 21.0127005701323 & 0.297558100698876 \tabularnewline
Epanechnikov & 21.3375668567108 & 0.274827206845523 \tabularnewline
Rectangular & 21.566884235472 & 0.299679396065033 \tabularnewline
Triangular & 21.0127005701323 & 0.306535759367577 \tabularnewline
Biweight & 21.2420179488936 & 0.271511257031226 \tabularnewline
Cosine & 21.1082494779495 & 0.274283646469291 \tabularnewline
Optcosine & 21.2993472935839 & 0.272939340790838 \tabularnewline
 \hline
\end{tabular}
%Source: https://freestatistics.org/blog/index.php?pk=270617&T=18

[TABLE]
[ROW][C]Maximum Density Values[/C][/ROW]
[ROW][C]Kernel[/C][C]x-value[/C][C]max. density[/C][/ROW]
[ROW][C]Gaussian[/C][C]21.0127005701323[/C][C]0.297558100698876[/C][/ROW]
[ROW][C]Epanechnikov[/C][C]21.3375668567108[/C][C]0.274827206845523[/C][/ROW]
[ROW][C]Rectangular[/C][C]21.566884235472[/C][C]0.299679396065033[/C][/ROW]
[ROW][C]Triangular[/C][C]21.0127005701323[/C][C]0.306535759367577[/C][/ROW]
[ROW][C]Biweight[/C][C]21.2420179488936[/C][C]0.271511257031226[/C][/ROW]
[ROW][C]Cosine[/C][C]21.1082494779495[/C][C]0.274283646469291[/C][/ROW]
[ROW][C]Optcosine[/C][C]21.2993472935839[/C][C]0.272939340790838[/C][/ROW]
 [/TABLE]
Source: https://freestatistics.org/blog/index.php?pk=270617&T=18

Globally Unique Identifier (entire table): ba.freestatistics.org/blog/index.php?pk=270617&T=18

As an alternative you can also use a QR Code:  

The GUIDs for individual cells are displayed in the table below:

Maximum Density Values
Kernelx-valuemax. density
Gaussian21.01270057013230.297558100698876
Epanechnikov21.33756685671080.274827206845523
Rectangular21.5668842354720.299679396065033
Triangular21.01270057013230.306535759367577
Biweight21.24201794889360.271511257031226
Cosine21.10824947794950.274283646469291
Optcosine21.29934729358390.272939340790838


Maximum Density Values
Kernelx-valuemax. density
Gaussian21.01270057013230.297558100698876
Epanechnikov21.33756685671080.274827206845523
Rectangular21.58599401703550.299679396065033
Triangular21.01270057013230.306535759367577
Biweight21.24201794889360.271511257031226
Cosine21.10824947794950.274283646469291
Optcosine21.29934729358390.272939340790838

\begin{tabular}{lllllllll}
\hline
Maximum Density Values \tabularnewline
Kernel & x-value & max. density \tabularnewline
Gaussian & 21.0127005701323 & 0.297558100698876 \tabularnewline
Epanechnikov & 21.3375668567108 & 0.274827206845523 \tabularnewline
Rectangular & 21.5859940170355 & 0.299679396065033 \tabularnewline
Triangular & 21.0127005701323 & 0.306535759367577 \tabularnewline
Biweight & 21.2420179488936 & 0.271511257031226 \tabularnewline
Cosine & 21.1082494779495 & 0.274283646469291 \tabularnewline
Optcosine & 21.2993472935839 & 0.272939340790838 \tabularnewline
 \hline
\end{tabular}
%Source: https://freestatistics.org/blog/index.php?pk=270617&T=19

[TABLE]
[ROW][C]Maximum Density Values[/C][/ROW]
[ROW][C]Kernel[/C][C]x-value[/C][C]max. density[/C][/ROW]
[ROW][C]Gaussian[/C][C]21.0127005701323[/C][C]0.297558100698876[/C][/ROW]
[ROW][C]Epanechnikov[/C][C]21.3375668567108[/C][C]0.274827206845523[/C][/ROW]
[ROW][C]Rectangular[/C][C]21.5859940170355[/C][C]0.299679396065033[/C][/ROW]
[ROW][C]Triangular[/C][C]21.0127005701323[/C][C]0.306535759367577[/C][/ROW]
[ROW][C]Biweight[/C][C]21.2420179488936[/C][C]0.271511257031226[/C][/ROW]
[ROW][C]Cosine[/C][C]21.1082494779495[/C][C]0.274283646469291[/C][/ROW]
[ROW][C]Optcosine[/C][C]21.2993472935839[/C][C]0.272939340790838[/C][/ROW]
 [/TABLE]
Source: https://freestatistics.org/blog/index.php?pk=270617&T=19

Globally Unique Identifier (entire table): ba.freestatistics.org/blog/index.php?pk=270617&T=19

As an alternative you can also use a QR Code:  

The GUIDs for individual cells are displayed in the table below:

Maximum Density Values
Kernelx-valuemax. density
Gaussian21.01270057013230.297558100698876
Epanechnikov21.33756685671080.274827206845523
Rectangular21.58599401703550.299679396065033
Triangular21.01270057013230.306535759367577
Biweight21.24201794889360.271511257031226
Cosine21.10824947794950.274283646469291
Optcosine21.29934729358390.272939340790838


Maximum Density Values
Kernelx-valuemax. density
Gaussian21.01270057013230.297558100698876
Epanechnikov21.33756685671080.274827206845523
Rectangular21.60510379859890.299679396065033
Triangular21.01270057013230.306535759367577
Biweight21.24201794889360.271511257031226
Cosine21.10824947794950.274283646469291
Optcosine21.29934729358390.272939340790838

\begin{tabular}{lllllllll}
\hline
Maximum Density Values \tabularnewline
Kernel & x-value & max. density \tabularnewline
Gaussian & 21.0127005701323 & 0.297558100698876 \tabularnewline
Epanechnikov & 21.3375668567108 & 0.274827206845523 \tabularnewline
Rectangular & 21.6051037985989 & 0.299679396065033 \tabularnewline
Triangular & 21.0127005701323 & 0.306535759367577 \tabularnewline
Biweight & 21.2420179488936 & 0.271511257031226 \tabularnewline
Cosine & 21.1082494779495 & 0.274283646469291 \tabularnewline
Optcosine & 21.2993472935839 & 0.272939340790838 \tabularnewline
 \hline
\end{tabular}
%Source: https://freestatistics.org/blog/index.php?pk=270617&T=20

[TABLE]
[ROW][C]Maximum Density Values[/C][/ROW]
[ROW][C]Kernel[/C][C]x-value[/C][C]max. density[/C][/ROW]
[ROW][C]Gaussian[/C][C]21.0127005701323[/C][C]0.297558100698876[/C][/ROW]
[ROW][C]Epanechnikov[/C][C]21.3375668567108[/C][C]0.274827206845523[/C][/ROW]
[ROW][C]Rectangular[/C][C]21.6051037985989[/C][C]0.299679396065033[/C][/ROW]
[ROW][C]Triangular[/C][C]21.0127005701323[/C][C]0.306535759367577[/C][/ROW]
[ROW][C]Biweight[/C][C]21.2420179488936[/C][C]0.271511257031226[/C][/ROW]
[ROW][C]Cosine[/C][C]21.1082494779495[/C][C]0.274283646469291[/C][/ROW]
[ROW][C]Optcosine[/C][C]21.2993472935839[/C][C]0.272939340790838[/C][/ROW]
 [/TABLE]
Source: https://freestatistics.org/blog/index.php?pk=270617&T=20

Globally Unique Identifier (entire table): ba.freestatistics.org/blog/index.php?pk=270617&T=20

As an alternative you can also use a QR Code:  

The GUIDs for individual cells are displayed in the table below:

Maximum Density Values
Kernelx-valuemax. density
Gaussian21.01270057013230.297558100698876
Epanechnikov21.33756685671080.274827206845523
Rectangular21.60510379859890.299679396065033
Triangular21.01270057013230.306535759367577
Biweight21.24201794889360.271511257031226
Cosine21.10824947794950.274283646469291
Optcosine21.29934729358390.272939340790838


Maximum Density Values
Kernelx-valuemax. density
Gaussian21.01270057013230.297558100698876
Epanechnikov21.33756685671080.274827206845523
Rectangular21.62421358016230.299679396065033
Triangular21.01270057013230.306535759367577
Biweight21.24201794889360.271511257031226
Cosine21.10824947794950.274283646469291
Optcosine21.29934729358390.272939340790838

\begin{tabular}{lllllllll}
\hline
Maximum Density Values \tabularnewline
Kernel & x-value & max. density \tabularnewline
Gaussian & 21.0127005701323 & 0.297558100698876 \tabularnewline
Epanechnikov & 21.3375668567108 & 0.274827206845523 \tabularnewline
Rectangular & 21.6242135801623 & 0.299679396065033 \tabularnewline
Triangular & 21.0127005701323 & 0.306535759367577 \tabularnewline
Biweight & 21.2420179488936 & 0.271511257031226 \tabularnewline
Cosine & 21.1082494779495 & 0.274283646469291 \tabularnewline
Optcosine & 21.2993472935839 & 0.272939340790838 \tabularnewline
 \hline
\end{tabular}
%Source: https://freestatistics.org/blog/index.php?pk=270617&T=21

[TABLE]
[ROW][C]Maximum Density Values[/C][/ROW]
[ROW][C]Kernel[/C][C]x-value[/C][C]max. density[/C][/ROW]
[ROW][C]Gaussian[/C][C]21.0127005701323[/C][C]0.297558100698876[/C][/ROW]
[ROW][C]Epanechnikov[/C][C]21.3375668567108[/C][C]0.274827206845523[/C][/ROW]
[ROW][C]Rectangular[/C][C]21.6242135801623[/C][C]0.299679396065033[/C][/ROW]
[ROW][C]Triangular[/C][C]21.0127005701323[/C][C]0.306535759367577[/C][/ROW]
[ROW][C]Biweight[/C][C]21.2420179488936[/C][C]0.271511257031226[/C][/ROW]
[ROW][C]Cosine[/C][C]21.1082494779495[/C][C]0.274283646469291[/C][/ROW]
[ROW][C]Optcosine[/C][C]21.2993472935839[/C][C]0.272939340790838[/C][/ROW]
 [/TABLE]
Source: https://freestatistics.org/blog/index.php?pk=270617&T=21

Globally Unique Identifier (entire table): ba.freestatistics.org/blog/index.php?pk=270617&T=21

As an alternative you can also use a QR Code:  

The GUIDs for individual cells are displayed in the table below:

Maximum Density Values
Kernelx-valuemax. density
Gaussian21.01270057013230.297558100698876
Epanechnikov21.33756685671080.274827206845523
Rectangular21.62421358016230.299679396065033
Triangular21.01270057013230.306535759367577
Biweight21.24201794889360.271511257031226
Cosine21.10824947794950.274283646469291
Optcosine21.29934729358390.272939340790838


Maximum Density Values
Kernelx-valuemax. density
Gaussian21.01270057013230.297558100698876
Epanechnikov21.33756685671080.274827206845523
Rectangular21.64332336172580.299679396065033
Triangular21.01270057013230.306535759367577
Biweight21.24201794889360.271511257031226
Cosine21.10824947794950.274283646469291
Optcosine21.29934729358390.272939340790838

\begin{tabular}{lllllllll}
\hline
Maximum Density Values \tabularnewline
Kernel & x-value & max. density \tabularnewline
Gaussian & 21.0127005701323 & 0.297558100698876 \tabularnewline
Epanechnikov & 21.3375668567108 & 0.274827206845523 \tabularnewline
Rectangular & 21.6433233617258 & 0.299679396065033 \tabularnewline
Triangular & 21.0127005701323 & 0.306535759367577 \tabularnewline
Biweight & 21.2420179488936 & 0.271511257031226 \tabularnewline
Cosine & 21.1082494779495 & 0.274283646469291 \tabularnewline
Optcosine & 21.2993472935839 & 0.272939340790838 \tabularnewline
 \hline
\end{tabular}
%Source: https://freestatistics.org/blog/index.php?pk=270617&T=22

[TABLE]
[ROW][C]Maximum Density Values[/C][/ROW]
[ROW][C]Kernel[/C][C]x-value[/C][C]max. density[/C][/ROW]
[ROW][C]Gaussian[/C][C]21.0127005701323[/C][C]0.297558100698876[/C][/ROW]
[ROW][C]Epanechnikov[/C][C]21.3375668567108[/C][C]0.274827206845523[/C][/ROW]
[ROW][C]Rectangular[/C][C]21.6433233617258[/C][C]0.299679396065033[/C][/ROW]
[ROW][C]Triangular[/C][C]21.0127005701323[/C][C]0.306535759367577[/C][/ROW]
[ROW][C]Biweight[/C][C]21.2420179488936[/C][C]0.271511257031226[/C][/ROW]
[ROW][C]Cosine[/C][C]21.1082494779495[/C][C]0.274283646469291[/C][/ROW]
[ROW][C]Optcosine[/C][C]21.2993472935839[/C][C]0.272939340790838[/C][/ROW]
 [/TABLE]
Source: https://freestatistics.org/blog/index.php?pk=270617&T=22

Globally Unique Identifier (entire table): ba.freestatistics.org/blog/index.php?pk=270617&T=22

As an alternative you can also use a QR Code:  

The GUIDs for individual cells are displayed in the table below:

Maximum Density Values
Kernelx-valuemax. density
Gaussian21.01270057013230.297558100698876
Epanechnikov21.33756685671080.274827206845523
Rectangular21.64332336172580.299679396065033
Triangular21.01270057013230.306535759367577
Biweight21.24201794889360.271511257031226
Cosine21.10824947794950.274283646469291
Optcosine21.29934729358390.272939340790838


Maximum Density Values
Kernelx-valuemax. density
Gaussian21.01270057013230.297558100698876
Epanechnikov21.33756685671080.274827206845523
Rectangular21.66243314328920.299679396065033
Triangular21.01270057013230.306535759367577
Biweight21.24201794889360.271511257031226
Cosine21.10824947794950.274283646469291
Optcosine21.29934729358390.272939340790838

\begin{tabular}{lllllllll}
\hline
Maximum Density Values \tabularnewline
Kernel & x-value & max. density \tabularnewline
Gaussian & 21.0127005701323 & 0.297558100698876 \tabularnewline
Epanechnikov & 21.3375668567108 & 0.274827206845523 \tabularnewline
Rectangular & 21.6624331432892 & 0.299679396065033 \tabularnewline
Triangular & 21.0127005701323 & 0.306535759367577 \tabularnewline
Biweight & 21.2420179488936 & 0.271511257031226 \tabularnewline
Cosine & 21.1082494779495 & 0.274283646469291 \tabularnewline
Optcosine & 21.2993472935839 & 0.272939340790838 \tabularnewline
 \hline
\end{tabular}
%Source: https://freestatistics.org/blog/index.php?pk=270617&T=23

[TABLE]
[ROW][C]Maximum Density Values[/C][/ROW]
[ROW][C]Kernel[/C][C]x-value[/C][C]max. density[/C][/ROW]
[ROW][C]Gaussian[/C][C]21.0127005701323[/C][C]0.297558100698876[/C][/ROW]
[ROW][C]Epanechnikov[/C][C]21.3375668567108[/C][C]0.274827206845523[/C][/ROW]
[ROW][C]Rectangular[/C][C]21.6624331432892[/C][C]0.299679396065033[/C][/ROW]
[ROW][C]Triangular[/C][C]21.0127005701323[/C][C]0.306535759367577[/C][/ROW]
[ROW][C]Biweight[/C][C]21.2420179488936[/C][C]0.271511257031226[/C][/ROW]
[ROW][C]Cosine[/C][C]21.1082494779495[/C][C]0.274283646469291[/C][/ROW]
[ROW][C]Optcosine[/C][C]21.2993472935839[/C][C]0.272939340790838[/C][/ROW]
 [/TABLE]
Source: https://freestatistics.org/blog/index.php?pk=270617&T=23

Globally Unique Identifier (entire table): ba.freestatistics.org/blog/index.php?pk=270617&T=23

As an alternative you can also use a QR Code:  

The GUIDs for individual cells are displayed in the table below:

Maximum Density Values
Kernelx-valuemax. density
Gaussian21.01270057013230.297558100698876
Epanechnikov21.33756685671080.274827206845523
Rectangular21.66243314328920.299679396065033
Triangular21.01270057013230.306535759367577
Biweight21.24201794889360.271511257031226
Cosine21.10824947794950.274283646469291
Optcosine21.29934729358390.272939340790838


Maximum Density Values
Kernelx-valuemax. density
Gaussian21.01270057013230.297558100698876
Epanechnikov21.33756685671080.274827206845523
Rectangular21.68154292485270.299679396065033
Triangular21.01270057013230.306535759367577
Biweight21.24201794889360.271511257031226
Cosine21.10824947794950.274283646469291
Optcosine21.29934729358390.272939340790838

\begin{tabular}{lllllllll}
\hline
Maximum Density Values \tabularnewline
Kernel & x-value & max. density \tabularnewline
Gaussian & 21.0127005701323 & 0.297558100698876 \tabularnewline
Epanechnikov & 21.3375668567108 & 0.274827206845523 \tabularnewline
Rectangular & 21.6815429248527 & 0.299679396065033 \tabularnewline
Triangular & 21.0127005701323 & 0.306535759367577 \tabularnewline
Biweight & 21.2420179488936 & 0.271511257031226 \tabularnewline
Cosine & 21.1082494779495 & 0.274283646469291 \tabularnewline
Optcosine & 21.2993472935839 & 0.272939340790838 \tabularnewline
 \hline
\end{tabular}
%Source: https://freestatistics.org/blog/index.php?pk=270617&T=24

[TABLE]
[ROW][C]Maximum Density Values[/C][/ROW]
[ROW][C]Kernel[/C][C]x-value[/C][C]max. density[/C][/ROW]
[ROW][C]Gaussian[/C][C]21.0127005701323[/C][C]0.297558100698876[/C][/ROW]
[ROW][C]Epanechnikov[/C][C]21.3375668567108[/C][C]0.274827206845523[/C][/ROW]
[ROW][C]Rectangular[/C][C]21.6815429248527[/C][C]0.299679396065033[/C][/ROW]
[ROW][C]Triangular[/C][C]21.0127005701323[/C][C]0.306535759367577[/C][/ROW]
[ROW][C]Biweight[/C][C]21.2420179488936[/C][C]0.271511257031226[/C][/ROW]
[ROW][C]Cosine[/C][C]21.1082494779495[/C][C]0.274283646469291[/C][/ROW]
[ROW][C]Optcosine[/C][C]21.2993472935839[/C][C]0.272939340790838[/C][/ROW]
 [/TABLE]
Source: https://freestatistics.org/blog/index.php?pk=270617&T=24

Globally Unique Identifier (entire table): ba.freestatistics.org/blog/index.php?pk=270617&T=24

As an alternative you can also use a QR Code:  

The GUIDs for individual cells are displayed in the table below:

Maximum Density Values
Kernelx-valuemax. density
Gaussian21.01270057013230.297558100698876
Epanechnikov21.33756685671080.274827206845523
Rectangular21.68154292485270.299679396065033
Triangular21.01270057013230.306535759367577
Biweight21.24201794889360.271511257031226
Cosine21.10824947794950.274283646469291
Optcosine21.29934729358390.272939340790838


Maximum Density Values
Kernelx-valuemax. density
Gaussian21.01270057013230.297558100698876
Epanechnikov21.33756685671080.274827206845523
Rectangular21.70065270641610.299679396065033
Triangular21.01270057013230.306535759367577
Biweight21.24201794889360.271511257031226
Cosine21.10824947794950.274283646469291
Optcosine21.29934729358390.272939340790838

\begin{tabular}{lllllllll}
\hline
Maximum Density Values \tabularnewline
Kernel & x-value & max. density \tabularnewline
Gaussian & 21.0127005701323 & 0.297558100698876 \tabularnewline
Epanechnikov & 21.3375668567108 & 0.274827206845523 \tabularnewline
Rectangular & 21.7006527064161 & 0.299679396065033 \tabularnewline
Triangular & 21.0127005701323 & 0.306535759367577 \tabularnewline
Biweight & 21.2420179488936 & 0.271511257031226 \tabularnewline
Cosine & 21.1082494779495 & 0.274283646469291 \tabularnewline
Optcosine & 21.2993472935839 & 0.272939340790838 \tabularnewline
 \hline
\end{tabular}
%Source: https://freestatistics.org/blog/index.php?pk=270617&T=25

[TABLE]
[ROW][C]Maximum Density Values[/C][/ROW]
[ROW][C]Kernel[/C][C]x-value[/C][C]max. density[/C][/ROW]
[ROW][C]Gaussian[/C][C]21.0127005701323[/C][C]0.297558100698876[/C][/ROW]
[ROW][C]Epanechnikov[/C][C]21.3375668567108[/C][C]0.274827206845523[/C][/ROW]
[ROW][C]Rectangular[/C][C]21.7006527064161[/C][C]0.299679396065033[/C][/ROW]
[ROW][C]Triangular[/C][C]21.0127005701323[/C][C]0.306535759367577[/C][/ROW]
[ROW][C]Biweight[/C][C]21.2420179488936[/C][C]0.271511257031226[/C][/ROW]
[ROW][C]Cosine[/C][C]21.1082494779495[/C][C]0.274283646469291[/C][/ROW]
[ROW][C]Optcosine[/C][C]21.2993472935839[/C][C]0.272939340790838[/C][/ROW]
 [/TABLE]
Source: https://freestatistics.org/blog/index.php?pk=270617&T=25

Globally Unique Identifier (entire table): ba.freestatistics.org/blog/index.php?pk=270617&T=25

As an alternative you can also use a QR Code:  

The GUIDs for individual cells are displayed in the table below:

Maximum Density Values
Kernelx-valuemax. density
Gaussian21.01270057013230.297558100698876
Epanechnikov21.33756685671080.274827206845523
Rectangular21.70065270641610.299679396065033
Triangular21.01270057013230.306535759367577
Biweight21.24201794889360.271511257031226
Cosine21.10824947794950.274283646469291
Optcosine21.29934729358390.272939340790838


Maximum Density Values
Kernelx-valuemax. density
Gaussian21.01270057013230.297558100698876
Epanechnikov21.33756685671080.274827206845523
Rectangular21.71976248797950.299679396065033
Triangular21.01270057013230.306535759367577
Biweight21.24201794889360.271511257031226
Cosine21.10824947794950.274283646469291
Optcosine21.29934729358390.272939340790838

\begin{tabular}{lllllllll}
\hline
Maximum Density Values \tabularnewline
Kernel & x-value & max. density \tabularnewline
Gaussian & 21.0127005701323 & 0.297558100698876 \tabularnewline
Epanechnikov & 21.3375668567108 & 0.274827206845523 \tabularnewline
Rectangular & 21.7197624879795 & 0.299679396065033 \tabularnewline
Triangular & 21.0127005701323 & 0.306535759367577 \tabularnewline
Biweight & 21.2420179488936 & 0.271511257031226 \tabularnewline
Cosine & 21.1082494779495 & 0.274283646469291 \tabularnewline
Optcosine & 21.2993472935839 & 0.272939340790838 \tabularnewline
\hline
\end{tabular}
%Source: https://freestatistics.org/blog/index.php?pk=270617&T=26

[TABLE]
[ROW][C]Maximum Density Values[/C][/ROW]
[ROW][C]Kernel[/C][C]x-value[/C][C]max. density[/C][/ROW]
[ROW][C]Gaussian[/C][C]21.0127005701323[/C][C]0.297558100698876[/C][/ROW]
[ROW][C]Epanechnikov[/C][C]21.3375668567108[/C][C]0.274827206845523[/C][/ROW]
[ROW][C]Rectangular[/C][C]21.7197624879795[/C][C]0.299679396065033[/C][/ROW]
[ROW][C]Triangular[/C][C]21.0127005701323[/C][C]0.306535759367577[/C][/ROW]
[ROW][C]Biweight[/C][C]21.2420179488936[/C][C]0.271511257031226[/C][/ROW]
[ROW][C]Cosine[/C][C]21.1082494779495[/C][C]0.274283646469291[/C][/ROW]
[ROW][C]Optcosine[/C][C]21.2993472935839[/C][C]0.272939340790838[/C][/ROW]
[/TABLE]
Source: https://freestatistics.org/blog/index.php?pk=270617&T=26

Globally Unique Identifier (entire table): ba.freestatistics.org/blog/index.php?pk=270617&T=26

As an alternative you can also use a QR Code:  

The GUIDs for individual cells are displayed in the table below:

Maximum Density Values
Kernelx-valuemax. density
Gaussian21.01270057013230.297558100698876
Epanechnikov21.33756685671080.274827206845523
Rectangular21.71976248797950.299679396065033
Triangular21.01270057013230.306535759367577
Biweight21.24201794889360.271511257031226
Cosine21.10824947794950.274283646469291
Optcosine21.29934729358390.272939340790838


Parameters (Session):
par1 = 0 ; par2 = no ; par3 = 512 ;
Parameters (R input):
par1 = 0 ; par2 = no ; par3 = 512 ;
R code (references can be found in the software module):
if (par1 == '0') bw <- 'nrd0'
if (par1 != '0') bw <- as.numeric(par1)
par3 <- as.numeric(par3)
mydensity <- array(NA, dim=c(par3,8))
bitmap(file='density1.png')
mydensity1<-density(x,bw=bw,kernel='gaussian',na.rm=TRUE)
mydensity[,8] = signif(mydensity1$x,3)
mydensity[,1] = signif(mydensity1$y,3)
plot(mydensity1,main='Gaussian Kernel',xlab=xlab,ylab=ylab)
grid()
dev.off()
mydensity1
bitmap(file='density2.png')
mydensity2<-density(x,bw=bw,kernel='epanechnikov',na.rm=TRUE)
mydensity[,2] = signif(mydensity2$y,3)
plot(mydensity2,main='Epanechnikov Kernel',xlab=xlab,ylab=ylab)
grid()
dev.off()
bitmap(file='density3.png')
mydensity3<-density(x,bw=bw,kernel='rectangular',na.rm=TRUE)
mydensity[,3] = signif(mydensity3$y,3)
plot(mydensity3,main='Rectangular Kernel',xlab=xlab,ylab=ylab)
grid()
dev.off()
bitmap(file='density4.png')
mydensity4<-density(x,bw=bw,kernel='triangular',na.rm=TRUE)
mydensity[,4] = signif(mydensity4$y,3)
plot(mydensity4,main='Triangular Kernel',xlab=xlab,ylab=ylab)
grid()
dev.off()
bitmap(file='density5.png')
mydensity5<-density(x,bw=bw,kernel='biweight',na.rm=TRUE)
mydensity[,5] = signif(mydensity5$y,3)
plot(mydensity5,main='Biweight Kernel',xlab=xlab,ylab=ylab)
grid()
dev.off()
bitmap(file='density6.png')
mydensity6<-density(x,bw=bw,kernel='cosine',na.rm=TRUE)
mydensity[,6] = signif(mydensity6$y,3)
plot(mydensity6,main='Cosine Kernel',xlab=xlab,ylab=ylab)
grid()
dev.off()
bitmap(file='density7.png')
mydensity7<-density(x,bw=bw,kernel='optcosine',na.rm=TRUE)
mydensity[,7] = signif(mydensity7$y,3)
plot(mydensity7,main='Optcosine Kernel',xlab=xlab,ylab=ylab)
grid()
dev.off()
load(file='createtable')
a<-table.start()
a<-table.row.start(a)
a<-table.element(a,'Properties of Density Trace',2,TRUE)
a<-table.row.end(a)
a<-table.row.start(a)
a<-table.element(a,'Bandwidth',header=TRUE)
a<-table.element(a,mydensity1$bw)
a<-table.row.end(a)
a<-table.row.start(a)
a<-table.element(a,'#Observations',header=TRUE)
a<-table.element(a,mydensity1$n)
a<-table.row.end(a)
a<-table.end(a)
table.save(a,file='mytable.tab')
a<-table.start()
a<-table.row.start(a)
a<-table.element(a,'Maximum Density Values',3,TRUE)
a<-table.row.end(a)
a<-table.row.start(a)
a<-table.element(a,'Kernel',1,TRUE)
a<-table.element(a,'x-value',1,TRUE)
a<-table.element(a,'max. density',1,TRUE)
a<-table.row.end(a)
a<-table.row.start(a)
a<-table.element(a,'Gaussian',1,TRUE)
a<-table.element(a,mydensity1$x[mydensity1$y==max(mydensity1$y)],1)
a<-table.element(a,mydensity1$y[mydensity1$y==max(mydensity1$y)],1)
a<-table.row.end(a)
a<-table.row.start(a)
a<-table.element(a,'Epanechnikov',1,TRUE)
a<-table.element(a,mydensity2$x[mydensity2$y==max(mydensity2$y)],1)
a<-table.element(a,mydensity2$y[mydensity2$y==max(mydensity2$y)],1)
a<-table.row.end(a)
a<-table.row.start(a)
a<-table.element(a,'Rectangular',1,TRUE)
a<-table.element(a,mydensity3$x[mydensity3$y==max(mydensity3$y)],1)
a<-table.element(a,mydensity3$y[mydensity3$y==max(mydensity3$y)],1)
a<-table.row.end(a)
a<-table.row.start(a)
a<-table.element(a,'Triangular',1,TRUE)
a<-table.element(a,mydensity4$x[mydensity4$y==max(mydensity4$y)],1)
a<-table.element(a,mydensity4$y[mydensity4$y==max(mydensity4$y)],1)
a<-table.row.end(a)
a<-table.row.start(a)
a<-table.element(a,'Biweight',1,TRUE)
a<-table.element(a,mydensity5$x[mydensity5$y==max(mydensity5$y)],1)
a<-table.element(a,mydensity5$y[mydensity5$y==max(mydensity5$y)],1)
a<-table.row.end(a)
a<-table.row.start(a)
a<-table.element(a,'Cosine',1,TRUE)
a<-table.element(a,mydensity6$x[mydensity6$y==max(mydensity6$y)],1)
a<-table.element(a,mydensity6$y[mydensity6$y==max(mydensity6$y)],1)
a<-table.row.end(a)
a<-table.row.start(a)
a<-table.element(a,'Optcosine',1,TRUE)
a<-table.element(a,mydensity7$x[mydensity7$y==max(mydensity7$y)],1)
a<-table.element(a,mydensity7$y[mydensity7$y==max(mydensity7$y)],1)
a<-table.row.end(a)
a<-table.end(a)
table.save(a,file='mytable2.tab')
if (par2=='yes') {
a<-table.start()
a<-table.row.start(a)
a<-table.element(a,'Kernel Density Values',8,TRUE)
a<-table.row.end(a)
a<-table.row.start(a)
a<-table.element(a,'x-value',1,TRUE)
a<-table.element(a,'Gaussian',1,TRUE)
a<-table.element(a,'Epanechnikov',1,TRUE)
a<-table.element(a,'Rectangular',1,TRUE)
a<-table.element(a,'Triangular',1,TRUE)
a<-table.element(a,'Biweight',1,TRUE)
a<-table.element(a,'Cosine',1,TRUE)
a<-table.element(a,'Optcosine',1,TRUE)
a<-table.row.end(a)
for(i in 1:par3) {
a<-table.row.start(a)
a<-table.element(a,mydensity[i,8],1,TRUE)
for(j in 1:7) {
a<-table.element(a,mydensity[i,j],1)
}
a<-table.row.end(a)
}
a<-table.end(a)
table.save(a,file='mytable1.tab')
}